Impact of regional trading blocs and free trading agreements on bilateral trade an application of gravity model in international trade
Bạn đang xem bản rút gọn của tài liệu. Xem và tải ngay bản đầy đủ của tài liệu tại đây (1.3 MB, 232 trang )
IMPACT OF REGIONAL TRADING BLOCS AND FREE TRADING
AGREEMENTS ON BILATERAL TRADE:
AN APPLICATION OF GRAVITY MODEL IN INTERNATIONAL
TRADE
KEEMBIYA HETTIGE NANDASIRI
B.A. (hon) Economics, Peradeniya
A THESIS SUBMITTED
FOR THE DEGREE OF MASTER OF SOCIAL SCIENCES
DEPARTMENT OF ECONOMICS
NATIONAL UNIVERSITY OF SINGAPORE
2007
ACKNOWLEDGEMENTS
“A journey is easier when traveling together”. This thesis is the result of one and half
years of work whereby I have been accompanied and supported by many people. It is
a pleasure to acknowledge my gratitude for all of them.
I would like to express my deep and sincere gratitude to my supervisor, Associate
Professor, Jung Hur, whose wide knowledge logical thinking and the
previous
research experience have been of great value for me. His understanding,
encouragement and personal guidance have provided a good basis for the present
thesis.
My sincere thanks are due to Professor. Tilak Abeysinghe, the deputy head and
former director of graduate studies, and Associate Professor, Gamini Premaratne for
their encouragement and consultation on Econometrics issues.
Finally, I should also thank, all NUS academic staff and the research fellows who
attended my thesis pre-submission seminar and made valuable comments on the work
being done, anonymous examiners and to Roshin, Ruwan, Nisantha, Gunasinghe and
Pradeep for assisting me in data collection and proofreading.
*****
ii
TABLE OF CONTENTS
SUMMARY----------------------------------------------------------------------------------- vii
LIST OF TABLES --------------------------------------------------------------------------- ix
LIST OF FIGURES -------------------------------------------------------------------------- xi
LIST OF ABBREVIATIONS -------------------------------------------------------------xiii
CHAPTER- I ----------------------------------------------------------------------------------- 1
INTRODUCTION ------------------------------------------------------------------------------ 1
1.1 THREE FACES OF WORLD TRADE LIBERALIZATION:
MULTILATERALISM, REGIONALISM, AND BILATERALISM -------- 1
1.2
OBJECTIVES OF THE STUDY -------------------------------------------------- 3
1.3
MOTIVATION AND RESEARCH QUESTIONS------------------------------ 4
1.4
METHODOLOGY -----------------------------------------------------------------11
1.5
ORGANIZATION OF THE REST OF THE THESIS -------------------------12
CHAPTER II ----------------------------------------------------------------------------------13
LITERATURE REVIEW ---------------------------------------------------------------------13
2.1
ORIGINS OF GRAVITY - NEWTON’S APPLE ------------------------------13
2.2
GRAVITY FROM PHYSICS TO ECONOMICS ------------------------------14
2.3
EMPIRICAL APPLICATIONS OF TRADE GRAVITY MODEL ----------19
2.3.1 Studies purely tested for empirical existence of Gravity --------------------19
2.3.2 Studies extended Gravity model to measure the impact of other
determinants of trade -------------------------------------------------------------21
2.4
KNOWLEDGE GAP AND OUR CONTRIBUTION--------------------------31
CHAPTER -III --------------------------------------------------------------------------------32
CONCEPTUAL FRAMEWORK AND MODEL BUILDING --------------------------32
3.1
SIMPLEST VERSION OF GRAVITY MODEL -------------------------------32
iii
3.2
AUGMENTED GRAVITY EQUATION ---------------------------------------38
3.3
MODIFICATIONS AND UNDERLINING CONCEPTUAL
FRAMEWORK ---------------------------------------------------------------------40
A.
Using single trade flow (Export) instead of aggregate trade flow
(Export + import) -----------------------------------------------------------------40
B.
Using Purchasing Power Parity (PPP) adjusted GDP and Trade data -----41
C.
Taking internal transport cost into account------------------------------------44
D.
Alternative measure for remoteness--------------------------------------------46
E.
Using f.o.b (free on board) values in place of c.i.f
(cost insurance freight) values. -------------------------------------------------49
F.
Introducing a proxy for international price term------------------------------50
3.4
SOURCES AND COVERAGE OF DATA -------------------------------------52
CHAPTER IV ---------------------------------------------------------------------------------55
REVISITING TRADE GRAVITY MODEL WITH ALTERNATIVE ESTIMATING
TECHNIQUES----------------------------------------------------------------------55
4.1
ECONOMETRICS MODEL ------------------------------------------------------55
4.2
ECONOMETRICS ISSUES – CROSS-SECTIONAL GRAVITY MODELS
----------------------------------------------------------------------------------------58
4.3
ECONOMETRICS ISSUES – PANEL DATA GRAVITY MODELS ------68
4.4
ESTIMATED RESULTS AND DISCUSSION---------------------------------76
CHAPTER –V---------------------------------------------------------------------------------86
ROLE OF FTA IN PRESENCE OF TRADE CREATION OR DIVERSION
BY RTB------------------------------------------------------------------------------86
5.1
EXTENDING GRAVITY MODEL TO CAPTURE FTA AND RTB
IMPACT -----------------------------------------------------------------------------87
5.2
TWO PERIOD PANEL DATA ANALYSIS: TRADE CREATION (TC)
TRADE DIVERSION (TD) AND NET TRADE CREATION (NTC) BY
SELECTED REGIONAL TRADING BLOCKS (RTBs) ---------------------93
5.2.1 Trade creation, trade diversion, and FTA interactive effect of European
Union-------------------------------------------------------------------------------93
iv
5.2.2 Trade creation, trade diversion, and FTA interactive effect of NAFTA---98
5.2.3 Trade creation, trade diversion, and FTA interactive effect of ASEAN- 101
5.2.4 Trade creation, trade diversion, and FTA interactive effect of EFTA --- 104
5.2.5 Trade creation, trade diversion, and FTA interactive effect of
DR-CAFTA --------------------------------------------------------------------- 106
5.2.6 Trade creation, trade diversion effect of SAARC -------------------------- 108
5.2.7 Trade creation, trade diversion effect of CARICOM ---------------------- 109
5.2.8 Trade creation, trade diversion effect of WTO ----------------------------- 110
CHAPTER VI ------------------------------------------------------------------------------- 112
AVERAGE TREATMENT EFFECT OF FTA ------------------------------------------ 112
6.1
FAILURE OF CROSS-SECTIONAL GRAVITY MODELS TO ESTIMATE
ATE OF FTA---------------------------------------------------------------------- 114
6.2
PREVIOUS STUDIES ESTIMATING FTA IMPACT---------------------- 118
6.3
ESTIMATION BACKGROUND----------------------------------------------- 121
6.3.1 Fixed effect Estimation (FE) -------------------------------------------------- 121
6.3.2 Random effect Estimation (RE) ---------------------------------------------- 131
6.3.3 Panel First Difference ---------------------------------------------------------- 132
CHAPTER VII ------------------------------------------------------------------------------ 141
SENSITIVITY ANALYSIS ---------------------------------------------------------------- 141
7.1
SENSITIVITY TEST-1 ---------------------------------------------------------- 141
7.2
SENSITIVITY TEST-2 ---------------------------------------------------------- 143
7.3
SENSITIVITY TEAST-3 -------------------------------------------------------- 145
7.4
SENSITIVITY TEST-4 ---------------------------------------------------------- 146
7.5
SENSITIVITY TEST-5 ---------------------------------------------------------- 148
7.6
CONCLUSION ------------------------------------------------------------------- 151
7.7
LIMITATIONS OF THE STUDY AND SCOPE FOR FUTURE WORK 153
v
BIBLIOGRAPHY -------------------------------------------------------------------------- 155
STATISTICAL APPENDIX ------------------------------------------------------------- 162
DESCRIPTIVE APPENDIX ------------------------------------------------------------- 211
vi
SUMMARY
During the past decade the landscape of world trade liberalization has dramatically
changed to a bilateral phenomena from the multilateral negotiations practiced few
decades ago. Trade Gravity Model has been extensively used in trade literature to
ascertain the impact of both bilateral and multilateral trade liberalizations including
Free Trading Agreements (FTA). The present study argues that cross-sectional gravity
models fail to estimate or overestimate the real impact of FTA due to specification
errors, endogeneity and omitted variable bias. Alternatively, this study shows that
FTA impact can be effectively estimated using more sophisticated panel data analysis.
Using Augmented Gravity Model in Panel context covering 9,832 country pairs (184
countries) over 9 years, the present study examines the impact of FTA, trade creation
(TC) and trade diversion (TD) effects of Regional Trading Blocs (RTBs) and the FTA
and RTB interactive effects in promoting trade for member and non-member
countries with the help of seven selected RTBs, namely; ASEAN, NAFTA, EFTA,
DR-CAFTA, EU, CARICOM and SAARC networked with 79 FTAs. The main
research problems are,
a. What is the average treatment effect of FTA?
b. Are Regional Trading Blocs (RTBs) in general trade creating or diverting?
c. Does an FTA between an outsider and insider country of a RTB create
trade for both parties equally or unequally or does it at least help outsider
countries to overcome any trade diversionary effect caused by RTA?
An extensive research followed by a number of sensitivity analysis robustly concludes
that ATE of FTA is not overwhelming as predicted in trade literature but only about
3%-4% per annum, which implies that the bilateral trade will be doubled only after18vii
19 years for a country pair forming an FTA now, given all the other factors remain
unchanged.
In connection to TC and TD effects of RTB we find mixed results where the intrabloc trade of NAFTA and ASEAN is overwhelming while that of EU and DRCAFTA is moderate. On the other hand, the intra-bloc trade of EFTA is negative
whereas the effects are insignificant for SAARC and CARICOM. Although these
findings suggest most of RTBs are gross trade-creating in general, only NAFTA and
ASEAN was found to be net-trade-creating for the world. All the other examined
blocs show no evidence for either TC or TD with only exception that EU is
marginally trade diverting.
As the first empirical study in trade literature ascertaining RTB and FTA interactive
effects our findings suggest that outsider-countries trading with RTB are adversely
exploited by RTB insider-countries for their own benefits, rather than mutual, in
absence of FTA. More interestingly it was found that the countries being exploited
can effectively reverse their adverse position by forming an FTA with the RTB
concerned.
The bottom line is that trading “with an FTA” is always more beneficial for both
parties than trading “without an FTA”, though the benefits are unequal
Key words:
Gravity Model, Free Trading Agreements, Regional Blocs,
Average treatment effect, trade creation, trade diversion
viii
LIST OF TABLES
TABLE 2.1: COMMON VARIABLES USED IN AUGMENTED GRAVITY
MODEL ------------------------------------------------------------------------18
TABLE 3.1: HYPOTHETICAL EXAMPLE – IMPORTS OF SOYA BEAN TO
SINGAPORE ------------------------------------------------------------------42
TABLE 4.1: GRAVITY MODEL CONTROLLED FOR RTS IMPACT ESTIMATED
BY OLS FOR EACH YEAR 1997-2005 -----------------------------------63
TABLE 4.2: GRAVITY MODEL CONTROLLED FOR RTS IMPACT ESTIMATED
BY FGLS FOR EACH YEAR 1997-2005 ---------------------------------64
TABLE 4.3: GRAVITY MODEL ESTIMATIONS BY DIFFERENT PANEL DATA
SPECIFICATIONS
FOR
THE
PERIOD
1997-2005
[ UN-WEIGHTED DATA] --------------------------------------------------69
TABLE 4.4: GRAVITY MODEL ESTIMATIONS BY DIFFERENT PANEL DATA
SPECIFICATIONS
FOR
THE
PERIOD
1997-2005
[WEIGHTED DATA] --------------------------------------------------------75
TABLE 4.5: CORRELATION MATRIX FOR SELECTED VARIABLES------------79
TABLE 5.1: TRADE CREATION (TC) TRADE DIVERSION (TD) AND NET
TRADE CREATION (NTC) BY SELECTED REGIONAL TRADING
BLOCKS(RTBS) --------------------------------------------------------------94
TABLE 6.1: FTA IMPACT ESTIMATED BY DIFFERENT GRAVITY MODEL
SPECIFICATIONS FOR THE PERIOD 1997-2005 ------------------- 117
TABLE 6.2: PANEL ESTIMATES FOR AVERAGE TRADE TREATMENT
EFFECT OF FTA: FIXED EFFECTS AND RANDOM EFFECT ---- 124
TABLE 6.3: TESTING FOR CAUSALITY IN GRAVITY VARIABLES ----------- 130
TABLE 6.4: PANEL ESTIMATES FOR AVERAGE TREATMENT EFFECT OF
FTA FIRST DIFFERENCE ------------------------------------------------ 134
TABLE 7.1: AVERAGE TREATMENT EFFECT OF FTA ON TOTAL BILATERAL
TRADE ----------------------------------------------------------------------- 143
TABLE 7.2: AVERAGE TREATMENT EFFECT OF FTA WITH CONSTANT
PRICED DATA ------------------------------------------------------------- 144
TABLE 7.3: AVERAGE TREATMENT EFFECT OF FTA ON AVERAGE
BILATERAL TRADE------------------------------------------------------ 146
ix
TABLE 7.4: AVERAGE TREATMENT EFFECT OF FTA ON THE FLOW OF
EXPORT DEFINED AS A PERCENTAGE OF GDP------------------ 147
TABLE 7.5 : DIFFERENCE IN DIFFERENCE ESTIMATOR FOR TWO PERIOD
PANEL DATA ANALYSIS 1997-2005 --------------------------------- 150
x
LIST OF FIGURES
FIGURE 1.1: EVALUATION OF NUMBER OF FTAS 1960-2007 --------------------- 5
FIGURE 1.2: FTA PROLIFERATION IN TERMS OF BTAS 1997-2005 -------------- 6
FIGURE 1.3: EVALUATION OF WORLD EXPORT UNDER FTA 1999-2005 ------ 7
FIGURE 1.4: EUROPEAN UNION (EU) INTRA AND EXTRA TRADE AS A
PERCENTAGE OF EU TOTAL TRADE 1999-2005 --------------------- 8
FIGURE 1.5: ASEAN INTRA AND EXTRA TRADE AS A PERCENTAGE OF
ASEAN TOTAL TRADE 1999-2005 --------------------------------------- 9
FIGURE 1.6: NAFTA INTRA AND EXTRA TRADE AS A PERCENTAGE OF
NAFTA TOTAL TRADE 1999-2005 --------------------------------------10
FIGURE 3.1: AN ILLUSTRATION OF COUNTRIES’ ECONOMIC REMOTENESS
-----------------------------------------------------------------------------------48
FIGURE 4. 1: EVALUATION OF ESTIMATES IN CROSS-SECTIONAL GRAVITY
MODEL OVER THE STUDY PERIOD (1997-2005)--------------------65
FIGURE 4.2: EVOLUTION OF ESTIMATES FOR TIME VARYING FACTORS IN
CROSS-SECTIONAL GRAVITY MODEL OVER THE STUDY
PERIOD (1997-2005)---------------------------------------------------------67
FIGURE 4.3: EVOLUTION OF ESTIMATES FOR TIME INVARYING FACTORS
IN CROSS-SECTIONAL GRAVITY MODEL OVER THE STUDY
PERIOD (1997-2005)---------------------------------------------------------67
FIGURE 5.1: CONFIGURATION OF RTB AND FTA INTERACTION --------------90
FIGURE 5.2 : INSIDER-OUTSIDER FTA CONFIGURATION OF EU---------------95
FIGURE 5.3: FTA INTERACTIVE EFFECT OF EU -------------------------------------96
FIGURE 5.4: INSIDER-OUTSIDER FTA CONFIGURATION OF NAFTA ---------98
FIGURE 5.5: FTA INTERACTIVE EFFECT OF NAFTA -------------------------------99
FIGURE 5.6: INSIDER-OUTSIDER FTA CONFIGURATION OF ASEAN ------- 101
FIGURE 5.7: FTA INTERACTIVE EFFECT OF ASEAN ----------------------------- 103
FIGURE 5.8: INSIDER-OUTSIDER FTA CONFIGURATION OF EFTA---------- 104
FIGURE 5.9: FTA INTERACTIVE EFFECT OF EFTA ------------------------------- 105
FIGURE 5.10: INSIDER-OUTSIDER FTA CONFIGURATION OF DRCAFTA-- 106
xi
FIGURE 5.11: FTA INTERACTIVE EFFECT OF DCAFTA ------------------------- 107
FIGURE 6.1: ANNUAL GROWTH RATE OF REAL EXPORTS FOR 148
COUNTRY PAIRS TRADED UNDER FTA 1997-2005 ------------- 120
FIGURE 6.2: LONG RUN ELASTICITY OF FTA ------------------------------------- 138
FIGURE 6.3: SIMULATION OF EXPORT GROWTH FOR A COUNTRY
ENTERING INTO TEN YEAR PHASED-OUT FTA HAVING
INITIAL EXPORT VOLUME OF 100. --------------------------------- 140
xii
LIST OF ABBREVIATIONS
2SLS
Two Stage Least Squares
ANZCERA
Australia New Zealand Closer Economic Relations Agreement
APEC
Asia Pacific Economic Corporation
ASEAN
Association of Southeast Asian Nations
ATE
Average Treatment Effect
BTA
Bilateral Trading Agreement
c.i.f
Cost Insurance Freight
CACM
Central American Common Market
CAFTA
China-ASEAN Free Trade Area
CARICOM
Caribbean Community
CEEC
Central and Eastern European Countries
CIA
Central Intelligence Agency’s Fact Book
CG
Controlled Group
CM
Common Market
CMEA
Council of Mutual Assistance
CPI
Consumer Price Index
CU
Custom Union
DRCAFTA
Central America Free Trade Agreement with Dominican
Republic
DW
Durbin Watson
EC
European Community
xiii
EEA
European Economic Area
EEC
European Economic Community
EFTA
European Free Trade Association
EGLS
Estimated Generalized Least Squares
Eq
Equation
EU
European Union
f.o.b
Free On Board
FD
First Difference
FDI
Foreign Direct Investment
FE
Fixed Effect
FGLS
Feasible Generalized Least Squares
FTA
Free Trading Agreement
GATT
General Agreement on Trade & Tariff
GCD
Great Circle Distance
GDP
Gross Domestic Product
GLS
Generalized Least Squares
HO model
Heckscher–Ohlin model
IMF
International Monetary Fund
IV
Instrument Variable
LAFTA
Latin American Free Trade Association
LAIA
Latin American Integration Association
LHS
Left Hand Side (Variables)
Ln
Natural Log (base-e)
MFN
Most Favored Nation
MU
Monetary Union
xiv
N
Number of Observations
NAFTA
North American Free Trading Agreement
NTC
Net Trade Creation
OECD
Organization for Economic Co-operation and Development
OLS
Ordinary Least Squares
PPP
Purchasing Power Parity
PTA
Preferential Trade Agreement
PTA
Preferential Trading Agreement
RHS
Right Hand Side (Variables)
RE
Random Effect
ROW
Rest of the world
RTA
Regional Trading Agreement
RTB
Regional Trading Bloc
SAARC
South Asian Association for Regional Cooperation
SAFTA
South Asian Free Trade Area
SAPTA
South Asian Preferential Agreement
SUR
Seemingly Unrelated Regression
T
Number of Time periods
TC
Trade Creation
TC
Trade Creation
TD
Trade Diversion
TG
Treatment Group
UNCTAD
United Nations Conference on Trade and Development
USA
United State of America
VAR
Vector Auto Regression
xv
WLS
Weighted Least Squares
WTO
World Trade Organization
xvi
CHAPTER- I
INTRODUCTION
In this chapter we will have a brief overview of the landscape of the present World
Trading System, the nature of FTA proliferation and the motivation behind the study
followed by the objectives of the study, the research questions, and the methodology.
=============================================================
1.1
THREE FACES OF WORLD TRADE LIBERALIZATION:
MULTILATERALISM, REGIONALISM, AND BILATERALISM
The landscape of the present World Trading System (WTS) can be known as three
faced object having Multilateralism, Regionalism, and Bilateralism in each side.
Today every country in the world is a member of at least one regional, multilateral or
bilateral trading agreement.
Geographic proximity followed by similarity in economic cultural historical
characteristics has necessarily fostered enthusiasm towards formation of Regional
Trading Blocs (RTB). There have been widespread attempts at RTBs in 1960s but the
origin of RTA descends back to centuries as long as there have been nation-states that
discriminated trade policies in favor of some valued neighbors and against others.
“Regional trading arrangements have at times played major roles in political history.
For example, the German Zollverein, the custom union that was formed among 18
small states in 1834, was a step on the way to the creation of the nation of Germany
later in the century”. (Frankel, 1997)
1
During past few decades the World Trade Organization1 (WTO) has been working
mostly towards an arena of multilateralism where the concept of Most Favored Nation
(MFN) is of paramount importance. The Trade Expansion Act of 1962, which is
called Kennedy Round of trade negotiations, brought together 53 countries accounting
for 80% of international trade to cut tariffs by an average of 35%. In the Tokyo Round
(1979) approximately 100 nations agreed upon further tariff reductions and to the
reduction of non-tariff barriers such as quotas and licensing. Most remarkable
multilateral negotiations took place as a result of the Uruguay Round launched in
1986 and concluded almost 10 years later with conformity to reduce industrial tariffs,
agricultural tariffs and subsidies, and to protect intellectual property rights. However,
the most recent one, Doha round almost collapsed in 2006 after five year prolong
talks as both USA and EU kept themselves more on the defensive side. Nevertheless,
GATT/WTO has shown major deviations from the MFN allowing countries to form
Regional Trading Agreements (RTA), Custom Unions (CU) or Preferential Treading
Agreements (PTA)under Article-XXIV subject to a several conditions including that
trade barriers against non-members not be made more restrictive than before. All
these can be known as one or other form of multilateralism. Presently there are more
than 30 Multilateral RTAs notified to WTO (See the Descriptive Appendix Table
1(A) for the list of RTAs and member countries)
In recent past Free Trading Agreements (FTA) on bilateral basis have become the
pioneering driving force of trade linearization partly because narrower pacts are easier
to negotiate less time consuming and can closely address the needs of both parties.
Often they can lay the groundwork for larger accords. During the recent past,
1
Known as GATT-General Agreement on Trade and Tariffs prior to 1995
2
especially after 1995, the number of FTAs grew so rapidly that relevant literature uses
the terminology of “Proliferation of FTA” to signify the explosion in number of
FTAs. There are four recent trends in RTA/FTA proliferation (Roberto et al, 2007).
1. A shift from multilateral trade objectives to pursuance of preferential
agreements
2. An increasing level of sophistication in RTAs including linearization of trade
in services which was not regulated multilaterally
3. Geopolitics of RTAs shows an increase of North-South RTAs
4. Expansion and consolidation of regional integration schemes into Continentwide regional trading blocs
1.2
OBJECTIVES OF THE STUDY
In this study our major interest lies with selected Regional Trading Blocs (RTB) and
FTAs to ascertain their impact on world trade in general and on bilateral trade in
particular. Accordingly, the objectives of the study are as follows.
1. To differentiate Trade Creation (TC) and Trade Diversion (TD) Effects of
selected Regional Trading Blocs from their Gross Trade Creation (GTC)
Effect.
2. To identify whether a bilateral FTA between a member and a non-member
country of RTB improves welfare of the non-member or exploit the nonmember for the benefit of RTB itself.
3. To estimate Average Treatment Effect (ATE) of FTA on bilateral trade
3
1.3
MOTIVATION AND RESEARCH QUESTIONS
Regional Trading Agreements (RTA) has become the common term used to denote all
kinds of regional arrangements including FTAs, RTBs CUs, and PTAs without
differentiating among their unique identities. Not to confuse among the terminologies,
throughout this study, we use RTB to denote Regional Trading Blocs and RTA to
denote all above in common.
Quantifying the actual number of RTAs presently in the world is a methodological
challenge for many reasons. There are 194 RTAs notified to WTO as at September
24, 2007. This includes 114 FTAs, 18 Custom unions, 49 Economic Integration
Agreements, and 13 partial scope arrangements. However, this could not be the actual
number because there are many RTAs/FTAs under negotiation but so far not notified
to WTO. According to Roberto, Luis and Cristelle (Roberto et al, 2007) Total number
of RTAs active and in force by end 2006 were 214 and there are approximately 70
RTAs not notified, 30 just signed and yet to implement, 65 under negotiation and at
least another 30 proposed. If all these are implemented we will be having a global
RTA network of 400 RTAs by 2010.
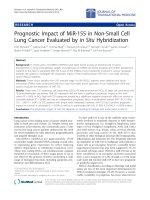
The Figure 1.1 shows the evolution of FTAs (related to goods) from 1960 to 2007 (It
does not include inactive FTAs or FTAs related to services and investment) It can be
seen that FTA proliferation is mostly evident during the period from 2000 to 2006.
4
FIGURE 1.1: EVALUATION OF NUMBER OF FTAs 1960-2007
Figure 1.1
Number of FTA
EVOLUTION OF NUMBER OF FTAs 1960-2007
Sorted by the date notified to GATT / WTO
30
120
25
100
20
80
15
60
10
40
5
20
0
19601993 1994 1995 1996 1997 1998 1999 2000 2001 2002 2003 2004 2005 2006 2007
1993
CUM FTA
10
15
18
23
28
34
41
45
53
64
74
83
98
109
116
118
CUM Included
7
11
13
16
19
24
27
30
35
45
55
63
69
79
79
79
FTA Included
7
4
2
3
3
5
3
3
5
10
10
8
6
10
0
0
FTA Excluded
3
1
1
2
2
1
4
1
3
1
0
1
9
1
7
2
0
Source: Author’s calculation using WTO statistics. “FTA included” are the FTAs considered in this study. “FTA excluded”
arises for two reasons. Either (a) Study period may not cover the time of their occurrence or (b) dataset does not include at least
one country related to the omitted FTA.
According to the Figure 1.1 the total number of FTAs considered in this study is 78.
Indeed, this number should be read as 705 in terms of number of bilateral FTAs as
shown in Figure 1.2 below.
5
FIGURE 1.2: FTA PROLIFERATION IN TERMS OF BTAs 1997-2005
Figure 1.2
Number of FTA
FTA PROLIFERATION IN TERMS OF BTAs 1997-2005
[ 79 FTAs included in the study sorted by the date notified to GATT/WTO ]
800
700
600
500
400
300
200
100
0
1960-97
1998
1999
2000
2001
2002
2003
2004
CUM FTA Included
24
27
30
35
45
55
63
69
2005
79
CUM BTA Included
148
166
172
250
293
357
431
668
705
Source: Author’s calculations using data from WTO
It is interesting to see what was happening in the global trade behind the FTA
proliferation. The Figure 1.3 shows the value of total world exports and the value of
export covered by FTAs during the proliferation period. Interestingly the Figure
exhibits by year 2005 approximately 18% of world total merchandise exports
occurred under 705 bilateral FTAs. This is a remarkable percentage when we recall
that there more than 25,000 country pairs2 in the world presently trading among each
other. This is similar to claiming that 18% of world trade takes place among of 3% of
the total number of trading pairs, who are tied up each other by an FTA. The other
side of the story is that 97% of the total number of trading pairs who are not
connected to each other by FTAs shares only 82% of world trade. This implies the
number of FTAs is not overwhelming but trade under them is remarkably outstanding.
2
Given 198 countries in the world, potential number of trading pairs is (1982-198)/2=19,503 and
therefore potential Export Flows are 19,503*2=39,006. But actual number is around 25,000 as not all
countries trade with all the other countries in the world.
6
FIGURE 1.3: EVALUATION OF WORLD EXPORT UNDER FTA 1999-2005
Figure 1.3
EVOLUTION OF WORLD EXPORTS UNDER FTA 1999-2005
US Dollar Million
10,000,000
30.0%
9,000,000
25.0%
8,000,000
7,000,000
20.0%
6,000,000
5,000,000
15.0%
4,000,000
10.0%
3,000,000
2,000,000
5.0%
1,000,000
FTA Exports as % World Exports
1999
2000
2001
2002
2003
2004
2005
14.1%
14.3%
14.6%
14.2%
15.5%
17.5%
17.9%
Exports Under FTA (US$ Mio)
577,439
687,036
663,321
670,506
842,685
1,168,9
1,389,6
Total World Exports (US$ Mio)
4,100,0
4,807,0
4,536,0
4,722,0
5,453,0
6,680,0
7,758,0
0.0%
Source: Author’s calculations using data from WTO
Most distinct feature of RTA evolution is that over 80% of the RTA currently in force
and more than 92% of the proposed RTAs falls under FTAs. Furthermore we
observed that during the FTA proliferation period around 18% of world total
merchandise exports took place under FTAs. Then it is interesting to question whether
we can attribute all the credit to FTAs as an overwhelming phenomenon governing
world trade? Of course not! The Trade Gravity model suggests there are many other
factors driving trade and therefore FTA may be only one factor among them.
This provides the motivation for our first research question that how much of bilateral
trade has been really boosted by FTA on average. In short what is the average
treatment effect of FTA? This is the central issue we broadly discuss in chapter VI.
Turning towards the RTB’s performance during the proliferation period, statistics
suggest that the proportion of intra-trade (trade among members) and extra-trade
7
(trade between members and non-members) of RTBs, except for few, has continued
be same as before without a noticeable change. For example, we show trading
performance of EU, ASEAN and NAFTA below.
As shown by Figure 1.4 for all years, EU has shown higher trade integration among
member countries3 accounting 68% of total exports from EU intra-exports and 67% of
total imports from EU intra-imports. It is equivalent to saying that only 30% of EU
trade is shared with the rest of the world (ROW) while 70% of trade occurs within the
bloc. This composition does not seem to have changed during the 7 year period
concerned. This follows the idea that EU still treats the non-member countries exactly
as the way they used to treat them seven years ago.
FIGURE 1.4: EUROPEAN UNION (EU) INTRA AND EXTRA TRADE AS A PERCENTAGE OF EU TOTAL TRADE 1999-2005
Figure 1.4
EUROPEAN UNION (EU) INTRA AND EXTRA TRADE AS A PERCENTAGE OF EU TOTAL TRADE
1999-2005
2005
2003
2004
2002
2001
1999
2000
2005
2003
2004
2002
2001
1999
70.00%
2000
80.00%
60.00%
2005
2004
2002
2003
2000
2001
1999
2005
2004
2003
2001
2002
1999
40.00%
2000
50.00%
30.00%
20.00%
10.00%
0.00%
EU Intra-Exports as % of Total EU Exports
EU Extra-Exports as % of Total EU
Exports
EU Intra-Imports as % of Total EU Imports EU Extra-Imports as % of Total EU Imports
Source: Author’s calculations using data from WTO
3
The member states are Austria, Belgium, Bulgaria, Cyprus, Czech Republic, Denmark, Estonia,
Finland, France, Germany, Greece, Hungary, Ireland, Italy, Latvia, Lithuania, Luxembourg, Malta,
Netherlands, Poland, Portugal, Romania, Slovakia, Slovenia, Spain, Sweden, and United Kingdom of
Great Britain and Northern Ireland
8
By contrast, ASEAN shows relatively poor trade integration among members4
accounting only for 22% of inter-bloc trade while more than 76% of total trade is
dealt with ROW as shown in Figure 1.5. This is apparently the opposite of the EU
trading composition.
Knowing that ASEAN does trade more with outside countries, does it mean having an
FTA with an ASEAN country is more advantages for a third party country rather than
being connected to EU through an FTA? Not necessarily. Sometimes, it may be the
case that 76% from ASEAN could be even smaller than 22% from EU. The answer
needs a proper estimate comparable referring to a single bench mark. We will do this
later referring to the natural level of trade predicted by trade Gravity model.
Nevertheless, both EU and ASEAN share one common feature as long as their intra
and extra trade composition has continued to be stable for the seven years observed.
FIGURE 1.5: ASEAN INTRA AND EXTRA TRADE AS A PERCENTAGE OF ASEAN TOTAL TRADE 1999-2005
Figure 1.5
ASEAN INTRA AND EXTRA TRADE AS A PERCENTAGE OF ASEAN TOTAL TRADE
1999-2005
2004
2005
2003
2001
2002
1999
2000
2004
2005
2002
2003
2001
1999
80.00%
2000
90.00%
70.00%
60.00%
50.00%
2005
2003
2004
2002
2000
2001
1999
2005
2004
2003
2002
2000
2001
30.00%
1999
40.00%
20.00%
10.00%
0.00%
ASEAN Intra-Exports as % of Total
ASEAN Exports
ASEAN Extra-Exports as % of Total
ASEAN Exports
ASEAN Intra-Imports as % of Total ASEAN
Imports
ASEAN Extra-Imports as % of Total
ASEAN Imports
Source: Author’s calculations using data from WTO
4
ASEAN was established by the five original member countries, namely, Indonesia, Malaysia,
Philippines, Singapore, and Thailand in August 1967 in Bangkok. Brunei Darussalam joined in
January 1984, Vietnam in July 1995, Lao PDR and Myanmar in July 1997, and Cambodia in April
1999.
9