NBS1 deficiency promotes genome instability by affecting DNA damage signaling pathway and impairing telomere integrity
Bạn đang xem bản rút gọn của tài liệu. Xem và tải ngay bản đầy đủ của tài liệu tại đây (3.65 MB, 150 trang )
NBS1 DEFICIENCY PROMOTES GENOME INSTABILITY BY
AFFECTING DNA DAMAGE SIGNALING PATHWAY AND
IMPAIRING TELOMERE INTEGRITY
HOU YANYAN
NATIONAL UNIVERSITY OF SINGAPORE
2012
NBS1 DEFICIENCY PROMOTES GENOME INSTABILITY BY
AFFECTING DNA DAMAGE SIGNALING PATHWAY AND
IMPAIRING TELOMERE INTEGRITY
HOU YANYAN
(Bachelor of Science, HUST)
A THESIS SUBMITTED
FOR THE DEGREE OF MASTER OF SCIENCE
DEPARTMENT OF BIOCHEMISTRY
NATIONAL UNIVERSITY OF SINGAPORE
2012
ACKNOWLEDGEMENTS
I would like to express my heartfelt gratitude to my supervisor, Dr. Sherry Wang Xueying,
from Department of Biochemistry, National University of Singapore. I was accepted as
the first graduate student in Dr. Wang’s lab two and a half years ago, which I feel
extremely lucky and fortunate. Dr. Wang’s enthusiasm to research and science infects me
and motivates me all the time. Her encouragement, patience and advices are the source
for me to overcome difficulties, get through the “dark times” and grow up as both a
researcher and an individual. This thesis would not have been possible without her help
in every aspect.
And a special thanks to my group member, Mr Toh Meng Tiak, for his help in many
experiments.
I would also like to thank all of my lab members: Dr. Zhang Yong, Mr. Chai Juin Hsien,
Miss Tay Ling Lee, Miss Dashayini Mahalingam, Miss Kong Chiou Mee and Miss Toh
Ling Ling for their support, encouragement and invaluable insights throughout the course
of this project.
Lastly and most importantly, I would like to thank my family members for their
continuous moral support and encouragement which gives me strength to plod during my
graduate study.
I
TABLE OF CONTENTS
ACKNOWLEDGEMENTS .............................................................................................. I
SUMMARY ..................................................................................................................... VI
LIST OF TABLES ....................................................................................................... VIII
LIST OF FIGURES ........................................................................................................ IX
LIST OF ABBREVIATIONS ...................................................................................... XII
1. INTRODUCTION...................................................................................................... 1
1.1
NBS and NBS1 protein..................................................................................... 1
1.2
MRN complex .................................................................................................. 4
1.3
ATM and ATR kinases ...................................................................................... 7
1.4
DNA damage response ................................................................................... 10
1.5
1.4.1
DNA damage sensing .......................................................................... 10
1.4.2
DNA damage mediating - ATM and ATR activation ........................... 11
1.4.3
DNA damage effect - cell cycle checkpoint control ............................ 13
1.4.4
DNA damage effect - apoptosis ........................................................... 17
1.4.5
DNA damage response as anti-cancer barrier...................................... 18
The biology of telomeres ................................................................................ 22
1.5.1
Telomere and telomerase ..................................................................... 22
1.5.2
Telomere and shelterin complex .......................................................... 24
1.5.3
Other telomere associated proteins ...................................................... 28
1.5.4
Telomerase and shelterin in cancer and aging ..................................... 31
II
1.6
2.
Project rationale and aims............................................................................... 35
MATERIALS AND METHODS ............................................................................ 37
2.1
Cells ................................................................................................................ 37
2.2
Cell culture ..................................................................................................... 39
2.3
2.2.1
Cell culture conditions ......................................................................... 39
2.2.2
Cell harvesting ..................................................................................... 39
2.2.3
Cell storage .......................................................................................... 40
Western Blotting ............................................................................................. 41
2.3.1
Protein extraction and separation ........................................................ 41
2.3.2
Antibodies............................................................................................ 41
2.4
5-Bromo-2’-deoxy-uridine (BrdU) Labeling & Detection (Roche) ............... 44
2.5
FITC Annexin V Apoptosis Detection (BD Pharmingen) .............................. 45
2.6
TeloTAGGG Teloere Length Assay (Roche) .................................................. 46
2.7
β-galactosidase Staining (US Biological) ....................................................... 49
2.8
Growth curve study ........................................................................................ 50
2.9
Telomerase activity assay (XpressBio)........................................................... 51
2.10 RT-PCR ........................................................................................................... 52
2.11 Cytogenetic analysis of metaphase spreads .................................................... 54
2.12 Transfection, virus production and cell infection ........................................... 55
2.12.1 Transformation and amplification of plasmids .................................... 56
2.12.2 Lentivirus production .......................................................................... 57
2.12.3 Retroviral production........................................................................... 57
2.12.4 Cell infection ....................................................................................... 57
III
2.13 Soft agar assay/Anchorage-independent growth assay .................................. 59
3.
RESULTS ................................................................................................................. 60
3.1
NBS1 deficiency does not affect the expression of MRE11 and RAD50 ...... 60
3.2
NBS1 deficiency affects ATM phosphorylation ............................................. 61
3.3
NBS1 deficiency affects the phosphorylation of ATM downstream targets... 63
3.4
NBS1 deficiency also affects ATR phosphorylation and the phosphorylation
of ATR downstream target Chk1............................................................................... 65
3.5
NBS1 deficiency delays inhibition of DNA synthesis after DNA damage
occur………………………………………………………………………………...67
3.6
NBS1 deficiency affects the initiation of apoptosis ....................................... 69
3.7
NBS1 deficiency promotes telomere shortening and an earlier onset of
senescence in fibroblasts ........................................................................................... 71
3.8
NBS1 deficiency leads to an earlier onset of cell death in B-lymphocytes .... 73
3.9
Accelerated telomere shortening is not observed in NBS B-lymphocytes ..... 75
3.10 NBS1 deficiency does not affect telomerase activity ..................................... 77
3.11 NBS1 deficiency leads to upregulation of TRF2 in fibroblasts...................... 78
3.12 TRF2 level is not affected in NBS B-lymphocytes ........................................ 79
3.13 NBS1 deficiency potentiates chromosome instabilities in NBS fibroblasts... 80
3.14 NBS1 deficiency does not promote malignant transformation of fibroblasts in
vitro…………………………………………………………………………………82
4. DISCUSSION ........................................................................................................... 84
4.1
NBS1 deficiency affects the DNA damage response ..................................... 84
4.2
NBS1 deficiency compromises telomere integrity ......................................... 92
IV
4.3
NBS1 deficiency promotes genome instabilities and is implicated in
carcinogenesis of lymphoid cells ............................................................................ 100
5.
CONCLUSIONS .................................................................................................... 103
6.
FUTURE WORK ................................................................................................... 104
6.1
Reintroduction of wild-type NBS1 into NBS fibroblasts and examination of
the DNA damage response and telomere shortening rate in these cells ................. 104
6.2
To study the underlying mechanism of NBS1 deficiency-induced TRF2
upregulation and accelerated telomere shortening in NBS fibroblasts ................... 105
6.3
To study the role of the 70 KD C-terminus of NBS1 at telomeric ends in NBS
B-lymphocytes ........................................................................................................ 107
6.4
To examine the telomere integrity and malignant transformation of NBS B-
lymphocytes ............................................................................................................ 108
7. REFERENCES....................................................................................................... 109
8.
APPENDICES ........................................................................................................ 123
V
SUMMARY
Nijmegen Breakage Syndrome (NBS), a rare autosomal recessive disorder typically
caused by mutations in NBS1 gene, is characterized by immunodeficiency and a strong
predisposition to cancer. Studies revealed that NBS1 plays an important role in
maintaining genome stability, but the underlying mechanism is controversial and elusive.
Our study used NBS cells derived from NBS patients with 657del5 mutation in NBS1
gene as well as normal cells with wild type NBS1 gene to examine the roles of NBS1 in
maintaining genome stability. Our results showed that NBS1 was involved in ataxiatelangiectasia mutated (ATM)- and ataxia-telangiectasia and Rad3-related (ATR)dependent DNA damage signaling pathways. NBS1 deficiency led to a decrease in the
phosphorylation level of ATM and ATR as well as their downstream targets, including
histone H2AX, p53, Chk1 and Chk2. The inefficiency in activating DNA damage
signaling pathway led to multiple defects in cellular responses towards DNA damage.
BrdU proliferation assay revealed a delay of NBS cells in inhibiting DNA synthesis after
Doxorubicin (Dox) treatment. In addition, under high concentration of 1μM Dox, NBS
cells exhibited 15% ~ 25% lower level of apoptosis compared to their normal
counterparts, indicating a resistance to Dox treatment.
Accelerated telomere shortening was also observed in NBS fibroblasts, consistent with an
earlier onset of cellular replicative senescence in vitro. This abnormality may be due to
the shelterin protein telomeric binding factor 2 (TRF2) which was found to be
upregulated in NBS fibroblasts. However, both accelerated telomere shortening and
upregulation of TRF2 were not observed in NBS B-lymphocytes, although these cells
VI
showed earlier occurrence of senescence-associated apoptosis. These results suggest that
NBS1 deficiency exerts different regulatory effects on fibroblasts and B-lymphocytes
even with the same type of gene mutation. Dysregulation of telomere shortening rate and
TRF2 expression level in NBS fibroblasts led to frequent telomere end-to-end fusions and
cellular aneuploidy.
Collectively, our results suggest a possible mechanism that NBS1 deficiency
simultaneously affects ATM- and ATR-dependent DNA damage signaling and TRF2regulated telomere maintenance, which synergistically leads to genomic abnormalities.
VII
LIST OF TABLES
INTRODUCTION
Table 1 Comparison of clinical signs with NBS, ATLD, A-T and ATR-Seckle
syndrome…………………………………………………………………………………9
Table 2 List of non-shelterin proteins associated with telomeres………………….……29
MATERIALS AND METHODS
Table 3 List of fibroblasts and B-lymphocytes used in this study……………...…....…..37
Table 4 List of cancer cells used in this study…………………………………………...38
Table 5 List of antibodies used in this study…………………………………………….41
VIII
LIST OF FIGURES
INTRODUCTION
Figure 1.1 The structure of NBS1…………………………………..…………………….2
Figure 1.2 Structural model of the MRN complex……………………………………….5
Figure 1.3 Major pathways of ATM/ATR-mediated cell cycle arrest, including G1 arrest,
intra-S arrest and G2 arrest……………………………………………………………....14
MATERIAL AND METHODS
Figure 2.1 Plasmid constructs used for virus production…………………………..……55
RESULTS
Figure 3.1 NBS1 deficiency does not affect the expression of MRE11 and RAD50…..60
Figure 3.2 NBS1 deficiency affects ATM phosphorylation…………………………..…61
Figure 3.3 NBS1 deficiency affects the phosphorylation of ATM downstream targets…64
Figure 3.4 NBS1 deficiency affects the phosphorylation of ATR as well as its
downstream target Chk1…………………………………………………………………65
Figure 3.5 NBS1 deficiency delays inhibition of DNA synthesis after DNA damage
occurs……………………………………………………………………………….…....67
Figure 3.6 NBS1 deficiency affects the initiation of apoptosis…………………………69
Figure 3.7 NBS1 deficiency leads to accelerated telomere shortening and an earlier onset
of senescence in NBS fibroblasts…………………………………………………….…..71
Figure 3.8 NBS1 deficiency leads to an earlier onset of cell death in Blymphocytes……………………………………………………………………….……..74
IX
Figure 3.9 NBS1 deficiency does not lead to accelerated telomere shortening in Blymphocytes………………………………………………………………………...……75
Figure 3.10 Real-time PCR for relative telomerase activity in NBS versus normal
fibroblasts……………………………………………………………………………...…77
Figure 3.11 NBS1 deficiency leads to upregulation of TRF2…………………...………78
Figure 3.12 NBS1 deficiency does not affect the expression level of TRF2 in Blymphocytes………………………………………………………………………….…..79
Figure 3.13 NBS1 deficiency leads to chromosome instabilities…………….…………80
Figure 3.14 NBS1 does not promote malignant transformation of fibroblasts in vitro…82
DISCUSSION
Figure 4.1 Model of NBS1’s role in regulating ATM/ATR-mediated DNA damage
signaling pathways……………………………………………………………………….91
Figure 4.2 Model for NBS1- and ATM-mediated phosphorylation of TRF2 in modulating
telomerase-dependent telomere elongation………………………………………………95
Figure 4.3 Model for p53-dependent ubiquitylation of TRF2 in modulating telomerase-
dependent telomere elongation……………………………………………………….….97
Figure 4.4 Model for NBS1 deficiency-initiated malignant transformation of lymphoid
cells……………………………………………………………..………………....………101
APPENDICES
Figure S1 NBS1 knockdown in human breast cancer cells MCF7………………….…122
Figure S2 NBS1 deficiency affects the expression level of TOPBP1……………….…122
X
Figure S3 NBS1 deficiency also affects the DNA damage signaling pathway in Blymphocytes…………………………………………………………………………….123
XI
LIST OF ABBREVIATIONS
NBS: Nijmegen breakage syndrome
ATM: ataxia-telangiectasia Mutated
ATR: ataxia-telangiectasia and Rad3-related
ATLD: ataxia-telangiectasia-like disorder
DSB: double strand break
SSB: single strand break
FHA: forkhead-associated domain
BRCT: BRCA1 C-terminus domain
PI3K: phosphatidylinositol 3-kinase
PIKK: PI3K-like protein kinases
IR: ionizing radiation
MDC1: mediator of DNA damage checkpoint protein
53BP1: p53 binding protein 1
HU: hydroxyurea
Dox: doxorubicin
Ser: serine
Thr: threonine
NER: nucleotide excision repair
BER: base excision repair
RPA: replication protein A
PUMA: p53 upregulated modulator of apoptosis
BAX: BCL2-associated X protein
XII
BrdU: 5-Bromo-2’-deoxy-uridine
PI: propidium iodide
PARP: poly-ADP-ribose-polymerase
PDLs: population doubling levels
TERT: telomerase reverse transcriptase
TER: telomerase RNA template
snoRNA: small nucleolar RNA
hnRNP: heterogeneous nuclear ribonucleoprotein
TRF1: telomeric repeat-binding factor 1
TRF2: telomeric repeat-binding factor 2
POT1: protection of telomeres 1
RAP1: the human ortholog of the yeast repressor/activator protein 1
TIN2: the TRF1- and TRF2-interacting nuclear protein 2
TPP1: the POT1-TIN2 organizing protein
XRS2: the ortholog of NBS1 in yeast
WRN: gene mutated in Werner syndrome
BLM: gene mutated in Bloom syndrome
PINX1: PIN1-interacting protein 1
TIFs: telomere dysfunction induced foci
HR: homologous recombination
NHEJ: non-homologous end joining
ALT: alternative lengthening of telomeres
E1A: the adenovirus early 1A region
XIII
RDS: radio-resistant DNA synthesis
DMEM: Dulbecco’s modified eagle medium
MEM: minimum essential medium
FBS: fetal bovine serum
CCR: Coriell Cell Repositories
RPMI-1640: Roswell Park Memorial Institute-1640
NEAA: non-essential amino acid
HRP: horseradish peroxidase
LB: lysogeny broth
XIV
1. INTRODUCTION
1.1 NBS and NBS1 protein
NBS is a rare autosomal recessive disorder which was first delineated in 1981 by C.
Weemaes and colleagues. NBS is characterized by immunodeficiency, microcephaly,
growth retardation, congenital malformations and a strong predisposition to malignancies,
especially to B-cell lymphoma (The International Nijmegen Breakage Syndrome Study
Group 2000). The main causes of death in NBS patients are lymphoid malignancy and
infectious complications of immunodeficiency (Resnick, Kondratenko et al. 2002). A
study of 55 NBS patients showed that 40% of them developed cancer before 21 years old
(The International Nijmegen Breakage Syndrome Study Group 2000).
The underlying gene mutated in NBS, NBS1, was cloned in 1998 with chromosomal
location 8q21 (Varon, Vissinga et al. 1998). NBS1 gene is 50 kb in size and consists of 16
exons. NBS1 is expressed ubiquitously and the expression level is higher in the testis
(Kobayashi, Antoccia et al. 2004). Mutation screening of NBS1 gene has identified six
distinct mutations in NBS patients, including 657del5, 698del4, 835del4, 842insT,
1142delC and 976C>T (Varon, Vissinga et al. 1998). Among all these patients, 90% of
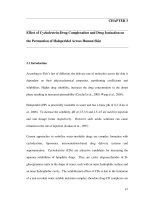
them are homozygous for the 657del5 mutation. 657del5 mutation causes two truncated
proteins because of premature termination at codon 219, a N-terminal and a C-terminal
species with relative molecular weight of 26 KD and 70 KD respectively (Figure 1.1B)
(Maser, Zinkel et al. 2001). The mutation of NBS1 gene leads to pleiotropic phenotypes
of NBS cells in vitro, such as hyper-sensitivity to ionizing radiation (IR), impaired cell
1
cycle checkpoints, decreased homologous recombination, accelerated telomere
shortening and frequent chromosomal aberrations (Tauchi, Matsuura et al. 2002).
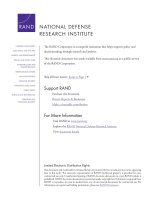
Figure 1.1 The structure of NBS1 (modified from (Tauchi, Matsuura et al. 2002)). A.
Schematic diagram representing the wild type NBS1 structure. B. Schematic diagram
representing the truncated NBS1 N-terminus and C-terminus structure caused by internal
translation initiation due to 657del5 mutation.
The normal NBS1 gene encodes a 754 amino acid protein that contains three functional
regions (Figure 1.1A): the N-terminal DNA damage recognition region, the signal
transduction region and the C-terminal MRE11 binding region (Kobayashi, Antoccia et al.
2004). The N-terminal DNA damage recognition region contains a forkhead-associated
(FHA) domain and a BRCA1 C-terminus (BRCT) domain which are widely conserved in
eukaryotes. FHA and BRCT domains involve in regulation of cell cycle checkpoints and
DNA damage repair. The FHA domain is generally thought to mediate protein-protein
2
interactions (Durocher, Henckel et al. 1999). It is reported that the FHA/BRCT domain is
essential for binding to the phosphorylated histone H2AX, following which the MRE11
and RAD50 are recruited to the vicinity of DNA damage foci (Kobayashi, Tauchi et al.
2002). The central region includes several SQ motifs that could be phosphorylated by
ATM or ATR kinase in response to DNA damage, especially at serine (Ser) 278 and
Ser343. Following phosphorylation, NBS1 undergoes a conformational change that
makes NBS1 as an adaptor in DNA damage signaling pathway. Adaptor NBS1 positions
NBS1-binding proteins in a manner such that could be phosphorylated by ATM/ATR
(Yazhi, Zhao et al. 2006). Phosphorylation of NBS1 is essential to execute its
downstream cellular functions, such as cell cycle checkpoint control and DNA damage
repair (Iijima, Komatsu et al. 2004; Kobayashi, Antoccia et al. 2004; Zhang, Zhou et al.
2006). Mutation at the phosphorylation sites partially abrogates its cellular functions in
DNA damage responses (Lim, Kim et al, 2000). The C-terminus of NBS1 contains the
region that binds to MRE11. The binding of NBS1 to MRE11 is necessary for the
recruitment of MRE11 and RAD50 from cytoplasm to nucleus, thus forming the MRN
complex, a central player in many aspects of the cellular response towards DNA double
strand breaks (DSBs) (Assenmacher and Hopfner 2004). In addition to MRE11, the Cterminus of NBS1 is able to attract other factors to DNA damage foci to amplify and
propagate the original signal to multiple DNA damage response pathways (Bradbury and
Jackson 2003).
3
1.2 MRN complex
MRN complex consists of three subunits, MRE11, RAD50 and NBS1. This complex is a
main player in cellular response to DSBs in many aspects, including DSB detection and
processing,
DSB-activated
cell
cycle
checkpoint
and
telomere
maintenance
(Assenmacher and Hopfner 2004). This broad range of cellular functions of MRN
complex is explained by the multiple enzymatic and non-enzymatic activities of its
components.
The MRE11 component is a nuclease with ssDNA endonuclease, 3’ to 5’ ssDNA
exonuclease, dsDNA exonuclease and hairpin opening activities in vitro (Rupnik,
Lowndes et al. 2010). These nuclease activities are dependent on the presence of NBS1
(Paull and Gellert 1999). RAD50 is a member of the Structural Maintenance of
Chromosome family proteins with ATPase activity. The central region of RAD50
contains a large coiled-coil structure that allows itself fold back via a “hinge” region
(Rupnik, Lowndes et al. 2010). The third component of MRN complex, NBS1, plays
important roles in regulating complex functions. Firstly, NBS1 is required for the
localization of MRE11 and RAD50 to nucleus. Secondly, NBS1 stimulates the activities
of MRE11 and RAD50. Thirdly, NBS1 is also essential for the assembly of MRN
complex at sites of DNA damage in nucleus (Carney, Maser et al. 1998; Horejsi, Falck et
al. 2004; Rupnik, Lowndes et al. 2010).
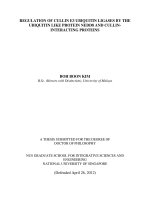
Electron microscopy and scanning force microscopy revealed a striking architecture of
MRN complex. The MRN complex exhibits as a bipolar structure with a head and two
tails (Figure 1.2). The head is composed of two RAD50 ATPase domains along with a
4
MRE11 dimer. Although not directly imaged, NBS1 is suggested as part of the head and
binds to MRE11 molecules by biophysical data (Assenmacher and Hopfner 2004). The
tails presents as anti-parallel coiled-coil structure which can form interlocked hook
bridges that might be important for MRN complex functions (Assenmacher and Hopfner
2004).
Figure 1.2 Structural model of the MRN complex (modified from (Assenmacher and
Hopfner 2004)). MRE11 binds to RAD50, adjacent to the RAD50 ATPase domains. NBS1 is
suggested binding to MRE11.
MRN complex is required to maintain genome stability. Null mutation of any component
of MRN complex is lethal in higher eukaryotes (Luo, Yao et al. 1999; Yamaguchi-Iwai,
Sonoda et al. 1999; Zhu, Petersen et al. 2001). Hypomorphic mutations in NBS1 and
5
MRE11 cause human genetic diseases, NBS and ataxia-telangiectasia like disease
(ATLD), respectively (Matsuura, Tauchi et al. 1998; Stewart, Maser et al. 1999).
Hypomorphic RAD50 mutant mice (RAD50 (S/S) mice) show growth defects and cancer
predisposition, and die with complete bone marrow depletion as a consequence of
hematopoietic stem cell failure (Bender, Sikes et al. 2002). Thus, disturbance of MRN
complex activity has profound effects on genome stability, indicating the importance of
this complex in maintaining the integrity of genome.
6
1.3 ATM and ATR kinases
ATM and ATR belong to a superfamily of protein kinases which contain a domain at their
carboxyl termini with motifs that is characteristic of the lipid kinase phosphatidylinositol
3-kinase (PI3K), thus they are named ‘PI3K-like protein kinases’ (PIKKs). The
mammalian members of PIKK family respond to various cellular stresses by
phosphorylating other proteins in the corresponding pathways, therefore affecting
numerous cellular processes depending on the spectrum of their targets (Shiloh 2003).
ATM and ATR are at the central of DNA damage signaling pathways. About 25 substrates
of ATM and ATR have been identified, and many of them have been revealed as
candidates in DNA damage signaling pathway that play a role in cell cycle checkpoint,
DNA damage repair or apoptosis (Matsuoka, Ballif et al. 2007).
The importance of ATM and ATR in DNA damage signaling pathway has been
manifested in human genetic disorder ataxia-telangiectasia (A-T) and ATR-Seckle
syndrome, which are caused by the mutation of ATM and ATR gene, respectively (Stiff,
Reis et al. 2005). However, ATM and ATR have different functional roles as manifested
by the pathological symptoms of A-T and ATR-Seckle syndrome (Table 1). The
functional differences between ATM and ATR are also reflected in the genetically
modified mice. ATM knockout mice are viable though infertile and growth-retarded (Xu,
Ashley et al. 1996). In contrast, ATR knockout mice show early embryonic death in
development subsequent to the blastocyst stage. ATR-null blastocyst cells only continue
growth for 2 days before dying of caspase-dependent apoptosis (Brown and Baltimore
2000). These results indicate that ATR plays a vital role for normal cell growth, while
7
ATM is not essential for cell viability.
Although in the same family, ATM and ATR respond to different types of DNA damage
stimuli. Due to this fact, it is generally thought that ATM and ATR orchestrate DNA
damage response separately in response to specific types of DNA damage. While ATM
mainly responds to DSBs, ATR primarily reacts to single strand breaks (SSBs) and stalled
replication forks (Shiloh 2001; Matsuoka, Ballif et al. 2007). However, recent studies
suggest that ATM- and ATR-mediated signaling pathways are highly interconnected.
ATM and ATR communicate with each other to coordinate and modulate the cellular
outputs in respond to DNA strand breaks and stalled replication forks (Hurley and Bunz
2007).
Many studies have revealed that NBS1 is involved in both ATM- and ATR-mediated
DNA damage signaling pathways (Lim, Kim et al. 2000; Stiff, Reis et al. 2005). It is
worth to note that the characteristics of NBS disease almost encompass those of A-T and
ATR-Seckle (Table 1). Notably, A-T disease shares the clinical characteristics, such as
hypersensitivity to IR, immunodeficiency and cancer predisposition, with NBS (Tauchi,
Matsuura et al. 2002). Moreover, the cellular features of A-T cells also partly overlap
with those of NBS cells, like chromosome instabilities, abnormal cell cycle checkpoints
and accelerated telomere shortening (Kobayashi, Antoccia et al. 2004). Besides A-T
disease, ATR-Seckle syndrome also shares several clinical symptoms with NBS, namely
microcephaly and characteristic facial appearance (Stiff, Reis et al. 2005). The
similarities between A-T/ATR-Seckle syndrome and NBS further imply that NBS1 and
ATM/ATR work in the same or similar signaling pathway.
8
Table 1. Comparison of clinical signs with NBS, A-T, ATLD and ATR-Seckle syndrome
Clinical symptom
NBS
ATLD
A-T
ATR-Seckle
syndrome
Ataxia
-
+
+
-
Growth retardation
+
NK
-
-
Characteristic facial appearance
+
-
-
+
Microcephaly
+
-
-
+
Hypersensitivity to IR
+
+
+
-
Immunodeficiency
+
-
+
-
Ovarian failure
+
NK
+
-
Mental retardation
-
-
-
+
Neuronal degeneration
-
NK
+
-
Telangiectasia
-
-
+
-
Cancer predisposition
+
NK
+
-
Cryptorchidism
-
-
-
+
Low birth weight
-
NK
-
+
‘+’ means clinical positive; ‘-’ means clinical negative, ‘NK’ means not known.
9