Understanding the functional roles of intrinsic protein disorder in NFkB transcription factors
Bạn đang xem bản rút gọn của tài liệu. Xem và tải ngay bản đầy đủ của tài liệu tại đây (6.22 MB, 102 trang )
UNDERSTANDING THE
FUNCTIONAL ROLES OF
INTRINSIC PROTEIN DISORDER IN
NFΚB TRANSCRIPTION FACTORS
LIM SHEN JEAN
B.Sc.(Hons.), NUS
A THESIS SUBMITTED
FOR THE DEGREE OF MASTER OF
SCIENCE
DEPARTMENT OF BIOCHEMISTRY
NATIONAL UNIVERSITY OF
SINGAPORE
2011
i
UNDERSTANDING THE FUNCTIONAL ROLES OF
INTRINSIC PROTEIN DISORDER IN NFΚB
TRANSCRIPTION FACTORS
LIM SHEN JEAN
NATIONAL UNIVERSITY OF SINGAPORE
2011
ii
Acknowledgements
I am grateful to my supervisor, Associate Professor Tan Tin Wee, for his guidance on
my research project. Next, I would like to thank Assistant Adjunct Professor Victor
Tong and Dr. Asif Khan (John Hopkins University) for their valuable ideas and
advice for my project. I am also very grateful for the IT assistance provided by Mark
de Silva and Lim Kuan Siong from the Life Sciences Institute. Finally, I would like to
express my appreciation to all my colleagues, as well as the administrative staff in the
Department of Biochemistry, National University of Singapore, for their strong
support during the course of my project.
iii
Summary
Protein dynamics, particularly, intrinsic protein disorder has been implicated in
cellular functions. Intrinsic protein disorder contributes to transcription and cell
signalling through the accommodation of multiple interaction partners and
modification sites, and provision of regulation flexibility. Here, in support with
previous studies, I hypothesize that analogous with sequence conservation of
functionally important sites, intrinsic protein disorder properties are evolutionary
conserved.
To further support and test this hypothesis, in the more specific context of
transcriptional regulation in cell signaling, I developed an in silico analysis pipeline
for the identification of intrinsically disordered protein residues, data mining and indepth analysis of the conservation, localization and function of predicted disordered
regions. The Nuclear Factor Kappa-light-chain-enhancer of Activated B cells
(NFκB/Rel), important for a variety of processes including cell survival, inflammation
and immunity, was chosen as the exemplar protein for this study.
The findings highlight distinctive key roles of conserved disordered and nondisordered in different aspects of NFκB function. Differences in the distribution and
conservation patterns of protein disorder in each NFκB protein type raise the
possibility of conserved disorder signatures in different protein families, which, if
true, will prove valuable for functional characterization.
On a larger scale, this project shows a meaningful perspective for the understanding
of protein function, through intrinsic protein disorder. The analysis pipeline developed
in this study will be instrumental for large-scale functional studies of protein families.
Findings from this project will also contribute to scientific knowledge in
transcriptional
regulation
and
cell
signaling.
iv
List of Tables
Table 1. Ranges of timescales and amplitudes where protein dynamics have been
reported to occur.
Table 2. Performance comparison of primary and meta-predictors for disorder
prediction at their respective optimum thresholds. The predictive performance of
MetaDisorder MD2 and P+F (DisBatch) is highlighted in bold.
ii
List of Figures
Figure 1. The two types of protein dynamics (or protein motions) and their
distribution, relative to protein structure.
Figure 2. A) Bar plot of mean accuracy values of primary and meta disorder
predictors at their respective optimum thresholds, with standard error estimates. B)
Boxplot of accuracy values of primary and meta disorder predictors at their respective
optimum thresholds. Each boxplot depicts the minimum accuracy value, lower
quartile, median, upper quartile, maximum accuracy value and any outlier
observation(s) for each predictor. The boxplot for MetaDisorder MD2 and P+F
(DisBatch) is highlighted in grey.
Figure 3. Sequence submission page of DisBatch. DisBatch is available at
/>Figure 4 Output page of DisBatch. The page provides download links for each output
file, and a link to the help page at the bottom of the page.
Figure 5. Detailed sequence inclusion and exclusion criteria for records in NFκB
Base.
Figure 6. Number of records present in NFκB Base (Release: Beta 2.0) for each
NFκB protein type. NFκB Base is available at
/>Figure 7. A typical entry page of NFκB Base. Each entry contains information, where
available on source accession, NFκB protein type, description, organism, gene name,
chromosome name, sequence length, accession number(s) of duplicate record(s) and
cross-links to major online databases, including NCBI Protein (sequence database),
UniProt (sequence database), GO (Gene Ontology database), HGNC (gene
nomenclature database), InterPro (protein domain and family database), PDB (protein
iii
structure database), PubMed (literature database) and NCBI Taxonomy (taxonomy
database).
Figure 8. Sample keyword search output of NFκB Base, displaying the accession
number, source accession number, organism and description fields. NFκB Base
supports keyword searches in all or specific fields, where users can submit a query at
the top of every page, shown in the upper frame of this figure.
Figure 9. The Browse page of NFκB Base with jQuery supported dynamic data
search and display.
Figure 10. BLAST interface for NFκB Base.
Figure 11. Distribution of the average disorder score at each alignment position for
Class I NFκB proteins at the RHD domain of A) NFκB1, B) NFκB2 and C) Relish, as
predicted by DisBatch. The average disorder score cutoffs of 0.5 and 1.5 were used to
distinguish between moderately (predicted only by PrDOS to be disordered) and
highly disordered (predicted by both PrDOS and FoldIndex) residues, respectively.
Shannon’s entropy values were also plotted in the graph for comparison.
Figure 12. Distribution of the average disorder score at each alignment position for
Class II NFκB proteins at the RHD domain of A) RelA, B) RelB, C) C-Rel, D) Dorsal
and E) Dif, as predicted by DisBatch.
Figure 13. Distribution of the average disorder score at each alignment position for
Class I NFκB proteins at the IPT domain of A) NFκB1, B) NFκB2 and C) Relish, as
predicted by DisBatch.
Figure 14. Distribution of the average disorder score at each alignment position for
Class II NFκB proteins at the IPT domain of A) RelA, B) RelB, C) C-Rel, D) Dorsal
and E) Dif, as predicted by DisBatch.
iv
Figure 15. Distribution of the average disorder score at each alignment position for
Class I NFκB proteins at sites with no functional annotation in A) NFκB1, B) NFκB2
and C) Relish, as predicted by DisBatch.
Figure 16. Distribution of the average disorder score at each alignment position for
Class II NFκB proteins at sites with no functional annotation in A) RelA, B) RelB, C)
C-Rel, D) Dorsal and E) Dif, as predicted by DisBatch.
Figure 17. Distribution of the average disorder score at each alignment position for
Class I NFκB proteins at the ANK domain (in red) and Death domain (in black) of A)
NFκB1, B) NFκB2 and C) Relish, as predicted by DisBatch.
Figure 18. Scatter plot of average disorder score against the standard deviation of
disorder scores for Class I NFκB proteins, A) NFκB1, B) NFκB2 and C) Relish, as
predicted by DisBatch. The scatter plots show 2 distinct quadrants of: conserved nondisordered residues (bottom left) and conserved disordered residues (bottom right).
Functional domains and sites were annotated in the graph and coloured accordingly.
Figure 19. Scatter plot of average disorder score against the standard deviation of
disorder scores for Class II NFκB proteins, A) RelA, B) RelB and C) C-Rel, as
predicted by DisBatch.
Figure 20. (Cont’d from Figure 19) Scatter plot of average disorder score against the
standard deviation of average disorder score for Class II NFκB proteins, A) Dorsal, B)
Dif, as predicted by DisBatch.
Figure 21. Scatter plot of average disorder score against the CV of average disorder
score for Class I NFκB proteins, A) NFκB1, B) NFκB2 and C) Relish, as predicted by
DisBatch. The scatter plot shows 4 distinct quadrants of: non-conserved, nondisordered residues (top left of scatter plot), non-conserved disordered residues (top
right), conserved non-disordered residues (bottom left) and conserved disordered
residues (bottom right). Functional domains and sites were annotated in the graph and
coloured accordingly.
v
Figure 22. Scatter plot of average disorder score against the CV of average disorder
score for Class II NFκB proteins, A) RelA, B) RelB and C)C-Rel, as predicted by
DisBatch.
Figure 23. (Cont’d from Figure 22) Scatter plot of average disorder score against the
CV of average disorder score for Class II NFκB proteins, A) Dorsal, B) Dif, as
predicted by DisBatch.
Figure 24. Structures of representative Class I NFκB homodimers, NFκB1 (top) and
NFκB2 (bottom), coloured according to protein disorder annotations (left) and βfactors (right). The C-terminal IPT domain contains ankyrin protein binding sites
enveloping the dimerization interface. Ankyrin repeats and the Death domain were
not present in the 3D structures. The α-helical insert regions are conserved disordered
residues, highlighted in red, at the left of the protein structure in the N-terminal RHD
domain.
Figure 25. Structures of representative Class II NFκB homodimers, RelA (top) and
C-Rel (bottom), coloured according to protein disorder annotations (left) and β-factors
(right).
Figure 26. Structures of representative NFκB heterodimers formed between Class I
and Class II NFκB proteins, coloured according to protein disorder annotations (left)
and β-factors (right). Examples shown here are the RelA-NFκB1 (top) and RelBNFκB2 (bottom) heterodimers.
Figure 27. Structures of representative RelA homodimer (top) and RelA-NFκB1
heterodimer (bottom) in the IκB inhibited state, coloured according to protein disorder
annotations (left) and β-factors (right).
vi
List of Abbreviations
ADP - Adenosine Diphosphate
ATP – Adenosine Triphosphate
CASP - Critical Assessment of Techniques for Protein Structure Prediction
CD - Circular Dichroism
CD4 - Cluster of Differentiation 4
CGI – Common Gateway Interface
CSV – Comma Seperated Values
DisProt - Database of Protein Disorder
DSSP - Dictionary of Secondary Structure of Proteins
HIV - Human Immunodeficiency Virus
HTML - HyperText Markup Language
JAK - Janus kinase
LAMP – Linux Apache MySQL PERL/PHP/Python
MAPK - Mitogen-Activated Protein Kinase (MAPK)
NCBI - National Center for Biotechnology Information
NFkB - Nuclear Factor Kappa-light-chain-enhancer of activated B Cells
NMR - Nuclear Magnetic Resonance
P13K - Phosphatidylionsitol 3-Kinase
PDB – Protein Data Bank
PONDR - Predictor Of Natural Disordered Regions
PSSM – Position-Specific Scoring Matrix
RH Domain – Rel Homology domain
SD – Standard Deviation
STAT - Signal Transducer and Transcription Factors
SVM – Support Vector Machine
TAD – Transactivation Domain
RMSD - Root Mean Square Deviation
vii
Table of Contents
1
Introduction ....................................................................................................................... 1
1.1
Protein Dynamics ........................................................................................................... 1
1.2
Functional Significance of Protein Dynamics ................................................................. 2
1.2.1
1.3
Role of Protein Dynamics in Cell Signaling ................................................................. 3
Intrinsic Protein Disorder ............................................................................................... 4
1.3.1
Role of Intrinsic Protein Disorder in Cell Signaling..................................................... 5
1.3.2
Identification of intrinsic protein disorder................................................................. 5
1.3.2.1
Computational Tools for Intrinsic Protein Disorder Prediction ................................. 6
1.3.2.1.1
Ab-Initio Approaches.............................................................................................. 6
1.3.2.1.2
Template-based Approaches ................................................................................. 7
1.3.2.1.3
Meta Approaches ................................................................................................... 8
1.3.2.2
Benchmark Datasets for Intrinsic Protein Disorder Prediction .................................. 9
1.3.3
Functional Conservation of Intrinsic Protein Disorder .............................................. 9
1.4
2
Hypothesis.................................................................................................................... 10
Literature Review ............................................................................................................. 10
2.1
Transcription Factors ................................................................................................... 10
2.2
The NFkB Transcription Factor Family ......................................................................... 11
2.2.1
Mechanisms of Action of NFκB ................................................................................ 12
2.2.2
NFκB in Human Diseases .......................................................................................... 14
2.3
Computational analysis of NFκB proteins .................................................................... 15
2.3.1
Systems analysis of NFκB signaling machinery ........................................................ 15
2.3.2
Sequence Analysis of NFκB ...................................................................................... 16
2.3.2.1
Structural Analysis of NFκB ...................................................................................... 17
2.4
2.4.1
Protein Dynamics Analysis of NFκB.............................................................................. 18
Intrinsic Protein Disorder Analysis of NFκB ............................................................. 18
2.5
Limitations of reported studies.................................................................................... 18
2.6
Research Aims and Objectives ..................................................................................... 19
3 DisBatch: A Faster Meta-Prediction System for Large-Scale Identification of Intrinsically
Disordered Protein Regions ..................................................................................................... 21
3.1
Background .................................................................................................................. 21
viii
3.2
Materials and Methods................................................................................................ 22
3.2.1
Server Infrastructure ................................................................................................ 22
3.2.2
Primary Disorder Predictor Selection ...................................................................... 23
3.2.3
Meta-predictor Development .................................................................................. 23
3.2.4
Performance Evaluation........................................................................................... 24
3.2.5
Performance Measures............................................................................................ 25
3.2.6
Web Interface .......................................................................................................... 26
3.3
Results .......................................................................................................................... 26
3.3.1
Predictive Performance ........................................................................................... 26
3.3.2
Features ................................................................................................................... 29
3.4
Discussion..................................................................................................................... 31
3.4.1
Predictive Performance ........................................................................................... 31
3.4.2
Scoring Algorithm..................................................................................................... 32
3.4.3
Benchmark Model .................................................................................................... 32
3.4.4
Testing Dataset ........................................................................................................ 33
3.4.5
Software Limitation.................................................................................................. 34
3.5
Future Work ................................................................................................................. 34
3.6
Chapter Conclusion ...................................................................................................... 35
4
NFκB Base : A Specialized Database of NFκB Proteins ..................................................... 36
4.1
Background .................................................................................................................. 36
4.2
Materials and Methods................................................................................................ 37
4.2.1
Server Infrastructure ................................................................................................ 37
4.2.2
Sequence Data Collection ........................................................................................ 37
4.2.2.1
Inclusion and Exclusion Criteria ............................................................................... 37
4.2.3
Database Design....................................................................................................... 38
4.2.4
Web Interface .......................................................................................................... 39
4.2.5
Results ...................................................................................................................... 40
4.2.5.1
NFκB Base Content................................................................................................... 40
4.2.5.2
Features ................................................................................................................... 40
4.2.5.2.1
Keyword Search ................................................................................................... 40
4.2.5.2.2
Sequence Similarity Search .................................................................................. 43
4.2.5.2.3
Batch Download ................................................................................................... 43
4.2.6
Discussion................................................................................................................. 45
4.2.7
Future Work ............................................................................................................. 45
ix
4.2.7.1
Community Annotation Policy ................................................................................. 45
4.2.8
Chapter Conclusion .................................................................................................. 46
5
The Role of Conserved Disordered Residues in NFκB Function ....................................... 47
5.1
Background .................................................................................................................. 47
5.2
Materials and Methods................................................................................................ 48
5.2.1
Sequence Data Collection ........................................................................................ 48
5.2.2
Multiple Sequence Alignment.................................................................................. 48
5.2.3
Entropy Analysis ....................................................................................................... 49
5.2.4
Intrinsic Protein Disorder Analysis ........................................................................... 49
5.2.5
Conservation of Intrinsic Protein Disorder .............................................................. 49
5.2.6
Structural Analysis ................................................................................................... 50
5.3
Results .......................................................................................................................... 51
5.3.1
Conserved intrinsic protein disorder signatures in NFκB ........................................ 51
5.3.2
Structural Analysis ................................................................................................... 68
5.4
Discussion..................................................................................................................... 73
5.5
Future Work ................................................................................................................. 76
5.6
Chapter Conclusion ...................................................................................................... 77
6
Conclusion ........................................................................................................................ 79
7
References ....................................................................................................................... 80
x
1 Introduction
1.1 Protein Dynamics
Protein structures are dynamic in nature and undergo motion – a property that is an
integral part of their function[1-3].
Protein dynamics (or protein motion) occurs over a wide range of amplitudes and
timescales. For example, simple local internal motions, such as bond and angle
rotations, occur on a femto- to picosecond timescale[4]. Side-chain and loop motions
occur on a pico- to nanosecond time scale, while global external motions involving
large-scale conformational rearrangements occur on a micro- to millisecond
timescale[5,6]. Molecular interactions and binding occur on the second timescale
(Table 1)[2]. Additionally, complex, orchestrated protein motion, such as those
involving molecular motors has also been observed[3].
Table 1. Ranges of timescales and amplitudes where protein dynamics have been reported to occur.
Timescale
Femtosecond
Picosecond
Nanosecond
Microsecond
Millisecond
>1 second
Examples
Bond and angle vibrations
Side chain rotations
Hinge bending at domain interfaces
Helix-coil transitions
Protein folding, actin-myosin motion
Molecular interaction, binding
Amplitude
< 0.001 - 0.1 Å
0.1 - 1 Å
1 – 10 Å
10 Å - 100 Å
10 Å - 100 Å
10 - >100 Å
1
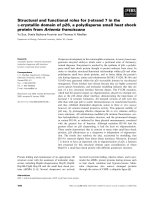
Figure 1. The two types of protein dynamics (or protein motions) and their distribution, relative to protein
structure.
Across timescales and amplitudes, protein dynamics can be broadly categorized into
internal and external motion[7]. Internal motion involves the deformation of protein
segment(s) such as bond, angle or side-chain rotations[7]. External motion, on the
other hand, encompasses the translational and rotational motions of protein
segment(s), such as hinge and shear motion, involving the protein backbone (Figure
1)[7,8].
Besides well-structured, ordered regions of proteins, protein dynamics have also been
studied in non-globular, unstructured and/or flexible regions (to be referred to as
intrinsically disordered regions)[9], where they contribute to a number of important
functions. Intrinsically disordered regions will be described in detail in Section 1.2.
1.2 Functional Significance of Protein Dynamics
Protein dynamics are fundamentally involved in important biological events, such as
protein folding, conformational changes and protein-protein interactions[2]. These
events are in turn vital to a large array of essential biological processes and
functions[1,3,6,10-12].
2
An example is the crucial role of protein dynamics in muscle contraction[6]. Muscle
contraction involves the cross-bridge cycle, with the first step involving adenosine
triphosphate (ATP) binding to the myosin head. Binding of the myosin head to actin
myofilaments, and calcium to the complex, leads to changes in electrostatic charges
and cross-bridge formation. Subsequent hydrolysis of ATP to adenosine triphosphate
(ADP) alters the conformation of the head of the cross-bridge and produces energy for
the pulling movement of the actin filament towards the centre of the cell. Finally, the
release of ADP disrupts binding with the actin filament and restarts the cycle with the
next ATP binding event, in the presence of calcium ions.
At a smaller scale, protein dynamics is also involved in human immunodeficiency
virus (HIV) infection[12]. This is mediated through the binding of the envelope
glycoprotein, gp120, to a c (CD4) receptor. Briefly, the binding event causes
conformational changes in gp120, in turn promoting the binding of HIV-1 to
chemokine receptors on the host cell, such as CCR5 or CXCR4. This activates the
gp41 protein and promotes the fusion of the HIV outer membrane with the host cell,
thereby permitting viral entry and infection.
1.2.1 Role of Protein Dynamics in Cell Signaling
An important process where protein dynamics plays an especially significant role is in
cell signaling[10,11]. Cell signaling involves specific recognition sites and strict
regulation of participating proteins to coordinate molecular interactions at intraand/or inter-pathway levels, ultimately resulting in combinatorial functional diversity.
The dynamics of vital signaling proteins, such as calmodulin, p53, BRCA1 and
MAP2, and their functional significance have been investigated[10,11,13-15]. Many
of these proteins partake in local internal motion via intrinsically disordered residues
3
that facilitate multiple molecular recognition mechanisms, interactions and
regulation[13-15].
1.3 Intrinsic Protein Disorder
Previous examples in Section 1.2 illustrate the functional role of protein dynamics in
protein segments or regions with stable, localized structures. Conventional ideas,
based on the “lock-and-key” model, highlighted the functional importance of stable,
localized structures. However, there has been increasing evidence that non-globular
domains with unstable and flexible structures, termed intrinsically (or natively)
disordered proteins or protein regions, are also important for function[9,16,17].
Intrinsically disordered proteins lead to poor protein expression and therefore pose
difficulties in protein purification and crystallization, hindering high throughput
structural determination[18].
Functional sites, mainly short linear motifs such as sorting signals, targeting signals,
protein ligands and post-translational modification sites, have been observed in
intrinsically disordered proteins and regions[18]. To date, many intrinsically
disordered proteins and protein regions have been reported[19,20]. These proteins and
regions have been discovered to be either completely or largely disordered, becoming
structured only in their bound states (e.g. CREB-CBP complex [21]) or in the
presence of changes in the biochemical environment [19,20]. Intrinsically disordered
proteins and protein regions have been reported to engage multiple binding partners
and are involved in many biological events and pathways, especially during cell
signaling[14,15,22-24].
4
1.3.1 Role of Intrinsic Protein Disorder in Cell Signaling
In the context of cell signaling, intrinsically disordered proteins and regions have been
associated with many regulatory events. Intrinsic protein disorder confers various
functional advantages, which include the capability to i) accommodate more
interaction partners and modification sites, ii) provide flexibility in regulation with
multiple, relatively low affinity linear interaction sites, iii) provide regulation
specificity with fewer linear motif types and iv) provide large intermolecular
interfaces with smaller protein, genome and cell sizes[25].
For example, the recognition of DNA by disordered peptides has been shown to be
involved in the regulation of gene expression by transcription, epigenetic
modifications and gene silencing[26].
1.3.2 Identification of intrinsic protein disorder
Intrinsically disordered proteins and protein regions can be indirectly observed
experimentally, using X-ray crystallography, Nuclear Magnetic Resonance (NMR-),
Raman-,
Circular
Dichroism
(CD-)
spectroscopy
and
hydrodynamic
measurements[18]. These laboratory methods recognize different types of protein
disorder, giving rise to various definitions of intrinsic protein disorder, such as highly
flexible regions, regions lacking a secondary structure or regions lacking a welldefined tertiary structure[18,27].
Experimental methods for detecting intrinsic protein disorder are often hampered by
the lack of stable protein structures[27]. To overcome this limitation, various
computational tools have been developed for the prediction of intrinsically disordered
proteins and protein regions from primary protein sequences[27].
5
1.3.2.1
Computational
Tools
for
Intrinsic
Protein
Disorder
Prediction
Various definitions have been used to describe intrinsically disordered protein
regions[18]. Consequently, computational tools designed for the prediction of
intrinsic protein disorder utilize different approaches, based on different operational
definitions of intrinsic protein disorder[18]. They can be broadly classified into abinitio approaches, template-based approaches and meta approaches[28].
1.3.2.1.1 Ab-Initio Approaches
Ab-initio approaches utilize only sequence-derived information for disorder
prediction. They originated from early methods that detect low-complexity regions in
protein sequences, such as SEG[9],[29]. Wootton’s study on compositionally biased
regions in sequence databases illustrated the association between these regions and
non-globular domains[9]. However, these methods have been shown to produce
copious false hits, since the correlation between disordered regions and low sequence
complexity does not always hold true. More refined methods have since been
designed[30].
The earliest prediction system developed specifically for intrinsic protein disorder
prediction was the suite of PONDR® (Predictor Of Natural Disordered Regions)
neural network predictors, which identify intrinsically disordered regions based on
properties such as local amino acid composition, flexibility, hydropathy and
coordination number[31]. Subsequent examples include the FoldIndex software, in
which prediction is based on the average residue hydrophobicity and net charge[32].
IUPred is another tool in which intrinsic protein disorder is predicted through
6
estimates of the capability of amino acid residues to form stable, favourable contacts
based on pair-wise energy content[33]. IUPred adopted the underlying assumption
that in contrast to globular proteins, intrinsically disordered proteins are not capable
of forming a large number of stable, favourable interactions[33].
Some ab-initio methods derive secondary and/or tertiary structure information from
input protein sequences to check for the presence of loops or coils, which are
considered to be non-regular secondary structures. For example, GlobPlot[34]
calculates Russell/Linding propensities for input amino acid residues to be in regular
secondary structures (α -helices or ß-strands) and non-regular secondary structures,
defined by the Definition of Secondary Structure of Proteins (DSSP)[35],
respectively. On the other hand, DISOPRED2[36] and the DisEMBL REMARK465
predictors were trained on Protein Data Bank (PDB)[37] structural data[18] to
identify amino acid residues present in the sequence but missing in X-ray structures.
DisEMBL also predicts protein disorder by detecting “hot loops”, utilizing both
secondary and tertiary structure information derived from input sequences[18]. The
algorithm detects highly dynamic DSSP-defined loops/coils with high β-factors (C-α
temperature factors), according to the training set of PDB[37] structure data[18].
1.3.2.1.2 Template-based Approaches
Template-based approaches perform comparisons of input data with similar sequence
or structure data to determine intrinsic protein disorder. For example, PrDOS[38]
performs PSI-BLAST searches of query protein sequences against structural datasets
of homologous proteins to predict intrinsically disordered residues, in addition to its
support vector machine (SVM) algorithm trained on position-specific scoring
matrices (PSSM). DISOclust[39] performs template-based prediction by first
7
determining the per-residue error of the input protein sequence in multiple protein
fold recognition models, built from homologous templates, followed by analysis of
the conservation of per-residue error across these models.
1.3.2.1.3 Meta Approaches
Meta approaches are tools, termed meta-predictors, which combine the prediction
results of multiple prediction methods. The availability of primary intrinsic protein
disorder prediction tools has sparked increased research interest in meta-predictors,
which have demonstrated higher prediction accuracies than primary predictors.
An example of a meta-prediction system is Meta-Disorder (MD) predictor, which
integrates prediction results from orthogonal sources of information and explicit
predictions of secondary structure, solvent accessibility and other sequence properties,
as inputs to neural networks for model training[40]. Subsequently, MD selects the
optimum algorithm for disorder prediction[40]. GeneSilico Disorder MD2 is another
example of a high performance meta-predictor[41]. The genetic algorithm-based
system first combines and weighs the results of 15 primary predictors, based on
accuracy. Subsequently, it collects the best alignments from the 8-fold recognition
method and infers protein disorder from alignment gaps. Other meta-predictors
reported in the literature include metaPrDOS[42] and PONDR-FIT[43]. In support of
meta-prediction efforts, a metaserver, MeDor[44], has also been developed to
facilitate easy retrieval and visualization of results from primary disorder prediction
systems.
8
1.3.2.2
Benchmark
Datasets
for
Intrinsic
Protein
Disorder
Prediction
To provide further impetus for intrinsic protein disorder prediction, since 2002, the
worldwide Critical Assessment of Techniques for Protein Structure Prediction
(CASP) experiments introduced a new category for protein disorder prediction, using
blind benchmark datasets[45].
Intrinsic protein disorder prediction has also been facilitated by the availability of the
Database of Protein Disorder (DisProt) since 2005[46]. DisProt is a specialized
database containing sequences across multiple species annotated with experimentally
verified intrinsically disordered regions[46].
1.3.3 Functional Conservation of Intrinsic Protein Disorder
The functional importance of intrinsically disordered proteins and protein regions
raises the likelihood that intrinsically disordered protein residues are evolutionarily
conserved. This proposal is in line with studies demonstrating that protein dynamics
properties, such as protein backbone flexibility, protein side-chain dynamics and
protein vibrational dynamics, are conserved[47-50].
Conservation of protein disorder has been studied by Chen et al. who demonstrated
that intrinsically disordered regions are conserved in protein domains and
families[51]. Reports have also shown that evolutionary conservation and
maintenance of protein disorder is costly and therefore non-trivial and non-random,
further supporting its indispensable functional significance[26,52-54].
9
1.4 Hypothesis
In the context of cell signaling, the evidence outlined in previous sections implies that
cell
signaling
proteins
generally
possess
varying
degrees
of
protein
dynamics[10,11,22]. These dynamics modulate changes in binding affinity and
specificity, which is in turn responsible for generating downstream functional
diversity in signaling pathways. In addition, dynamic properties of proteins have been
found to be encoded in their primary sequences and conserved in protein domains and
families [10,29]. Nevertheless, to date, in-depth analysis on the correlation between
conservation of dynamic properties and sequence and functional conservation is
lacking in literature. In view of the importance of intrinsically disordered protein
regions in cell signaling, it is hypothesized that a case study on an exemplar cell
signaling protein homologous sequence family will bring useful insights to the
relationship between conservation of dynamic properties and sequence conservation.
For this project, I have selected the Nuclear Factor Kappa-light-chain-enhancer of
Activated B cells (NFκB/Rel), a transcription factor protein family important for a
variety of processes including cell survival, inflammation and immunity[55-57]. This
project is part of a larger study exploring the function and role of NFκB in cell
signaling and immunity.
2 Literature Review
2.1 Transcription Factors
Transcription factors are a group of cell signaling proteins primarily involved in
transcriptional regulation, one of the key events of cell signaling responsible for gene
regulation and downstream protein expression[57]. These proteins play a pivotal role
10
as ‘central signaling hubs’ that carry and control the flow of information in biological
pathways from receptors to DNA[13]. Transcription factors regulate a variety of
diverse cellular and organismal processes[57]. Their high binding specificities,
coupled with tight regulation, have enabled transcription factors to process a huge
diversity of signal information with remarkable precision[57]. To date, the intricate
mechanisms of transcriptional regulation machinery have not been fully elucidated.
2.2 The NFkB Transcription Factor Family
The NFκB (Nuclear Factor Kappa-light-chain-enhancer of activated B cells) or Rel
protein family consists of a group of ubiquitously expressed, highly inducible and
structurally-related eukaryotic transcription factors[58]. They are involved in a large
variety of cellular and organismal processes, including the cellular stress response,
cell proliferation and survival, apoptosis, inflammation and innate and adaptive
immunity[55-57,59-61]. All NFκB transcription factors are related by a highly
conserved NH2-terminal Rel homology (RH) domain, responsible for DNA binding
and dimerization[58]. These proteins can be divided into two functionally distinct
classes that are capable of heterodimerizing freely, based on their C-terminus
sequence[58].
There are five mammalian NFκB proteins: NFκB1(p50/p105), NFκB2 p52/p100),
RelA(p65), RelB and c-Rel[59. The Class I proteins, including NFκB1 (p50/p105),
NFκB2 (p52/p100) and Drosophila Relish, contain a number of ankyrin repeats with
trans-repression activity at their C-terminus[59]. Class I proteins possess strong DNA
binding activity but weak transcriptional activation potential and are generally not
activators of transcription, except when they form heterodimers with Class II
proteins[59. The Class II (Rel) proteins, including RelA(p65), RelB, c-Rel, v-Rel and
11
the Drosophila Dorsal and Dif proteins, in contrast, exhibit weak DNA binding
activity and are observed to contain a potent trans-activation domain at their Cterminus[59].
2.2.1 Mechanisms of Action of NFκB
NFκB proteins associate into homo- and hetero-dimers that bind to target 9-10 DNA
base pair κB sites[59. The p50-RelA heterodimer represents the prototypical NFκB
complex and is the major NFκB complex found in most cells. The subunit
composition of the NFκB complex affects its DNA binding site specificity,
subcellular localization, trans-activation potential and mode of regulation, therefore
leading to combinatorial diversity of the downstream responses[58,62,63].
NFκB complexes are regulated via several pathways that control its translocation
from the cytoplasm to the nucleus, in response to extracellular stimuli[61,64]. To date,
at least three major signaling pathways have been identified: the IκB kinase (IKK)dependent canonical pathway, the IKK-dependent non-canonical pathway, and the
IKK-independent p38-CK2 pathway[61,64]. The IKK-dependent canonical pathway
involves the regulation of NFκB dimers containing RelA or c-Rel, through association
with a family of inhibitors known as IκBs (inhibitors of κB), which includes p100,
p105, IκBα, IκBβ, IκBγ, IκBε, IκBΖ, Bcl-3 and the Drosophilia Cactus protein[65].
IκBs typically inhibit the interaction of NFκB with DNA by blocking the DNA
binding sites of NFκB transcription factors[65]. IκB-NFκB interactions are, in turn,
mediated by the IκB kinase (IKK), a complex composed of the catalytic IKKα and
IKKβ subunits, and a regulatory subunit known as IKKγ or NEMO[61,64]. The IKK
complex, upon activation, phosphorylates two specific serine residues located at the
NH2-regulatory domain of IκB, leading to IκB ubiquitination and proteosome12