Mining non contiguous mutation chain in biological sequences based on 3d structure
Bạn đang xem bản rút gọn của tài liệu. Xem và tải ngay bản đầy đủ của tài liệu tại đây (1.58 MB, 52 trang )
Mining Non-Contiguous Mutation
Chain in Biological Sequences based
on 3D-structure
Huang Wei
NATIONAL UNIVERSITY OF SINGAPORE
2011
Mining Non-Continguous Mutation
Chain in Biological Sequences based
on 3D-structure
Huang Wei
(B.COMP, SCU)
A THESIS SUBMITTED
FOR THE DEGREE OF MASTER OF
SCIENCE
DEPARTMENT OF COMPUTER SCIENCE
NATIONAL UNIVERSITY OF
SINGAPORE
2011
2
Acknowledgment
I am thankful to Prof. Wynne Hsu and Prof. Mong Li Lee for their constant
encouragement, guidance and support. I appreciate their vast knowledge in
many areas, and their insights and suggestions that have helped to shape
my research skills. I am also grateful to Dr Tong Joo Chuan and Dr Feng
Mengling from A*STAR. They help me to verify the experiment results on
the real world influenza A virus dataset in bioinformatics domain. Finally, I
would like to thank Dr. Sheng Chang for providing me the data generator
source code.
I offer my regards and blessings to all the students in the database group.
I have enjoyed all the discussions we had on various topics, and I have lots
of fun being a member of this fantastic group. I would especially like to
thank Zhao Gang, Li Xiaohui, Han Zhen, Chen Qi, Patel Dhaval and all the
other current members in Database lab 2. They are such good and dedicated
friends who are always ready to lend a helping hand to me. Lastly, I thank my
family for always being there when I needed them most and for supporting
me in all these years.
3
Summary
Understanding how an infectious agent mutates from one form to another
can provide insights into the mechanisms of disease pathogenesis and epidemiology. Existing methods of sequence analysis which focus on identifying
regions of similarity may help explain functional or phenotypic variability.
However, these approaches do not take into account the spatio-temporal
dynamics of virus evolution. Recently, Sheng et. al [42] introduced an approach that incorporated spatio-temporal information to analyze mutation
chains in influenza A proteomes. However, this work was restricted to mining
contiguous subsequences of mutations, not taking into account the practical
3D-structure of the protein.
In this thesis, we generalize the definition for mutation chain to allow
for mining of non-contiguous mutations. We design an efficient algorithm,
termed ptM utationChian − M iner, to search for non-contiguous mutation
chains in influenza A proteomes. This algorithm utilizes three pruning strategies local hot positions, valid M utation Space and increment join to reduce
the search space. Experiments on both synthetic and real world influenza
A virus datasets show that the algorithm is effective in discovering noncontinuous mutations that occur geographically over time.
4
Contents
Acknowledgments
3
Summary
4
Contents
5
List of Figures
7
List of Tables
8
1 Introduction
9
1.1 Objectives and Contributions . . . . . . . . . . . . . . . . . . 11
1.2 Organization . . . . . . . . . . . . . . . . . . . . . . . . . . . 12
2 Related Work
2.1 Sequential Pattern Mining . . . . . . . . . . . . . . . . .
2.1.1 Apriori-based Sequential Mining . . . . . . . . . .
2.1.2 Pattern-Growth-based Approaches . . . . . . . .
2.2 Interestingness Measures in Association Patterns Mining
2.3 Spatio-temporal Sequential Patterns Mining . . . . . . .
2.4 Bioinformatics domain . . . . . . . . . . . . . . . . . . .
3 Preliminaries and Definitions
.
.
.
.
.
.
.
.
.
.
.
.
.
.
.
.
.
.
13
13
14
15
16
17
18
19
5
CONTENTS
6
4 Mining Non-Contiguous Mutation Chains
25
4.1 Mining k point mutations . . . . . . . . . . . . . . . . . . . . 26
4.2 Mining the mutation Chain . . . . . . . . . . . . . . . . . . . 34
5 Performance Study
38
5.1 Experiments on Synthetic Datasets . . . . . . . . . . . . . . . 38
5.2 Experiments on Influenza A Virus Dataset . . . . . . . . . . . 40
6 Conclusion and Future Work
45
List of Figures
1.1
Example of non-continuous mutations on a folded protein. . .
3.1
3.2
Spatio-temporal representation of the viruses in Table 1.1. . . 19
Examples of mutation chains. The mutation chain in (a) is a
sub mutation chain of the mutation chain in (b) . . . . . . . . 23
4.1
4.2
4.3
4.4
The mutation chains mining framework. . . . . . . . . . . .
Example to show the generation of sets of k point mutations
PointMutation tree. . . . . . . . . . . . . . . . . . . . . . . .
< 17 : N → T >’s conditional PointMutation tree . . . . . .
.
.
.
.
25
27
30
34
5.1
5.2
Comparative study on effect of pruning techniques . . . . . . .
Proposed geographical spread of the Pandemic Hong Kong flu
(H3N2) between 1968 and 1969 (1: 1968; 2: 1968-69; 3: 1969)
Proposed geographical spread of the Pandemic influenza (H5N1)
in 2003 (1: 2002; 2: 2002-03; 3: 2002-04; 4: 2003; 5: 2003-04;
6: 2004) . . . . . . . . . . . . . . . . . . . . . . . . . . . . . .
Proposed geographical spread of the Pandemic influenza (H5N1)
in 2005 (1: 2004; 2: 2005) . . . . . . . . . . . . . . . . . . . .
39
5.3
5.4
7
9
42
42
43
List of Tables
1.1
An example of influenza A dataset . . . . . . . . . . . . . . . 10
2.1
the example of sequence database . . . . . . . . . . . . . . . . 14
4.1
Mutation base: Virus pairs and their corresponding sets of k
point mutations . . . . . . . . . . . . . . . . . . . . . . . . . . 28
Statistic table: Point mutations and their supporting virus
pairs. (min Support=2 and min Significance=0.4) . . . . . . . 29
The < 17 : N → T >’s conditional mutation base . . . . . . . 33
The < 17 : N → T >’s conditional statistic table. (min Support=2
and min Significance=0.4) . . . . . . . . . . . . . . . . . . . . 33
4.2
4.3
4.4
8
Chapter 1
Introduction
The influenza A virus is a major human pathogen. In order to infect the host,
the pathogen can change its coat proteins from time to time by mutation and
spread quickly across geographical regions by air-borne transmission. These
factors account for seasonal influenza and occasional pandemic influenza [51].
Understanding how the fast evolving influenza A virus mutates from one
form to another can provide insights into the mechanisms of disease pathogenesis and epidemiology, as well as the design of new therapeutic agents.
In particular, it is important to know how the geographical spread of the influenza A virus evolving over time, and the trajectories of the said evolution.
Mutation
Site
rrr
r
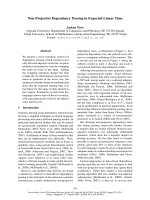
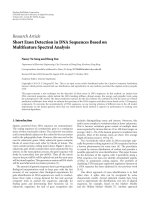
Figure 1.1: Example of non-continuous mutations on a folded protein.
In nature, a protein folds into a particular 3-D structure that allows it
9
INTRODUCTION
10
to effect a function. Therefore, as graphically demonstrated in Figure 1.1,
functional changes of proteins are often caused by non-contiguous mutations.
Incorporating space and time information, we develop the definition of the
mutation chain whose co-mutations mostly occur in non-contiguous positions.
ID
vs1
vs2
vs3
vs4
vs5
vs6
vs7
vs8
Year
1986
1988
1989
1990
1989
1994
1992
1994
Table 1.1:
Country
Canada
USA
Russia
Canada
Vietnam
Spain
USA
Mexico
An example of influenza A dataset
Host
Aligned Sequences
Human AN T CV LEET KP GT QLF N HP D
Avian
DN T CV LEET KSGY QLF T HP D
Human DN T CV LEET KSGT QLF T HP D
Swine
DN −CV LEET KP GY QLF −HP D
Human −N T CV LEET KP GT QLF −HP D
Human −N M DV LEET KSGY QLF −HP D
Avian
AN M DV LEET KSGT QLF N HP D
Swine
DN −−V LEET K−GY QLF T HP D
An example of influenza A dataset is presented in Table 1.1. All virus
subsequences are aligned and a representative sequence segment of twenty
positions(1 . . . 20) is shown for illustration, including gaps (denoted as ”-”).
To understand how a virus mutates from one strain to another, let us first
analyze two highly conserved sequences, vs4 and vs7 , with four amino acid
differences between them. These two viruses are isolated in Canada and USA
(i.e. countries which share a common border) within a viable period of two
years. These factors suggest that vs7 may have mutated from vs4 as follows:
”D”,”C”,”P”,”Y” mutate to ”A”,”D”,”S”,”T” at positions 1,4,11,13 in order.
Similarly, vs7 could possibly mutate to vs8 as there are only three amino acid
differences between the two sequences. A closer examination reveals that vs8
was isolated in Mexico after vs7 in USA. This implies that the virus could
have originated from Canada, spread to USA, and then move on to Mexico.
We denote this movement of mutation as < 1, 13 : DY → AT → DY >,
where 1 and 13 denote the positions where mutations have occurred. Finding
INTRODUCTION
11
such co-occurrences of the mutations over different time points is computationally expensive as the influenza viruses mutate continuously, resulting in
a large number of variants. Existing algorithms are unable to scale up to
such high complexity.
1.1
Objectives and Contributions
In this thesis, we define the concept of a non-contiguous mutation chain.
To the best of our knowledge, the problem of discovering spatio-temporal
patterns of non-contiguous mutation chains in influenza A virus has not been
explored in current bioinformatics research. We summarize the contributions
of this thesis as follows:
• We define the problem of mining non-contiguous mutation chain and
introduce an interesting measurement, Signif icance, to capture the
significance of the mutations.
• We present an integrated algorithm to discover non-contiguous subsequences of mutation chain. The algorithm utilizes a data structure, the
PointMutation tree, to facilitate the mining process.
• We propose three pruning strategies to improve the mining efficiency.
The first strategy prunes off the positions of each sequence that are
unlikely to participate in the formation of valid point mutations. The
second and third strategies aim to reduce the number of candidates
generated by pruning away those sequence chains that are unlikely to
support any valid mutation chains.
• We evaluate our algorithm on both synthetic and real world datasets.
Experiments on the real world Influenza A virus dataset provide insights into the spread and mutation of the highly pathogenic Avian
H5N1 influenza virus and the H3N2 subtype. The discovered mutations
have also been validated against the outbreaks of influenza historically.
INTRODUCTION
1.2
12
Organization
The thesis is organized as follows: Chapter 2 surveys the related work. Chapter 3 introduces some definitions. Chapter 4 describes our algorithm to
mine non-contiguous mutation chains. Experimental results are presented
in Chapter 5. We conclude this thesis and propose some future work in
Chapter 6.
Chapter 2
Related Work
In this chapter we review existing works that are related to this thesis. We
first introduce sequential pattern mining in Chapter 2.1 and describe the
interestingness measures used in frequent pattern mining in Chapter 2.2.
Next, we survey existing algorithms for spatio-temporal sequential patterns
mining in Chapter 2.3. In Chapter 2.4, we examine the recent progress in
bioinformatics domain.
2.1
Sequential Pattern Mining
Sequential pattern mining aims to discover frequent subsequences as patterns
in a sequence database consisting of ordered elements or events. It has many
useful applications such as the analysis of customer purchase behaviors, web
access patterns, telephone calling patterns, science and engineering processes,
medical and disease treatments, natural disasters (e.g., earthquakes), DNA
sequences and gene structures, market stocks data, and so on.
Agrawal et. al. introduced the problem of sequential pattern mining
problem in [5]. Given a set of sequences, where each sequence consists of a
list of elements and each element consists of a set of items. Items within an
element are unordered. Given a user-specified support threshold, sequential
pattern mining is to find complete set of the frequent subsequences that occur
13
RELATED WORK
14
frequently in the dataset.
Given two sequences α = < a1 , a2 . . . an > and β = < b1 , b2 . . . bm >. α is
called a subsequence of β or β is a super sequence of α, denoted as α ⊆ β, if
there exist integers 1 ≤ j1 < j2 < · · · < jn ≤ m such that a1 ⊆ bj1 , a2 ⊆ bj2 ,
. . . , an ⊆ bjn .
Table 2.1: the example of sequence database
SID
sequence
1
<b(bcd)(bd)e(dg)>
2
<(be)d(cd)(bf)>
3
<(fg)(bc)(eg)dc>
4
<fh(bg)dcd>
Take the example of the sequence database in Table 2.1, the sequence
<b(cd)ed> is a subsequence of <b(bcd)(bd)e(dg)>. Suppose the support
threshold min sup = 2, then <(bc)d> is a sequential pattern.
There are two popular approaches to perform sequential pattern mining,
namely: Apriori-based approach and pattern-growth-based approach.
2.1.1
Apriori-based Sequential Mining
The Apriori property states that if a sequence S is not frequent, then none of
the super-sequences of S is frequent. For example, consider the example in
Table 2.1, suppose the support threshold min sup = 2, if <gb> is infrequent,
then <g(bc)e> is also not frequent.
Both GSP [46] and SPADE [54] utilize this property to reduce the search
space by pruning the unpromising candidates.
GSP adopts a multiple-pass, candidate-generation-and-test approach. The
basic idea is as follows: Initially, every item in the database is a candidate of
length 1. For each level (i.e., sequences of length-k), we scan the database to
RELATED WORK
15
compute support count for each candidate sequence and generate candidate
length-(k+1) sequences from length-k frequent sequences. The algorithm
terminates when no new sequential pattern is generated.
SPADE (Sequential PAttern Discovery using Equivalent Class) [54] employs a vertical formatting method with a lattice search technique. A sequence database is mapped to a large set of <SID, EID> in the form of a
vertical id-list database format. And we associate each sequence with a list
of objects, in which it occurs, along with the time-stamps. Therefore all
frequent sequences can be enumerated via simple temporal joins (or intersections) on id-lists. Another lattice-theoretic approach is to decompose the
original search space (lattice) into smaller pieces (sub-lattices) which can be
processed independently in main-memory. This approach usually requires
three database scans, or only a single scan with some pre-processed information.
There are many other studies [9, 14, 16, 29, 31, 36, 45] which have utilized
the Apriori property to aid in the efficient mining of sequential patterns or
other frequent patterns in time related data. However, these methods all
suffer from the limitations of requiring multiple scans of the database and
generating a huge set of candidate sequences. As a result, they are not
suitable for mining long sequential patterns.
2.1.2
Pattern-Growth-based Approaches
Inspired by Agarwal et al. [2] and J. Han et al. [19], pattern-growth-based approaches have been proposed to mine long sequential patterns. The basic idea
is to facilitate sequential pattern mining through projecting the database.
There are two typical pattern-growth-based methods: FreeSpan [18] and
PrefixSpan [38].
FreeSpan (Frequent pattern projected Sequential pattern mining) uses
the frequent items to recursively project sequence databases into a set of
smaller projected databases and grow subsequence fragments in each projected database. This process partitions both the data and the set of fre-
RELATED WORK
16
quent patterns to be tested, and confines each test being conducted to the
corresponding smaller projected database. However, since a subsequence
may be generated by any substring combination in a sequence, projection in
FreeSpan has to keep the whole sequence in the original database without
length reduction. Moreover, since the growth of a subsequence is explored at
any split point in candidate sequence, it is costly.
In order to overcome the bottleneck of FreeSpan, J. Pei et al. proposed the
PrefixSpan [38] algorithm. Instead of projecting sequence databases by considering all the possible occurrences of frequent subsequences in FreeSpan, the
projection of PrefixSpan is based only on frequent prefixes because any frequent subsequence can always be found by growing a frequent prefix. Hence,
PrefixSpan examines only the prefix subsequences and project only their
corresponding postfix subsequences into the projected databases. In each
projected database, sequential patterns are grown by exploring only local
frequent patterns which support the short frequent patterns for the mining
of longer patterns.
However, these algorithms do not adapt well to the problem of mining
mutation chains where the transactions consists of exponential number of
mutations and is positional-dependent.
2.2
Interestingness Measures in Association
Patterns Mining
The essence of association rule mining is to analyze the relationships among
variables and find those interesting association rules [4]. There are many
applications of association rules mining, particularly in finding associations
among items in customer transactions [6, 17, 20, 21, 32, 37, 41, 1, 47, 53].
To identify the interesting association rules, correlation has been adopted
as an interestingness measure. This measure aims to identify groups of variables which are strongly correlated with each other or with a specific target
variable. Based on the correlation measure, we are able to capture the de-
RELATED WORK
17
pendencies among variables.
Another interestingness measure is the lift measure as proposed by Brin
et. al. [10]. However, the lift measure does not satisfy the downward
closure property [7]. As a results, several other interestingness measurements
have been proposed and extensively studied to capture the interestingness of
association patterns [27, 43, 3, 44, 28]. In addition, the works in [34, 48]
mention about the criteria for selecting the suitable interestingness measures
for different applications.
2.3
Spatio-temporal Sequential Patterns Mining
Spatio-temporal sequential patterns are useful in the investigation of spatiotemporal evolutions of phenomena in many application fields. However,
straightforward application of existing sequential pattern mining methods
to spatio-temporal data by ”transactionization” of spatial and temporal domains may be unnatural due to the continuity of space and time [23]. The
main problem is that it is highly possible to miss the spatial, temporal, or
spatio-temporal relationships which are across partition/transaction boundaries in a disjoint partitioning; and because of an overlapping partitioning,
a relationship may be counted more than once. Recently, Huang et. al [24]
proposed a framework for mining sequential patterns from event data. They
defined the neighborhood of an event within the space-time dimension and
proposed a significance measure that considers the density of event type.
Another type of spatio-temporal data is the trajectory data. A trajectory
is a sequence of the locations and timestamps of a moving object. Mamoulis
et al. [30, 11, 15] discussed the indexing, querying and mining of trajectory
data. Retrieving similar trajectories can reveal the underlying traveling patterns of moving objects in the data. Example applications include homeland
security (e.g., border monitoring), law enforcement (e.g., video surveillance),
weather forecast, traffic control, location-based service. Mamoulis et. al.
RELATED WORK
18
proposed models and algorithms to investigate the trajectories of objects
for mining frequent periodic subtrajectory, which consists of a sequence of
frequently visited places on trajectories.
2.4
Bioinformatics domain
In the bioinformatics domain, sequential pattern mining techniques have
been applied to biological databases to find interesting protein or genome
patterns [50, 22]. A biosequence has the following characteristics:
• It has a very small alphabet. For example, 20 for protein sequences
and 4 for DNA sequences.
• It has a vary long sequence length of few hundreds, sometime thousands.
• It may contain gaps over long regions.
Because of the above characteristics, it is infeasible to enumerate the
entire solution space. The works in [33, 49, 25, 40] make use of heuristics or
structural constraints, such as the maximum gaps allowed or the maximum
pattern length, to reduce the search space.
Recently, the framework proposed by Huang et. al [24] can discover
long, single point mutations (i.e., mutations which occur multiple times at
a specific position) across multiple sequences. However, they are unable to
find co-mutations involving multiple positions. Other works try to utilize the
translation probability matrix to estimate the future composition of amino
acids [52, 26], but these works only consider the mutation in one position
and cannot analyze how the mutations spread geographically over time.
Sheng et. al [42] proposed a different framework to mine co-mutations
across multiple sequences. However, the algorithm does not take into account
the 3D-structure of protein and mines only the mutations that occur in k
contiguous positions. This restriction to continuous positions may result in
missing some biologically meaningful patterns.
Chapter 3
Preliminaries and Definitions
A virus protein sequence dataset vP SD consists of a set of virus protein
records, vs1 , vs2 , . . . , vsn , where n is the size of the dataset. Each record
has a unique id, virus host, time, location, and the protein sequence. The
virus sequences are preprocessed by a multiple sequence alignment so that
all sequences have identical number of positions where each position is an
amino acid or a gap, denoted as “-” (see Table 1.1).
time
1996
NB(vs1)={vs2,vs3}
NB(vs2)={vs3,vs5}
NB(vs3)={vs4}
NB(vs4)={vs5,vs6,vs7}
1991
NB(vs5)={vs6,vs8}
NB(vs7)={vs8}
vs6
vs7
vs4
vs8
1986
vs3
...
vs5
X
vs2
ξ
vs1
γ
Y
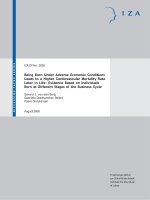
Figure 3.1: Spatio-temporal representation of the viruses in Table 1.1.
Suppose we have two virus sequences vs and vs′ that are near in space
and time. We say that vs′ is in the neighbourhood of vs, denoted by vs′
19
PRELIMINARIES AND DEFINITIONS
20
∈ N B(vs). Then vs mutates to vs′ if we can find a transformation that
maps vs to vs′ . Consider the two virus sequences vs1 and vs2 in Figure 3.1.
We observe that vs1 and vs2 are within the same cylinder indicating they
are near in space and time. Also, we can transform vs1 to vs2 by changing
A,P ,T ,N to D,S,Y ,T at positions 1,11,13,17 in order. Hence, we say vs1
mutates to vs2 .
Definition Let ci to be the i-th character of sequence vs and c′i to be the
i-th character of sequence vs′ . vs is said to point mutate or 1-mutate to
vs′ , if and only if vs′ ∈ N B(vs) and there exists p ∈ [1, n] such that cp ̸= c′p
but for all i ̸= p, ci = c′i . We denote the point mutation at position p as
⟨p, cp → c′p ⟩. Moreover, the virus sequence pair,(vs, vs′ ), is said to support
the point-mutation.
We denote a set of k point mutations as M = {< p1 : cp1 → c′p1 >, < p2 :
cp2 → c′p2 > · · · < pk : cpk → c′pk >}. The set of positions where the point
mutations occur is given by P os = {p1 , p2 , · · · , pk }. A virus sequence pair
(vsi , vsj ) is said to support M if vsj ∈ N B(vsi ), and ∀ p ∈ P os, cp ∈ vsi
and c′p ∈ vsj .
For example, given a virus sequence vs = ACDE and another sequence
′
vs = ARDF and vs′ ∈ N B(vs). Suppose M = {< 2 : C → R >, < 4 : E →
F >} with P os = {2, 4}. Then (vs, vs′ ) supports M .
Definition Given a set of virus pairs (vsi , vsj ) that support M , let V S[i]
be the set of distinct vsi and V S[j] be the set of distinct vsj . Then
Support(M ) = min(|V S[i]|, |V S[j]|)
Definition Let V P airsp be the set of virus pairs that support the point
mutation at position p in M . We define the mutation significance of M as
follows:
Support(M )
Signif icance(M ) =
maxp∈P os (|V P airsp |)
PRELIMINARIES AND DEFINITIONS
21
The Signif icance measure indicates the likelihood of M occurring with
respect to the individual point mutations. A value close to 1 implies that the
likelihood of M occurring is high.
For example, in Figure 3.1, we have a set of 2 point mutations
M = {< 1 : A → D >, < 11 : P → S >}
The set of virus pairs that support M is {(vs1 , vs2 ), (vs1 , vs3 )}. Then
V S[i] = {vs1 } and V S[j] = {vs2 , vs3 }. We have
Support(M ) = min(|V S[i]|, |V S[j]|)
= min(1, 2) = 1
In order to calculate Signif icance(M ), we first need to compute the
sets of virus pairs that support the point mutations at positions 1 and
11 respectively. We have V P air1 = {(vs1 , vs2 ), (vs1 , vs3 ), (vs7 , vs8 )} and
V P air11 = {(vs1 , vs2 ) , (vs1 , vs3 ) , (vs4 , vs6 ) , (vs4 , vs7 ) , (vs5 , vs6 )}. Then
Support(M )
max(|V P air1 |, |V P air11 |)
1
=
max(3, 5)
= 0.2
Signif icance(M ) =
Definition Suppose we have a set of k point mutations M = {< p1 : cp1 →
c′p1 >, < p2 : cp2 → c′p2 > · · · < pk : cpk → c′pk >} with P os = (p1 , p2 ,. . . , pk ).
For ∀ pi ∈ P os, if (cpi , c′pi ) ∈ M , we can get (cpi , c′pi ) ∈ M ′ (another set of k
point mutations). Then M is the sub k point mutations of M ′ , denoted as
M ⊑ M ′.
For example, a set of 2 point mutations M = {< 1 : C → R >, < 3 :
E → F >} is a sub k point mutations of a set of 3 point mutations M ′ =
{< 1 : C → R >, < 3 : E → F >, < 6 : G → H >}.
To capture the sequence of mutations that happen over multiple time
points, we define the concept of a mutation chain.
PRELIMINARIES AND DEFINITIONS
22
Definition A mutation chain M C of length (T + 1) is given by M1 →
M2 → . . . Mi → . . . MT , where Mi is the set of k point mutations at the ith
time point. The P os of M C denoted its mutation positions set. M1 . . . Mi
and M C, where i ∈ [1, T ], have the same P os; and for each sequence pair
(vsj , vsh ) ∈ the set of virus pairs that supports Mi , there must be sequence
pair (vsh , vsq ) ∈ the set of virus pairs that supports M(i+1) , where j ̸= h, h
̸= q, j, h, q ∈ [1, n], vsh ∈ N B(vsj ) and vsq ∈ N B(vsh ).
A chain of sequences, vs1 → vs2 → vs3 → . . . →vs(T +1) , is said to support
the mutation chain M C, if (vsi , vsi+1 ) supports the Mi , i ∈ [1, T ].
In Figure 3.1, we can see that vs7 ∈ N B(vs4 ) and vs8 ∈ N B(vs7 ). The
chain of sequences vs4 → vs7 → vs8 is said to support the mutation chain
M C = M1 → M2 , where M1 = {< 1 : D → A >, < 13 : Y → T >}, M2 =
{< 1 : A → D >, < 13 : T → Y >} (or M C = < 1, 13 : DY → AT → DY >
in short).
Definition A mutation chain M C = M1 → M2 → · · · → MT with P os,
if M C is a sub mutation chain of another mutation chain M C ′ = M1′ →
M2′ → · · · → MT′ ′ with P os′ , denoted as M C ⊑ M C ′ , if and only if
1) P os ⊆ P os′ ; T ≤ T ′ .
′
2) ∀i ∈ [1, T ], ∃r ∈ [0, T ′ − T ] such that Mi ⊑ M(i+r)
.
Specifically, M C = M C ′ if M C ⊑ M C ′ and M C ′ ⊑ M C.
Figure 3.2 shows a mutation chain with |P os|=5, and another mutation
chain with |P os| = 9, and the first chain is a sub mutation chain of the
second one.
Definition The support of M C = M1 → M2 → . . . Mi → . . . MT , is defined
as
Support(M C) = mini∈[1,T ] {Support(Mi )}
Definition The mutation significant of M C = M1 → M2 → . . . Mi →
. . . MT , is defined as
Signif icance(M C) = mini∈[1,T ] {Signif icance(Mi )}
PRELIMINARIES AND DEFINITIONS
vs1
23
1
2
52 53
98
A
R
I
Y
D
M
F
P
S
W
Q
H
D
V
C
NB
vs2
NB
vs3
(a) One mutation chain
vs1
1
2
3
50
51
52
53
98
99
A
R
D
G
H
I
Y
D
C
M
F
A
S
W
P
S
W
K
Q
H
E
T
M
D
V
C
E
T
S
G
I
Y
A
F
K
A
NB
vs2
NB
vs3
NB
vs4
(b) Another mutation chain
Figure 3.2: Examples of mutation chains. The mutation chain in (a) is a sub
mutation chain of the mutation chain in (b)
For example, in Figure 3.1, we have a mutation chain M C = M1 → M2 ,
where M1 = {< 1 : D → A >, < 13 : Y → T >}, M2 = {< 1 : A → D >, <
13 : T → Y >}.
Support(M C) = min(Support(M1 ), Support(M2 ))
= min(1, 2) = 1
,where we can easily calculate that Support(M1 )=1 and Support(M2 )=2.
In the same reason, we can compute the Signif icance(M1 ) and Signif icance(M2 ),
and they are 0.25, 0.4 in order, then
Signif icance(M C) = min(Signif icance(M1 ), Signif icance(M2 ))
= min(0.25, 0.4) = 0.25
Both Support(M C) and Signif icance(M C) satisfy anti-monotone property and the proof about Signif icance(M C) is as follows: (Support(M C) is
PRELIMINARIES AND DEFINITIONS
24
obviously satisfiable)
Lemma 3.0.1. Anti-monotonicity Property. Given two mutation chains
M C ⊑ M C ′ , Signif icance(M C ′ ) ≤ Signif icance(M C).
Proof: Given a mutation chain M C= M1 → M2 → . . . Mi · · · → . . . MT
with P os and another mutation chain M C ′ = M1′ → M2′ → . . . Mi′ · · · →
. . . MT′ with P os′ . Without loss of generality, M C ⊑ M C ′ , so that 1) P os ⊆
′
P os′ 2) ∀ i ∈ [1, T ] ∃ r ∈ [0, T ′ − T ] such that Mi ⊑ M(i+r)
. By definition
of sub mutation chain, if a sequence chain vs1 → vs2 → vs3 → . . . → vsT
supports M C ′ , it must also support M C. So ∀ 1≤i
=
≤
′
Signif icance(M(i+r)
)
′
Support(M(r+i) )
′
maxq∈P os′ (|V P airsq in M(i+r)
|)
′
Support(M(r+i)
)
′
maxq∈P os (|V P airsq in M(i+r)
)|)
Support(Mi )
maxq∈P os (|V P airsq in Mi |)
= Signif icance(Mi )
≤
Signif icance(M C ′ )
= min{Signif icance(Mt′ ), . . . , Signif icance(MT′ ′ )}
′
′
≤ min{Signif icance(M(1+r)
), . . . , Signif icance(M(T
+r) )}
≤ min{Signif icance(M1 ), . . . , Signif icance(MT )}
= Signif icance(M C)
Given a mutation significance threshold min Signif icance and a support threshold min Support, a mutation chain M C is valid if and only if
Support(M C) ≥ min Support, and Signif icance(M C) ≥ min Signif icance.
Chapter 4
Mining Non-Contiguous
Mutation Chains
Algorithm 1:
vPSD
Virus sequences
PointMutation tree
construction
PointMutation tree
Algorithm 2:
ptMutationTree-Miner
The completely valid sets
of K point mutations
The complete set
of valid mutation
chains
Procedure:
Algorithm 3:
ChainMiner
ptMutationChain-Miner
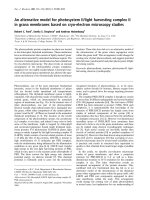
Figure 4.1: The mutation chains mining framework.
Figure 4.1 shows the proposed framework for mining non-contiguous mutation chains. Given the virus protein sequence dataset vP SD, we first
construct the PointMutation tree which keeps track of the complete sets of k
point mutations. To obtain the valid sets of k point mutations, we traverse
the constructed PointMutation tree recursively, generating the sets of k point
mutations that are both frequent and significant by concatenating the suffix.
Having obtained the valid sets of k point mutations, we initiate procedure
25