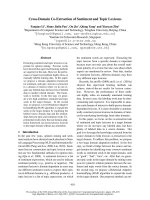
Cross border equity investments of sovereign wealth funds a performance comparison with hedge funds
Bạn đang xem bản rút gọn của tài liệu. Xem và tải ngay bản đầy đủ của tài liệu tại đây (1.44 MB, 109 trang )
CROSS-BORDER
EQUITY
INVESTMENTS
OF
SOVEREIGN WEALTH FUNDS – A PERFORMANCE
COMPARISON WITH HEDGE FUNDS
NICOLE HAGEN
A THESIS SUBMITTED
FOR THE DEGREE OF MASTER OF SCIENCE
DEPARTMENT OF FINANCE
BUSINESS SCHOOL
NATIONAL UNIVERSITY OF SINGAPORE
2011
1
Table of Contents
Acknowledgements
I would like to express my appreciation to my supervisors Professor Ruth Tan and
Professor Fong Wai Mun for their time, patience, guidance and advice. The thesis
would not have been possible without them.
Special thanks goes to my parents and Emile Abou Mansour for their endless support
during my studies at NUS.
I also want to show my gratitude to my colleague Cheng Si for giving me advice on
SAS programming as well as my colleagues Yingshi Jin and Weiqi Zhang for their
continuous support during the time of writing the thesis.
i
Summary
This paper examines 207 cross-border investments by sovereign wealth funds (SWFs)
and 144 cross-border investments by hedge funds (HFs) in publicly traded companies
between January 1990 and December 2009. We find that both SWFs and HFs tend to
invest in companies that displayed positive abnormal returns in the year prior to the
investment announcement. Results show that both cross-border SWF and HF
investments are associated with significant positive abnormal returns in the target
companies during the 3-day announcement window. Reactions are similar for SWFs
and HFs as the announcement period abnormal returns of the two samples are not
significantly different. In the first year following the investment, SWF investments
display negative mean cumulative market-adjusted returns, whereas HF investments
display mean cumulative market-adjusted returns not significantly different from
zero. Only in later years (from year 2 onwards for the HF sample and in year 5 for the
SWF sample) are mean cumulative market-adjusted returns positive. The results for
the HF sample are significantly higher than for the SWF sample from year 2 onwards,
indicating that over the very long-run, HF investments outperform SWF investments
on average. We also analyze the crisis period of 2007 and 2008 and find that mean
announcement period abnormal returns of SWF investments are significantly higher
during these years. HF investments do not display significantly higher announcement
period abnormal returns during the crisis period of 2007 and 2008.
ii
Table of Contents
Table of Contents
Acknowledgements ........................................................................................................ i
Summary ....................................................................................................................... ii
Table of Contents ......................................................................................................... iii
List of Tables ................................................................................................................ v
List of Figures ............................................................................................................. vii
Chapter One: Introduction ............................................................................................ 1
1.1 Overview ....................................................................................................... 1
1.2 Motivation and Objectives ............................................................................ 1
1.3 Contribution and Findings ............................................................................ 3
1.4 Conclusion .................................................................................................... 6
Chapter Two: Literature Review .................................................................................. 7
2.1 Introduction ................................................................................................... 7
2.2 A brief overview of Sovereign Wealth Funds .............................................. 7
2.3 Sovereign Wealth Fund Literature ................................................................ 9
2.4 Hedge Fund Literature ................................................................................ 17
2.5 Conclusion .................................................................................................. 21
Chapter Three: Data .................................................................................................... 22
3.1 Introduction ................................................................................................. 22
3.2 Selection Criteria and Data Sources for Sovereign Wealth Funds ............. 22
3.3 Selection Criteria and Data Sources for Hedge Funds................................ 24
3.4 Other Data Sources ..................................................................................... 25
3.5 Conclusion .................................................................................................. 26
Chapter Four: Hypotheses and Methodology Design ................................................. 27
iii
Table of Contents
4.1 Introduction ................................................................................................. 27
4.2 Test Hypotheses .......................................................................................... 27
4.3 Announcement Period Abnormal Return.................................................... 32
4.4 Long-Run Abnormal Return ...................................................................... 35
4.5 Cross-Sectional Regressions ....................................................................... 36
4.6 Conclusion .................................................................................................. 38
Chapter 5: Empirical Findings and Analysis .............................................................. 39
5.1 Introduction ................................................................................................. 39
5.2 Summary Statistics...................................................................................... 39
5.3 Announcement Period Abnormal Return.................................................... 46
5.4 Long-Run Abnormal Returns ..................................................................... 51
5.5 Analysis of Investments during the crisis years 2007 and 2008 ................. 59
5.6 Summary Statistics of Target Firm Characteristics .................................... 68
5.7 Cross-Sectional Regressions ....................................................................... 70
5.8 Conclusion .................................................................................................. 91
Chapter 6: Conclusion................................................................................................. 92
6.1 Summary ..................................................................................................... 92
6.2 Limitations to this study.............................................. ……………………93
6.3 Motivation for future research .................................... ……………………94
Appendix A ................................................................................................................. 95
Appendix B ................................................................................. ……………………97
References ................................................................................. ……………………100
iv
List of Tables
Table 1: The largest SWFs by AUM as of September 2010 ........................................ 8
Table 2: List of explanatory variables ........................................................................ 37
Table 3: Annual distribution of cross-border investments .......................................... 40
Table 4: Investment activities ..................................................................................... 42
Table 5: Target countries ............................................................................................ 44
Table 6: Target industries ........................................................................................... 45
Table 7: CARs for the [-1, +1] announcement window.............................................. 47
Table 8: CMARs for the pre-announcement window [-365, -2] ................................ 52
Table 9: CMARs for the post-announcement windows .............................................. 54
Table 10: Test results for difference tests between long-run CMARs of SWF
and HF investments..................................................................................................... 57
Table 11: Test results for difference tests between long-run CMARs of HF
investments (Investor Group vs. Excl. Investor Group) ............................................. 58
Table 12: CARs for the [-1, +1] announcement window (crisis years
2007 and 2008 separately) .......................................................................................... 61
Table 13: SWF investments in financial companies and non-financial companies.... 64
Table 14: SWF investments in financial companies and non-financial companies
during 2007 and 2008 ................................................................................................. 66
Table 15: Summary statistics ...................................................................................... 69
Table 16: Cross-sectional regressions on 3-day CAR [-1, +1] for SWF investments 71
Table 17: Cross-sectional regressions on 3-day CAR [-1, +1] for HF investments ... 72
Table 18: Pooled sample regression on 3-day CAR [-1, +1] for SWF and HF
investments ................................................................................................................. 78
Table 19: Cross-sectional long-run regressions for SWF investments ....................... 80
Table 20: Cross-sectional long-run regressions for HF investments .......................... 82
v
List of Tables
Table 21: Pooled sample regression on long-run CMARs for SWF and HF
investments ................................................................................................................. 88
Table A1: Truman Scoreboard.................................................................................... 95
Table A2: Linaburg-Maduell Transparency Index (LMTI) ........................................ 96
Table B1: Fama and French 17 industries definition .................................................. 97
vi
List of Tables
List of Figures
Figures 1 and 2: Frequency distribution of CARs for the [-1, +1] announcement
window.........................................................................................................................46
Figures 3 and 4: Frequency distribution of CMARs for the [-365, -2] preannouncement window ............................................................................................... 53
Figure 5 and 6: Frequency distribution of CMARs for the [+2, +365] postannouncement window ............................................................................................... 59
vii
Chapter One
Introduction
1.1 Overview
Section 1.2 provides the motivation for this paper and lists its main objectives.
Section 1.3 highlights the contribution of the paper and its major findings. Section 1.4
concludes the chapter.
1.2 Motivation and Objectives
Sovereign Wealth Funds (SWFs) have gained in importance in the last couple of
years due to an increase in their capital market activities. The growing SWF literature
can be classified into two streams (Bortolotti et al., 2009). The first stream focuses on
the effects on the valuation of the SWF target (for example, Bernstein et al., 2009;
Fernandes, 2011). These studies examine the impact of SWF investments on
valuation as measured by accounting variables. Fernandes (2011) finds that
companies with higher SWF ownership have higher valuation, better operating
performance and higher Tobin‟s Q. The second stream of literature focuses on the
price performance of the SWF target (Dewenter et al., 2010; Bortolotti et al., 2009;
Kotter and Lel, 2010). These studies not only examine the announcement period
abnormal returns that SWF investments generate, but also investigate long-run
market-adjusted returns in order to determine whether the target companies achieve
positive long-run market-adjusted returns in the years following the SWF investment.
Most of the studies find that SWF investments lead to positive announcement period
1
Chapter One: Introduction
abnormal returns. However, Bortolotti et al. (2009) finds negative market-adjusted
returns in the first two years following the SWF investment, suggesting that SWFs are
not active investors and do not create value through monitoring. The only 5-year
study is conducted by Dewenter et al. (2010). They report insignificant results after
the 1st year, but positive abnormal returns after year 3 and year 5.
This study will focus on the effects of SWF investments on the price performance of
the target companies. It adds to the existing literature in that it examines the crossborder equity investments of SWFs and compares them to the cross-border equity
investments of other institutional investors (in this case, Hedge Funds (HFs)) to see
whether the market values SWF investments differently than investments by other
institutional investors.
Some studies have explained the effects of HF investments on the price performance
of their target companies (Klein and Zur, 2009; Brav et al., 2008; Greenwood and
Schor, 2009). They analyze 13D filings1 of HFs and report positive announcement
period abnormal returns. Other studies have analyzed the long-run market-adjusted
returns. Greenwood and Schor (2009) report that long-run market-adjusted returns are
positive and significant if the HFs are involved in activities such as asset sales and
mergers. For other activities such as capital structure changes, corporate governance
and corporate strategy, the long-run returns are not significantly different from zero.
There are a few compelling arguments that make a comparison to HF investments
interesting. For example, Bortolotti et al. (2009) state that although SWFs are stateowned entities and therefore organized and managed differently than other investment
funds, “SWFs appear similar to HFs in that both are stand-alone, unregulated pools of
1
Investors are obliged to submit a 13D filing with the SEC within 10 days after acquiring at least 5 percent of a publicly
traded equity security with the stated intent to influence the policies of the firm.
2
Chapter One: Introduction
capital, managed by investment professionals and mandated (or at least allowed) to
purchase large ownership stakes in foreign companies.” In addition, they state: “A
natural question to ask is whether SWFs can and do achieve investment returns
similar to these [pension funds, mutual funds, and hedge funds] private-sector
institutional investors.” This is exactly the research question of this paper. The
financial press has also compared SWFs to HFs, mainly because of concerns due to
the lack of transparency2. The IMF stated in a 2007 New York Times article that “a
debate about the political risks and opportunities of SWFs, similar to the ongoing
debate about HFs is now developing”3. Avendaño and Santiso (2009) compared SWF
holdings to mutual fund holdings and reported that “the difference in equity
investments between SWFs and other institutional investors are less pronounced than
suspected.”, which further supports a comparison between SWF and institutional
investors such as HFs.
This paper will analyze both the short-term announcement period cumulative
abnormal returns (CARs) as well as the long-term cumulative market-adjusted returns
(CMARs). In addition, a separate analysis will be conducted on the financial crisis
years 2007 and 2008 to investigate the impact of SWF investments in financial and
non-financial companies during this period.
1.3 Contribution and Findings
We study a sample of 207 cross-border SWF investments and 144 cross-border HF
investments for the period from 1990 to 2009. We focus on cross-border investments
2
3
“Sovereign Wealth Funds: The New Hedge Fund?”, The New York Times, 1 August 2007
“The Rise of Sovereign Wealth Funds”, F&D, September 2007, Volume 44, Number 3
3
Chapter One: Introduction
to avoid problems where the SWFs may be deemed to be subjected to local influence
or political control. Also, we focus on transactions where the target (or its immediate
or ultimate parent) is listed as a public company so that stock market reactions can be
analyzed.
We find that in the 1-year period prior to the investment, the target companies of both
SWFs and HFs outperform their local benchmarks, suggesting that both SWFs and
HFs tend to invest in „outperformers‟. Both cross-border SWF investments and crossborder HF investments display statistically significant positive abnormal returns for
the 3-day [-1, +1] announcement window. Reactions are similar for SWFs and HFs as
the announcement period abnormal returns of the two samples are not significantly
different. We also divide the SWFs and HFs into subsamples to see whether certain
deal characteristics influence the results4. We find that the performance could not be
sustained and the target companies of SWFs display negative long-run cumulative
market-adjusted returns in the first year after the investments. For the HF sample, the
mean cumulative market-adjusted returns of the target companies are not significantly
different from zero after the first year. However, the results for the two samples are
not significantly different, indicating that HF investments are not able to outperform
SWF investments over that time period. Only in later years (from year 2 onwards for
the HF sample and in year 5 for the SWF sample) are mean cumulative marketadjusted returns positive. The mean cumulative market-adjusted return results for the
4
For the SWF sample, the subsamples „Direct‟ and “Subsidiary‟ as well as „Direct Acquirer‟ and „Indirect Acquirer‟ are
analyzed separately. For the HF sample, the subsamples „Direct‟ and „Subsidiary‟ as well as „Investor Group‟ and
„Excluding Investor Group‟ are analyzed separately. „Direct‟ refers to transactions in which the target company is
publicly traded, „Subsidiary‟ refers to transactions in which the target company is not publicly traded, but a subsidiary of
a publicly traded company. „Direct Acquirer‟ refers to transactions in which the SWF is the direct acquirer, „Indirect
Acquirer‟ refers to transactions in which the SWF is the immediate or ultimate parent of the acquirer. „Investor Group‟
refers to transactions where two or more institutional investors are involved, whereby at least one HF is included.
„Excluding Investor Group‟ refers to transactions where only the HF is listed as acquirer.
4
Chapter One: Introduction
HF sample are significantly higher than for the SWF sample from year 2 onwards,
indicating that over the very long-run, HF investments outperform SWF investments.
We also examine the crisis years of 2007 and 2008 and find that SWF Investments
display higher mean announcement period abnormal returns during these two years
than during other years, suggesting that the market valued SWF investments higher
during that time. HF investments do not display significantly higher announcement
period abnormal returns during the crisis years of 2007 and 2008. We analyze SWF
investments in financial companies during the crisis years separately, but their
announcement period abnormal returns are not significantly different from
announcement period abnormal returns of SWF investments in non-financial
companies during the crisis period, despite the precarious situations of many financial
companies during that time.
For the purpose of this analysis, we focus on the interpretation of the mean results.
However, one possible concern is that the sample sizes for both cross-border SWF
investments and cross-border HF investments are small and that results may be
influenced by individual transactions with extreme values. For such cases the median
results are more stable than the mean results, so we also report the median results and
apply tests to see whether they are statistically significant. We also winsorize the
sample at the 1 percent and 99 percent level to see whether results are different.
Another concern of the small sample sizes is that the samples may not be normally
distributed. Non-parametric tests are conducted to provide robustness.
5
Chapter One: Introduction
1.4 Conclusion
This introduction provides an overview of the SWF and HF literature and highlights
the contribution of the study to the existing literature. It is the first paper to directly
compare the cross-border equity investments of SWFs with the cross-border equity
investments of other institutional investors (HFs). In addition, it analyzes the
investments of SWFs and HFs during the financial crisis years of 2007 and 2008. The
main findings of the paper are highlighted in this chapter.
The rest of the paper is organized as follows. Chapter 2 reviews the existing literature
on SWFs and on HFs. Chapter 3 describes the data selection process as well as the
data sources. Chapter 4 introduces the test hypotheses and describes the methodology
design. Chapter 5 presents the empirical findings. Chapter 6 concludes the paper.
6
Chapter Two
Literature Review
2.1 Introduction
Section 2.2 provides a brief overview of Sovereign Wealth Funds (SWFs). Section
2.3 discusses some of the research papers on SWFs and their main findings. Section
2.4 reviews some of the research papers on Hedge Funds (HFs) and their main
findings. Section 2.5 concludes the chapter.
2.2 A brief overview of Sovereign Wealth Funds
Although Sovereign Wealth Funds (SWFs)5 are not new to financial markets, it has
only been in recent years that they have become large global players. Many of these
SWFs are newly set up. For example, Kazakhstan, China, South Korea, Qatar,
Australia, Russia all set up their SWFs within the last ten years - see Table 1 for
details. Currently the total number of SWFs is around 40 funds. According to the
SWF Institute, assets under management (AUM) reached over USD 3.9 trillion in
September 2010 and are expected to reach USD 10 trillion by 2015 6. The biggest
SWFs are located in Asia and the Middle East, accounting for 38 percent and 37
percent of SWF market size, respectively (18 percent in Europe, 3 percent in Africa, 2
5
There are controversies about the definition of a Sovereign Wealth Fund. The International Working Group of
Sovereign Wealth Funds (IWG) defines SWFs as “special-purpose investment funds or arrangements that are owned by
the general government. Created by the general government for macroeconomic purposes, SWFs hold, manage, or
administer assets to achieve financial objectives, and employ a set of investment strategies that include investing in
foreign financial assets. SWFs have diverse legal, institutional, and governance structures. They are a heterogeneous
group, comprising fiscal stabilization funds, savings funds, reserve investment corporations, development funds, and
pension reserve funds without explicit pension liabilities”. (Source: Sovereign Wealth Funds - Generally Accepted
Principles
and
Practices
“Santiago
Principles”,
IWG,
October
2008,
/>6
“SWFs and foreign investment policies –an update”, Deutsche Bank Research, October 22, 2008
7
Chapter Two: Literature Review
percent in America)7. In comparison to other investors, SWFs are large and almost
the size of the combined hedge fund (HF) and private equity (PE) industry.
Individually, the largest SWFs are comparable in scale to the world‟s largest PE funds
and HFs8.
The SWF Institute publishes a list of the largest SWFs by AUM. Table 1 shows the
20 largest SWFs as of September 2010.
Table 1: The largest SWFs by AUM as of September 2010
This table lists the 20 largest SWFs by assets under management (AUM) as published by the SWF Institute as of
September 2010.
Country
Fund Name
UAE- Abu Dhabi
Norway
Saudi Arabia
China
China
Singapore
China-HK SAR
Kuwait
China
Russia
Singapore
Qatar
Libya
Australia
Algeria
Kazakhstan
US – Alaska
Ireland
South Korea
Brunei
Abu Dhabi Investment Authority
Government Pension Fund Global
SAMA Foreign Holdings
SAFE Investment Company
China Investment Corporation
Government of Singapore Investment Corp.
HKMA Investment Portfolio
Kuwait Investment Authority
National Social Security Fund
National Welfare Fund
Temasek Holdings
Qatar Investment Authority
Libyan Investment Authority
Australian Future Fund
Revenue Regulation Fund
Kazakhstan National Fund
Alaska Permanent Fund
National Pensions Reserve Fund
Korea Investment Corporation
Brunei Investment Agency
Assets $ Billion
Inception
Origin
LMTI9
$627
$512
$415
$347.1
$332.4
$247.5
$227.6
$202.8
$146.5
$142.5
$133
$85
$70
$59.1
$56.7
$38
$35.5
$33
$30.3
$30
1976
1990
n/a
1997
2007
1981
1993
1953
2000
2008
1974
2005
2006
2004
2000
2000
1976
2001
2005
1983
Oil
Oil
Oil
Non-Commodity
Non-Commodity
Non-Commodity
Non-Commodity
Oil
Non-Commodity
Oil
Non-Commodity
Oil
Oil
Non-Commodity
Oil
Oil
Oil
Non-Commodity
Non-Commodity
Oil
3
10
2
2
6
6
8
6
5
5
10
5
2
9
1
6
10
10
9
1
The main sources of funding for SWFs include oil revenues, government savings and
foreign exchange reserves. As the table shows, some SWFs, like the Kuwait
Investment Authority, have a long history and go back to the 1950s.
With the emergence of SWFs as large global financial players10, policy issues arise.
The size of the funds as well as the likelihood of further growth, combined with the
7
Source: Sovereign Wealth Fund Institute (www.swfinstitute.org), as of December 2009
As of 2006, SWFs managed USD 3 trillion in global financial assets, versus HFs managing USD 1.9 trillion and Private
Equity managing USD 1.3 trillion. (Source: Butt el al. (2008)).
9
LMTI stands for the Linaburg-Maduell Transparency Index. The Sovereign Wealth Fund Institute has created the LMTI
and publishes the transparency rating of individual SWFs on a quarterly basis. The index ranges from 0 to 10, whereas 0
refers to being non-transparent and 10 being very transparent. For details, please refer to the homepage of the Sovereign
Wealth Fund Institute (www.swfinstitute.org).
10
Fernandes (2011) reports that traditionally SWFs used to invest in debt instruments, but low returns have prompted
them to start to invest in equities in recent years.
8
8
Chapter Two: Literature Review
potential to make strategic investments and the lack of transparency have led to
increasing concerns worldwide11.
Due to this development, academic research has started to pay more attention to
SWFs. However, despite the increasing interest in this field, the number of research
papers on SWFs is still comparatively low. This can be explained by the lack of data
and the lack of transparency in most SWFs12. Nevertheless, with the introduction of
the Santiago Principles13, some SWFs have started to improve their transparency and
disclose best practices. Thus we expect that more research will be dedicated to this
area going forward.
2.3 Sovereign Wealth Fund Literature
There are several studies that examined the stock price reactions on announcements
of investments by sovereign wealth funds.
Dewenter et al. (2010) analyze a sample of 202 transactions between January 1987
and April 2008. They find that the average cumulative abnormal return (CAR) around
the 3-day announcement window [-1, +1] is significantly positive (+1.5 percent) for
investments and significantly negative (-1.4 percent) for divestments14. Furthermore,
11
For details, see: “State Capitalism: The Rise of Sovereign Wealth Funds”, by Gerard Lyons, Journal of Management
Research, 2007, Volume 7, Number 3
12
For details, see: “The impact of Sovereign Wealth Funds on global financial markets” (Beck and Fidora, 2008). The
authors state that “Using the corporate governance index for SWFs proposed by Truman (2007) as a yardstick for
transparency, the seven most non-transparent SWFs – which basically do not publish any information on their portfolios
– account for almost half of all SWFs holdings.”
13
The Santiago Principles were introduced in October 2008 by the International Working Group of Sovereign Wealth
Funds (IWG). The IWG comprises 26 IMF member countries with SWFs. The report summarizes the generally accepted
principles and practices (GAPP) which cover the areas of 1) legal framework, objectives, and coordination with
macroeconomic policies, 2) institutional framework and governance structure, 3) investment framework and risk
management framework. The GAPP contain 24 principles. The report can be found at />14
Dewenter et al. (2010) distinguish between a „full sample‟ and a „clean sample‟. The clean sample only contains
transaction announcements that do not have other concurrent announcements that might influence the stock price of the
9
Chapter Two: Literature Review
they find that the 3-day CAR of direct investments is greater than the 3-day CAR of
subsidiary investments15. Also, stock price reactions are a non-monotonic function of
transaction size. For investments, abnormal returns initially increase with the
percentage stake acquired, reach a maximum and then decline. They also conduct a
long-run abnormal return study and find that target firms display mean cumulative
market-adjusted returns (CMARs) insignificantly different from zero in the year
following the announcement date. However, mean CMARs turn positive over the 3year and 5-year period16. Furthermore, they analyze SWF activity after the investment
in the target firm and find that some of these investments are followed by SWF
monitoring, lobbying, or tunneling.
Bortolotti et al. (2009) analyze a sample of 802 SWF investments during the time
period from May 1985 to November 2009. They report that SWFs prefer to invest in
large and profitable growth firms and that these firms are usually headquartered in an
OECD country. Announcements of SWF investments yield average abnormal
cumulative returns over a 3-day announcement window [-1, +1] of 1.25 percent
[median of 0.17 percent]. The average abnormal cumulative returns increase to 2.91
percent [median of 0.37 percent] if Norway is excluded17. However, when looking at
performance in the following two years, they find that target firm performances
target company. For the clean sample, the average 3-day CAR for investments is slightly higher (1.7 percent).
Subsequent studies of subsamples are based on the clean sample.
15
Whereas „direct investments‟ relate to transactions where the target company is a publicly traded firm, „subsidiary
investments‟ relate to transactions where the target firm is a subsidiary of a publicly traded firm.
16
Dewenter et al. (2010) only report insignificant results after the 1 st year for their CMAR results. But they also calculate
buy-and-hold abnormal returns (BHARs) which show significantly negative median abnormal returns. Also, the 3-year
CMARs are only significant under the t-statistic, but not under the Wilcoxon signed rank test. Only the 5-year CMARs
are significant under both the t-statistic and the Wilcoxon signed rank test.
17
Although Norway‟s Government Pension Fund-Global (GPFG) ranks amongst the most transparent SWFs, it is not
included in all working papers. Furthermore, studies which include the GPFG often analyze the fund separately. The
reason is that because the Norway fund “always accumulates small stakes in listed companies through open market share
purchases, its investments are rarely documented in the press and are almost never recorded as direct share acquisition by
SDC” (Bortolotti et al., 2009). However, it annually publishes a list of all the equity holdings on its homepage. The
GPFG will not be included in this study as it is not included in the SDC database and because it generally does not
purchase more than 1 percent of outstanding shares of a company.
10
Chapter Two: Literature Review
deteriorate and SWF investments underperform relative to local market indices. If
Norway is excluded, the average abnormal cumulative return is -2.63 percent [median
of -4.62 percent] for the 6-month period, -4.32 percent [median of -10.36 percent] for
the 1-year period, -3.09 percent [median of -13.55 percent] for the 2-year period and
3.72 percent [median of -9.30 percent] for the 3-year period. Results are significant
for the first two years. The authors find that long-run abnormal return decreases as the
stake that the SWF acquires in the target company increases. Long-run abnormal
return also decreases if the investment is direct (in contrast to investments through
subsidiaries)18, and if the SWF takes a seat on the board of directors of the target
company. The underperformance also worsens for investments in foreign target firms.
These findings are all in line with their „Constrained Foreign Investor Hypothesis‟19
and lead them to conclude that the poor long-term performance of SWFs cannot be
explained by poor stock picking alone, but that poor monitoring by SWFs is one of
the reasons why SWF investments do not lead to increases in the firm valuations of
the target companies. When they analyze board compositions of target firms, they
find that SWFs acquire seats on only 14.9 percent of the boards of the target
companies (26.8 percent if Norway is excluded). The likelihood that SWFs acquire a
seat in the board is significantly higher if the target company is a domestic company
rather than a foreign company.
18
Bortolotti et al. (2009) report that subsidiaries of the SWF are more likely to take seats on the boards of target
companies in foreign deals than the SWF itself. They argue that SWFs choose subsidiaries to invest in companies rather
than to invest directly because of the „low-visibility‟ of subsidiaries.
19
Bortolotti et al. (2009) argue that SWFs are constrained foreign investors because “SWFs seem to face numerous,
severe restrictions on the monitoring and/or disciplinary role that they can realistically play, at least regarding their crossborder investments in listed companies. This is largely because any posture they take other than being purely passive
investors might generate political pressure or a regulatory backlash from recipient-country governments.” Because of
these restrictions, the authors expect that “SWFs will not make effective monitors of investee company managers and
will not create value in the long term”. They also argue that this lack of monitoring might “even exacerbate conflicts
between managers and minority shareholders by freeing managers from effective oversight”, a reason why larger stake
acquisitions lead to lower abnormal long-run returns.
11
Chapter Two: Literature Review
Fernandes (2011) investigates the effects of SWF holdings on the firm value of target
companies. He analyzes SWF holdings in more than 8,000 firms in 58 countries
during the time period from 2002 to 2007 and compares them to a control group20. He
reports a positive relationship between SWF holdings and firm values of target
companies (as measured by Tobin‟s Q21) as well as the existence of a premium for
firms in which SWFs hold a stake (after controlling for institutional ownership),
suggesting that SWF holdings are viewed positively by the market. In addition, he
reports a positive relationship between SWF investments and operating performance
of the target companies after the investment took place (as measured by ROA (return
on assets), ROE (return on equity), and higher operating returns). He states that these
results are not consistent with the idea that SWF invest with hidden political agendas
or try to extract private benefits of control22. He analyses different channels of how
SWFs may impact the firms they invest in and finds that after large SWF investments,
the firms are better monitored, and have better access to capital and foreign products
markets23.
Knill et al. (2009) investigate whether SWF investments are destabilizing24. They
analyze a sample of 232 acquisitions and 140 divestments from January 1990 to
20
The control group consists of all the firms in the Datastream/Worldscope database for the years 2002 through 2007.
Tobin‟s Q is frequently used as a measure of firm value. Fernandes (2011) calculates Tobin‟s Q as the book value of
total assets plus the market value of equity minus the book value of equity divided by total assets. In his analysis, he
regresses Tobin‟s Q on a number of variables such as Size, Industry, Leverage, Cash, Investment Opportunities, etc.
22
Fernandes (2011) states that SWFs may use cross-border investments to help the economic development in their home
country (for example, by trying to pursuade the target company to build off-shore facilities). Influencing the target
company‟s strategy and investment decisions might come at the expense of the performance and value of the target firm.
On the other hand, SWFs may be able to influence government decisions in favor of the target firm, thereby increasing
its firm value. However, his results are not consistent with the idea of SWFs following political agendas.
23
Fernandes (2011) uses CEO turnover as a measure of how well a company is monitored. He finds that after a SWF
investment, the CEO turnover rate is significantly higher than in the control group. He also finds that SWF average
turnover is low (7% per year), suggesting that SWFs are long-term investors and that this “raises the possibility that
SWFs… may provide capital for future funding needs and therefore reduce the uncertainty regarding the company‟s
future financing ability”. Using foreign sales as a proxy for product market impact, he finds that the percentage of foreign
sales increases significantly after a SWF investment.
24
Knill et al. (2010) describe an event as destabilizing if there is a significant decline in returns of the target company
and the risk-to-return relation of the target company deteriorates.
21
12
Chapter Two: Literature Review
December 2009. They find cumulative abnormal returns (CARs) over the trading
days -1 to 0 of 1.37 percent for SWF acquisitions (1.17 percent for SWF
divestments). Using a difference of means test, they find that the benchmark-adjusted
returns are lower in the year following the acquisition by the SWF. Also, volatility
decreases over time, however, the decrease is not sufficient to compensate investors
for risk in the same manner as before the investment. They also investigate Sharpe
and Appraisal ratios and find a decrease in these ratios in the years after the SWF
investment, an indication that there is a decrease in risk compensation. They conclude
that their results support the argument that SWF investments are destabilizing.
Chhaochharia and Laeven (2009) investigate equity investments of the following four
SWFs: Government Pension Fund of Norway, National Pensions Reserve Fund of
Ireland, Alaska Permanent Fund, and New Zealand Superannuation Fund. The total
sample, measured until the end of 2007, consists of 10,282 global equity investments
from these four SWFs25. They find that these SWFs prefer to invest in countries with
common cultural traits26. Compared to other institutional investors, they find that the
cultural bias of SWF investment is particularly pronounced. Furthermore, SWFs
display significant industry bias and tend to invest more in large-cap stocks.
Bernstein et al. (2009) examine private equity investment strategies of SWFs and
analyze a total sample size of 2,662 transactions during the time period from January
1984 to December 2007. They report that SWFs seem to engage in „trend chasing‟.
That is, SWFs tend to invest in the companies that are located in the SWF‟s home
country when equity prices at home are already high and domestic equities are
25
The authors only include these four SWFs because coverage for all the other SWFs is incomplete and they are
concerned that incomplete coverage will bias their results.
26
The authors define closeness in language and religion as cultural proximity variables that should indicate whether there
exists a similarity in culture between the home country of the SWF and the country in which it decides to invest.
13
Chapter Two: Literature Review
expensive compared to foreign equities (in terms of P/E) and they tend to invest in
companies located abroad when foreign equities are expensive compared to domestic
equities. Furthermore, they analyze the governance structures of SWFs and try to
determine whether investment behavior of the SWFs changes depending on whether
politicians and/or external managers are involved in the decision making process.
They find that when politicians are involved, it is more likely that the SWF will invest
in companies that are located in the SWF‟s home country and in industries with
higher P/E. Also, valuations of the target firms change negatively in the first year.
However, when external managers are involved, SWFs invest more in industries with
lower P/E. In that case, valuations of the target firms change positively in the first
year. This leads them to conclude that home investments, especially those where
politicians are involved, are associated with worse performances and trend chasing.
Possible reasons for these results are “less sophisticated decision structures within
these funds or outright distortions in the investment process due to political or agency
problems.”
Karolyi and Liao (2010) analyze cross-border deals by government-led acquirers
during the time period from 1990 to 2008. They compare these deals to those by
corporate-led acquirers. They are able to distinguish the government-led acquisitions
between those led by SWFs and those without SWF involvement. They report that
acquisitions led by SWFs are less likely to fail compared to acquisitions by
government-led acquirers without SWF involvement. Also, SWF-led acquisitions
focus on larger target companies and companies with fewer financial constraints.
They calculate cumulative abnormal market-adjusted returns (CMARs) over a 3-day
announcement window [-1, +1] and find that the median CMARs are 0.88 percent for
14
Chapter Two: Literature Review
SWF-led acquisitions that seek majority stakes and 0.85 percent for those that seek
minority stakes (for comparison, results are 5.8 percent and 1.4 percent for corporateled acquirers and 2.1 percent and 1.0 percent for government-led acquirers without
SWF involvement).
Kotter and Lel (2010) examine investment strategies of SWFs and analyze a sample
of 358 observations between 1980 and February 2009. They report that SWFs prefer
large firms with poor performance, high leverage, international presence and low cash
reserves. When they account for transparency of SWFs, they find that more
transparent SWFs are more likely to invest in firms with poor performance and more
transparent SWFs have a greater positive impact on target firm value (higher
abnormal return). They argue that voluntary SWF transparency is a proxy for the
quality of monitoring by SWFs and that it can be seen as both a signal of the
likelihood that the investment choices of a SWF have financial objectives and that
they will increase the value of the target company. Also, abnormal returns are higher
if the SWF invests in more opaque firms27, firms with high leverage, low cash
reserves or when the SWF takes a large stake. The average cumulative abnormal
return (CAR) over a 3-day announcement window [-1, +1] is 2.25 percent (1.78
percent for cross-border investments only). Furthermore, they find that SWF
investments do not have a substantial effect on profitability, growth, firm
performance and corporate governance in the long-run. Given that they do not find
any evidence that investments by SWFs influence the performance of the target
companies in the long-run (both financially and operationally), they conclude that
SWFs are not active shareholders. Instead, they conclude that SWFs are similar to
27
As a proxy for opaqueness, they use the natural logarithm of the number of analysts that cover the target firm.
15
Chapter Two: Literature Review
other passive institutional investors in that they have comparable preferences with
regards to the characteristics of the target company and the effect that they have on
the performance of the target.
Avendaño and Santiso (2009) use holding-level data from FactSet/Lionshares and
Thomson Financial databases in order to compare equity investments of 17 SWFs
with other institutional investors (the 25 largest mutual funds – both index funds and
actively managed funds) in the last quarter of 2008. They analyze geographical,
sector and industry allocation relative to these mutual funds (the „benchmark‟
investor allocation) as well as the political bias of their investments. They find that
there are only small differences in the investment profile of the firms in which SWFs
and mutual funds invest in (in terms of P/E ratio, P/B ratio, Dividend Yield, Sales
Growth (%), and Beta). They find that SWFs have a more diversified allocation by
country than mutual funds, which show a high concentration of holdings in the U.S..
However, the authors state that this result could be due to a sample bias as most of the
mutual funds in their sample are based in the U.S.. They also find that SWFs mainly
invest in Asia, followed by investments in Europe and North America. Mutual Funds
focus on investments in North America and Asia, with fewer investments in Europe.
SWFs also have a higher proportion of investments in the Middle East. Overall, they
find that SWFs are diversified more in terms of investments in countries, regions, as
well as sectors and industries. When analyzing political regimes and corporate
governance of target firms28, the authors find that there are no significant differences
between SWF and mutual fund investments. This leads them to conclude that SWFs
28
Avendaño and Santiso (2009) define several criteria that determine the political regimes and corporate governance of
target firms. For example, an indicator for „political regime‟ is „institutionalized democracy‟ and it reflects the
competitiveness of political participation in a particular country. An indicator for „corporate governance‟ is „Regulation
of Chief Executive Recruitment‟ and it refers to the procedures for transferring executive power.
16
Chapter Two: Literature Review
are more risk-return and profit-maximization oriented then often assumed and that
despite differences in allocations, investment motives between SWFs and mutual
funds are not very different.
Balin (2010) analyses the effects of the global financial crisis since 2007 upon SWFs.
He finds that following heavy losses during the crisis, SWFs started to transform.
Overall, SWFs have moved towards relatively shorter investment time horizons29,
more liquid holdings and have worked towards becoming more transparent. In
addition, they started to re-evaluate their management, have begun to hold controlling
stakes in major corporations and have improved their coordination with institutional
investors and other SWFs.
As this study will investigate how well the cross-border equity investments of SWFs
perform, on average, compared to the cross-border equity investments of other
Institutional Investors (Hedge Funds (HFs)30), this chapter also provides an overview
of the Hedge Fund literature.
2.4 Hedge Fund Literature
Analyzing the performances of HFs can be challenging as they invest in a
heterogenous range of financial assets and often lack transparency (Gehin, 2004).
29
Balin (2010) states that before the financial crisis, SWFs believed that the probability was low that their assets would
be used for domestic purposes and therefore held mainly less liquid assets with a long time horizon that provided higher
returns. When sovereigns called SWFs to participate in domestic stabilization efforts, some SWFs were subsequently
forced to sell their assets at high losses. In response, SWFs have started to change their investment horizon to incorporate
more sovereign payouts.
30
Brav et al. (2008) state that HFs can be “identified by four characteristics: (1) they are pooled, privately organized
investment vehicles; (2) they are administered by professional investment managers with performance-based
compensation and significant investments in the fund; (3) they are not widely available to the public; and (4) they operate
outside of securities regulation and registration requirements”.
17