Risk factors for early onset myopia in singapore chinese preschool children
Bạn đang xem bản rút gọn của tài liệu. Xem và tải ngay bản đầy đủ của tài liệu tại đây (5.71 MB, 300 trang )
RISK FACTORS FOR EARLY-ONSET MYOPIA IN
SINGAPORE CHINESE PRESCHOOL CHILDREN
LOW CONG JIN WILSON
(B.Sc.(Hons.), NUS)
A THESIS SUBMITTED
FOR THE DEGREE OF MASTER OF SCIENCE
DEPARTMENT OF EPIDEMIOLOGY AND PUBLIC
HEALTH
NATIONAL UNIVERSITY OF SINGAPORE
2011
ACKNOWLEDGEMENTS
My heartfelt appreciation goes towards my supervisor, Prof. Saw Seang Mei who
not only had introduced me into the realm of epidemiological research, but also
provided umpteen encouragement, mentorship and guidance in my quest for a
postgraduate education. I thank her for believeing in my capabilities and passion
towards research.
I would also like to extend my gratitude to my co-supervisor, Prof. Wong Tien
Yin for his superb support and timely critical review of my work. I also thank him
for motivating me to continue striving for excellence.
I am extremely grateful to Dr. Dharani Ramamurthy for vetting my thesis, Mr
Brendon Zhou and Ms Lin Xiaoyu for their statistical support, Ms Eunice Lo for
her fantastic secretariat assistance, and all my friends and collegues at EPH for
providing much encouragement, laughters and joy, and a great working
environment. Much credit and thanks also goes towards the current and past
clinical and administrative staffs of STARS for their help and hard work in
recruitment and collection of clinical data, without which my thesis would have
certainly not existed. The voluntary participation of all the subjects in the STARS
is sincerely appreciated. I acknowledge the funding of STARS by National
Medical Research Council, Singapore (NMRC/1009/2005).
Last but not least, I would like to thank my family for their tolerance,
understanding and support.
i
TABLE OF CONTENTS
ACKNOWLEDGEMENTS......................................................................................i
TABLE OF CONTENTS.........................................................................................ii
SUMMARY............................................................................................................iv
LIST OF TABLES.................................................................................................vii
LIST OF FIGURES ................................................................................................ix
CHAPTER 1 ............................................................................................................1
LITERATURE REVIEW ........................................................................................1
1.1 Introduction....................................................................................................1
1.2 Background ....................................................................................................1
1.2.1 Refractive Components of the Eyes and Relation to Myopia.................1
1.2.2 Emmetropisation .....................................................................................2
1.2.3 Animal Models of Myopia......................................................................2
1.2.4 Genes and Environment..........................................................................4
1.2.5 Definition of Myopia in Epidemiologic Studies.....................................4
1.2.6 Axial Length and Myopia .......................................................................5
1.2.7 Complications of High and Pathologic Myopia......................................5
1.2.8 Public Health and Socioeconomic Impact of Myopia ............................6
1.3 Prevalence of Myopia ....................................................................................8
1.3.1 Methodology of the literature search ......................................................8
1.3.2 Myopia Prevaence among Asian Children .............................................8
1.3.3 Myopia Prevalence among Non-Asian Children ..................................11
1.3.4 Myopia Prevalence Among Singaporean Adults..................................12
1.4 Distribution of Ocular Biometry..................................................................14
1.4.1 Axial Length .........................................................................................14
1.5 Risk Factors for Development of Myopia and Elongation of Axial Length15
1.5.1 Methodology of the Literature Search ..................................................15
1.5.2 Family History of Myopia ....................................................................18
1.5.3 Near work Activities and Parameters ...................................................20
1.5.4 Outdoor Activity and Physical Activity................................................22
1.5.5 Stature ...................................................................................................25
1.5.6 Birth Parameters....................................................................................27
1.5.7 Parental Smoking History .....................................................................28
1.5.8 Breastfeeding ........................................................................................29
1.6 Conclusion ...................................................................................................30
1.6.1 Summary of Current Literature.............................................................30
CHAPTER 2 ..........................................................................................................60
OBJECTIVES ........................................................................................................60
2.1 Primary Aims ...............................................................................................60
2.2 Secondary Aims ...........................................................................................60
CHAPTER 3 ..........................................................................................................61
METHODOLOGY ................................................................................................61
3.1 Study Design................................................................................................61
3.2 Study Population..........................................................................................61
3.2.1 Sampling Frame ....................................................................................61
3.2.2 Eligibility ..............................................................................................65
3.2.3 Study Approval .....................................................................................65
3.2.4 Recruitment...........................................................................................66
3.2.5 Response Rate.......................................................................................67
ii
3.3 Clinic Visit ...................................................................................................68
3.3.1 Refractive Error Measurements ............................................................68
3.3.2 Biometry Measurements .......................................................................73
3.3.3 Risk Factor Assessment ........................................................................74
3.4 Questionnaires..............................................................................................75
3.4.1 Demographics and Socioeconomic Factors ..........................................75
3.4.2 Family History of Myopia ....................................................................76
3.4.3 Near work Activities .............................................................................76
3.4.4 Outdoor Activity ...................................................................................77
3.4.5 Birth Parameters....................................................................................78
3.4.6 History of Parental Smoking.................................................................78
3.5 Definitions....................................................................................................79
3.6 Data Management ........................................................................................79
3.6.1 Data Collection and Entry.....................................................................79
3.6.2 Confidentiality ......................................................................................80
3.7 Data Analysis ...............................................................................................81
CHAPTER 4 ..........................................................................................................82
RESULTS ..............................................................................................................82
4.1 Characteristics and Demographics of the Study Population........................82
4.1.1 Age and Gender ....................................................................................82
4.1.2 Axial Length, Spherical Equivalent and Myopia..................................82
4.1.3 Social Economic Status.........................................................................85
4.2 Risk Factors for Myopia Analysis ...............................................................86
4.2.1 Parental History of Myopia...................................................................87
4.2.2 Stature ...................................................................................................92
4.2.3 Outdoor Activity .................................................................................101
4.2.4 Near work............................................................................................107
4.2.5 Family History, Near Work, Outdoor Activity, and Myopia in
Singapore Chinese Preschool Children........................................................121
4.2.6 Parental History of Smoking...............................................................124
4.2.7 Birth Parameters..................................................................................140
CHAPTER 5 ........................................................................................................154
DISCUSSION ......................................................................................................154
5.1 Risk Factors for Myopia ............................................................................155
5.1.1 Family History of Myopia ..................................................................155
5.1.2 Body Stature........................................................................................159
5.1.3 Near work............................................................................................162
5.1.4 Outdoor Activity .................................................................................166
5.1.5 Parental Smoking ................................................................................169
5.1.6 Birth Parameters..................................................................................172
5.2 Implications of study Results.....................................................................174
5.3 Strengths and Limitations ..........................................................................177
5.3.1 Strengths .............................................................................................177
5.3.2 Limitations ..........................................................................................178
5.4 Conclusions................................................................................................181
CHAPTER 6 ........................................................................................................183
PUBLICATIONS.................................................................................................183
REFERENCES ....................................................................................................214
LIST OF APPENDICES......................................................................................226
iii
SUMMARY
Background:
Both genes and environments are known to play important roles in the onset and
development of myopia. Family history of myopia is a major risk factor for
myopia and ocular biometry and represents a surrogate for genetic or shared
environmental
factors.
However,
current
evidence
also
suggests
that
environmental factors such as near work and outdoor activity are implicated in the
development of myopia and longer axial length (AL). Height and birth weight are
potential risk factors for myopia and ocular biometry.
Objectives:
The primary aim is to investigate the risks factors for myopia and ocular biometry
in Singapore Chinese preschool children aged 6 to 72 months. The secondary aims
include assessment of the association of family history of myopia, near work,
outdoor activity, stature, birth parameters, and parental smoking with myopia and
ocular biometry.
Methodology:
A population-based cross-sectional study, with disproportionate random sampling
by 6-month age groups, was conducted to determine the prevalence of and risk
factors for myopia in a representative sample of 3009 Singaporean Chinese
preschool children aged 6 to 72 months living in the South-Western and Western
part of Singapore. Spherical equivalent refraction (SER) was measured using
cycloplegic autorefraction or streak retinoscopy. AL was obtained monocularly
using non-contact partial coherence interferometry (IOL Master). Height and
weight were assessed by standard protocols. Information on family history of
iv
myopia, near work and outdoor activities, birth parameters and parental smoking
were determined by comprehensive questionnaires.
Results:
Children with two myopic parents were more likely to be myopic (adjusted odds
ratio (OR) = 1.91; 95% confidence interval (CI) = 1.38 - 2.63), and were found to
have a 0.35 diopters (D) (95% CI = -0.47 - -0.22) more myopic SER and a 0.16
mm (95% CI = 0.08 - 0.24) longer AL than children without myopic parents. For
each 1 cm increase in height, the SER was more myopic by 0.01 D and AL longer
by 0.02 mm. Neither near work nor outdoor activity was associated with myopia.
The proportion of children with myopia was significantly less than among those
whose mothers ever smoked compared to those whose mothers never smoked
(7.6% vs. 11.8%, p = 0.047). Birth weight was associated with longer AL
(regression coefficient = 0.26; 95% CI = 0.18 - 0.33).
Conclusion:
Our study found an association of family history of myopia with prevalence of
myopia, more myopic refraction and longer AL in Singaporean Chinese preschool
children aged 6 to 72 months. Height was associated with more myopic SER and
longer AL. Birth parameters were associated with longer AL. Maternal smoking
appeared to reduce the risk of myopia in this very young group of children. Key
lifestyle factors such as near work and outdoor activity were not significantly
associated with myopia in this study which might be due to the lesser amount of
nearwork or outdoor activity performed. This contradicts the association between
myopia and near work or outdoor activity found in older children reported by
previous studies in which the findings suggest that the cumulative effects of near
work and outdoor activity may only influence the development of myopia in older
v
children aged more than 6 years during the school years. In summary, genetic
factors may play a more substantial role in the development of early-onset myopia
as compared to environmental factors.
vi
LIST OF TABLES
Table 1. Prevalence of Myopia in Children in Asia...............................................34
Table 2. Prevalence of Myopia in Children in Non-Asian Countries....................39
Table 3. Prevalence of Myopia in Singaporean Adults .........................................42
Table 4. Family History/Parental Myopia as Risk Factor for Myopia in Children in
Asia ........................................................................................................................43
Table 5. Family History/Parental Myopia as Risk Factor for Myopia in Children in
Non-Asian Countries .............................................................................................45
Table 6. Near work as Risk factor For Myopia in Children in Asia......................47
Table 7. Near work as Risk Factor For Myopia in Children in Non-Asian
Countries ................................................................................................................49
Table 8. Outdoor as Risk Factor of Myopia in Children .......................................51
Table 9. Stature and Anthropometric Parameters as Risk Factor for Myopia in
Children..................................................................................................................53
Table 10. Stature and Anthropometric Parameters as Risk Factor for Myopia in
Adults.....................................................................................................................54
Table 11. Birth Parameters as Risk Factor for Myopia in Children ......................56
Table 12. Parental Smoking as Risk Factor For Myopia .......................................57
Table 13. Breastfeeding as Risk Factor For Myopia .............................................59
Table 14. Detectable odds ratios for different numbers of cases of a particular
condition and prevalence of a particular risk factor using the remaining cohort as
controls...................................................................................................................65
Table 15. Characteristics of the Study Population by Gender and Age.................82
Table 16. Characteristics of the Study Population by Ocular biometry and
Spherical Equivalent ..............................................................................................84
Table 17. Proportion of Children with Myopia by Ocular biometry and Spherical
Equivalent ..............................................................................................................85
Table 18. Characteristics of the Study Population by Social Economic Status.....86
Table 19. Proportion of Children with Myopia by Social Economic Status .........86
Table 20. Characteristics of the Study Population by Parental Myopia ................87
Table 21. Proportion of Children with Myopia by Parental Myopia.....................88
Table 22. Ocular Biometry and Spherical Refraction by Parental Myopia ...........90
Table 23. Characteristics of the Study Population by Stature ...............................94
Table 24. Proportion of Children with Myopia by Stature ....................................95
Table 25. Ocular Biometry and Spherical Refraction by Stature ..........................99
Table 26. Characteristics of the Study Population by Outdoor Activity .............102
Table 27. Proportion of Children with Myopia by Outdoor Activity ..................103
Table 28. Ocular Biometry and Spherical Refraction by Outdoor Activity ........105
Table 29. Characteristics of the Study Population by Near work Activity..........109
Table 30. Proportion of Children with Myopia by Near work Activity ..............112
Table 31. Ocular Biometry and Spherical Refraction by Near work Activity.....117
Table 32. Risk factors Associated with Myopia among Singapore Chinese
Preschool Children...............................................................................................122
Table 33. Risk Factors Associated with Spherical Equivalent Refraction among
Singapore Chinese Preschool Children................................................................123
Table 34. Factors predictive of Axial Length among Singapore preschool children
..............................................................................................................................124
Table 35. Characteristics of the Study Population by Parental Smoking ............125
Table 36. Proportion of Children with Myopia by Parental Smoking.................130
vii
Table 37. Ocular Biometry and Spherical Refraction by Parental Smoking .......134
Table 38. Association of Smoking by Either Parent with Myopia in Children ...137
Table 39. Association of Smoking by Each Parent with Myopia in Children.....138
Table 40. Association of Smoking by Mother during Child’s Life and Low Birth
Weight with Myopia in Children .........................................................................140
Table 41. Characteristics of the Study Population by Birth Parameters..............143
Table 42. Proportion of Children with Myopia by Birth Parameters ..................144
Table 43. Ocular Biometry and Spherical Refraction by Birth Parameters.........148
Table 44. Association of Myopia with Quartiles of Birth Parameters.................151
Table 45. Association of Myopia with Clinical Definitions of Birth Parameters
(Normal and High versus Low Range) ................................................................152
Table 46. Association of Myopia with Clinical Definitions of Birth Parameters
(Low and High versus Normal Range) ................................................................153
Table 47: Singapore Census of Population 2010 (Dwelling Types by Combined
income, Education and STARS Recruitment Areas)...........................................181
viii
LIST OF FIGURES
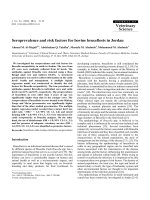
Figure 1. Flowchart for Pubmed (Medline) Search on the Prevalence of Myopia in
Children..........................................................................................................................8
Figure 2. Prevalence of myopia (SER at least -0.5 D) across different age groups
in Singapore .................................................................................................................13
Figure 3. Flowchart for Pubmed (Medline) search on risk factors for myopia ...........17
Figure 4. Multivariable-adjusted odds ratios (adjusted for gender, ethnicity,
parental myopia, parental employment, and education) for myopia by reported
average daily hours spent on near-work versus outdoor activities in 12-year-olds
Australians. ..................................................................................................................24
Figure 5. Study Areas of the STARS Study ................................................................62
Figure 6. Sampling Frame and Response Rate ............................................................63
Figure 7. Distribution of Axial length among Singapore Chinese Preschool
Children........................................................................................................................83
Figure 8. Distribution of Spherical Equivalent among the Right Eyes of Singapore
Chinese Preschool Children.........................................................................................84
Figure 9. Prevalence of Myopia in Children among History of Parental Myopia.......88
Figure 10. Mean Axial Length in Children among Parental Myopia ..........................89
Figure 11. Mean Spherical Equivalent among Parental Myopia .................................91
Figure 12. Distribution of Height among Singapore Chinese Preschool Children......93
Figure 13. Distribution of Weight among Singapore Chinese Preschool Children.....93
Figure 14. Distribution of BMI among Singapore Chinese Preschool Chinese ..........94
Figure 15. Scatter Plot of Height and Axial Length ....................................................96
Figure 16. Scatter Plot of Weight and Axial Length ...................................................98
Figure 17. Prevalence of Myopia among Children whose Mothers ever Smoked
during the Child’s Life...............................................................................................128
Figure 18. Prevalence of Myopia in Children who had at least One Parent who
ever Smoked...............................................................................................................129
Figure 19. Distribution of Birth Weight among Singapore Chinese Preschool
Children......................................................................................................................141
Figure 20. Distribution of Birth Length among Singapore Chinese Preschool
Children......................................................................................................................141
Figure 21. Distribution of Birth Head Circumference among Singapore Chinese
Preschool Children.....................................................................................................142
Figure 22. Distribution of Gestational Age among Singapore Chinese Preschool
Children......................................................................................................................142
ix
CHAPTER 1
LITERATURE REVIEW
1.1 Introduction
Myopia is a common ocular disease that affects about 1.6 billion people
globally. In Caucasian populations, approximately 20% to 25% of the individuals
develops myopia.[1] In contrast, the prevalence of myopia is much higher and
reaching epidemic levels of up to 80% in selected regions of Asian countries such
as Taiwan, Hong Kong and Singapore.[2-4] Myopia is a major public health
problem because of under-correction and undiagnosed cases, which can lead to
visual impairments and potentially blinding ocular complications.[5] Myopia also
poses a direct economic burden resulting from the cost of refractive correction
through repeat optometry visits and prescription of spectacles, contact lenses and
refractive surgery.[6] In Singapore, the mean annual direct cost of myopia for
each school children aged 7 to 9 years is US$148.[7] Myopia is a complex eye
disease, in which both genetic and environmental factors contribute to its
development.[8] Twin heritability, familial aggregation, pedigree segregation and
linkage studies provide evidence to support a major genetic component
influencing myopic development.[9-12] Additionally, environmental factors such
as near work and outdoor activity appear to also play an important role in the
development of myopia.[13-15] This review aims to summarise the known as well
as controversial risk factors for myopia and ocular biometry including family
history, near work, outdoor and stature, birth parameters, smoking and
breastfeeding in children.
1.2 Background
1.2.1 Refractive Components of the Eyes and Relation to Myopia
1
The refractive components of the eye mainly comprise the corneal power,
anterior chamber depth, lens power and AL.[16] When there is a mismatch
between the refractive power of the anterior segment of the eye and AL, i.e.
disruption of emmetropisation particularly by environmental and/or genetic
factors, ametropia occurs. Myopia develops when the image is focused anteriorly
with respect to the retina as the consequences of optical power of the cornea or
lens being relatively large compared to the AL and/or the eye ball elongating
abnormally. Myopic individuals can see near objects clearly but not far ones.
1.2.2 Emmetropisation
Emmetropisation is the process whereby the refractive power of the
anterior segment of the eye compensates for the increase in the axial length (AL)
during the growth phase by reducing its refractive power proportionately. The set
point of emmetropisation is fixed so as to enable the eye to focus clearly on far
objects. Emmetropisation typically takes place in the first eighteen months of life
and emmetropia is reached at approximately 9 to 14 years of age, with no further
refractive changes in normal eyes after 16 years.[17, 18] Both active and passive
factors interact to guide the refractive error of the eye towards emmetropia, a
balance of refractive power of the eye and its ocular dimension.[19] Normally, the
eyes rapidly shift from neonatal hypermetropia to nearly emmetropia within the
first year of life, which is then followed by a gradual decline in the rate of shift to
emmetropia after the first year.[20]
1.2.3 Animal Models of Myopia
In experimental models, macaque monkeys with surgically fused eyelids,
an example of visual deprivation, experienced excessive AL elongation and
eventually develop myopia.[21] This landmark study ushered a new era in
2
experimental myopia study and in the years since, models of visual deprivation of
myopia has been developed in a wide variety of animal species, including
chick,[22, 23] tree shrew,[24, 25] guinea pig,[26, 27] and adult monkey.[28] In
another experimental method of using positive and negative lens to induced
optical defocus in chick eyes, it was showen that the eye developed hyperopia
with positive lens and myopia with negatice lens.[22] The animal models of
myopia suggest that both retinal image degradation (hyperopic and myopic
defocus) and accommodation play important roles in AL elongation and myopia
formation in animals.[29] Experimental models of myopia suggest an important
role of environmental factors in degradation of image quality which could lead to
myopia development.[21, 24, 30] Taken together, animal models of myopia
suggested that the degradation of retinal image effects retinal signaling cascade
through neurochemical modulation,[31] a change in choroidal growth,[32] scleral
remodeling[33, 34] and ultimate regulation of the growth of eye size and shape.
However, questions still remained on the extrapolation of the animal
models of myopia to physiologic human myopia because basic biological and
anatomical differences exist between the eyes of humans and animals.[35] Firstly,
children are unlikely to have visual deprivation of similar magnitude to that
produced by plastic occluders or by lid fusion in animals. For instance, a study of
ten patients with either unilateral congenital cataracts or blepharoptosis, both
arguably “visual deprivations” in humans, did not found significantly longer AL
in the deprived eye compared to the fellow eye suggesting the effect of visual
deprivation on eye growth is less predictable in humans.[36] Secondly, the
sensitive period for myopia onset in humans and the different types of animal
models is very dissimilar. The sensitivity of juveniles to onset of myopia typically
3
occurs much later in life at between the ages of 8 to 14 years old which is
inconsistent with the sensitive period to myopia onset in animal models. The
similar sensitivite period in both primates and chicken models, however, occurs
much earlier in life when translated to human age.[37]
1.2.4 Genes and Environment
The strongest evidence of an environmental-induced myopia in humans
comes from the effect of near work activities, specifically education, and
association with an increased prevalence of myopia,[13, 38-42] This led to the
hypothesis of the use-abuse theory of myopia because of the observed higher
amount of near work performed in myopic individuals.[43] In contrast to
environmental factors, the major role of a genetic determinant of myopia and AL
is unanimously accepted and evidence comes from the numerous studies on
familial inheritances, twin heritability, pedigree segregation and linkage
analysis.[9-12, 44-51] The genetic theory is based on the principle that the natural
variation in eye growth will produce myopia in susceptible individual.[43] Indeed,
a broad range of cell signaling and biochemical pathways in the regulation of eye
growth have been recognised in animal models.[52]
1.2.5 Definition of Myopia in Epidemiologic Studies
Refractive error is commonly quantified as spherical equivalent refraction
(SER) (sphere plus half negative cylinder) in diopters (D) on a continuous scale.
Most commonly used and widely acknowledged definitions of myopia in
epidemiologic studies include SER of at least -0.5 D, -0.75 D and -1.0 D.[53] The
Refractive Error Study in Children (RESC) used the definition of myopia as SER
of at least -0.5 D.[54] Other definitions include moderate myopia defined as SER
of at least -3.0 D while high myopia is denoted as SER as least -6.0 D, -8.0 D and
4
-10.0 D respectively. It should be noted that the cutoff values for myopia is
arbitrary and serve to determine the presence or absence of myopia. However,
setting an arbitrary cutoff for a physiologic range limits the comparison of studies
using dissimilar criteria and disregards the elongation of the AL. To date, there is
no universal accepted definition of myopia.
1.2.6 Axial Length and Myopia
Myopia is associated with longer eyes in population-based studies.[55, 56]
AL is often regarded as the primary determinant of refractive error compared with
other refractive components such as the anterior chamber depth, corneal power
and lens power.[16, 57-59] Moreover, the correlation with SER is larger for AL
than for other components.[60] Children with longer AL were shown to have the
greater risk of developing myopia.[61] However, AL appears to associate with
myopia only when emmetropisation failed, which leads to longer eyeballs in
myopic individuals than emmetropic individuals.[16] Indeed, emmetropia can be
associated with a range of AL which overlaps significantly with the range that is
associated with myopia.[58, 59, 62, 63]
1.2.7 Complications of High and Pathologic Myopia
High myopia (SER at least -6.0 D) poses a greater risk for pathological
fundus changes and may be accompanied by pathological form of myopia that is
malignant myopia.[64] Excessive elongation of the eyeball may be associated
with an increase risk of ocular pathologies including cataract, glaucoma, optic disc
abnormalities,
chorioretinal
abnormalities
and
age-related
macular
degeneration.[65-73] In the Blue Mountains Eye Study[66] which examined 2334
Australian White adults aged 49 years and older, the multivariate odds ratio (OR)
for nuclear cataract was 3.3 (95% CI (1.5, 7.4)) for high myopia (SER at least –6.0
5
D) after adjusting for age, sex, smoking, education, iris, inhaled steroids. In the
Beaver Dam Study[73] conducted in the American Whites (n = 4670; aged 43 to
86 years), the age and gender adjusted OR of prevalent primary open-angle
glaucoma (POAG) was 1.6 (95% CI (1.1, 2.3)) for myopia (SER at least –1.0 D).
Curtin and Karlin[72] analysed 1437 eyes of Whites and found that chorioretinal
atrophy was absent in subjects with AL less than 24.5 mm whereas it was present
in 23% of subjects with AL greater than or equal to 24.5 mm. Fuch’s spot was
almost absent when the AL was less than 26.5 mm whereas it was present in 5.2%
of subjects with AL greater than or equal to 26.5 mm. Lacquer cracks was absent
in subjects with AL less than 26.5 mm whereas it was present in 4.3% of subjects
with Al greater than or equal to 26.5 mm. White without pressure was absent in
subjects with AL between 20 to 21 mm whereas it was present in 54% of subjects
with AL of 33 mm. Lastly, the percentage of lattice degeneration increased with
elongation of AL (p < 0.01). Among the 5114 Whites from Netherlands aged 55
and older,[69] the disc area and neural rim area increased by 0.033 mm2 (95% CI
(0.027, 0.038)) and 0.029 mm2 (95% CI (0.025, 0.034)) respectively for each
diopter increase in myopia. The prevalence of parapapillary atrophy was higher
(zone alpha and zone beta increased by 0.4% (95% CI (0.03, 0.8) and 1.3% (95%
CI (0.57, 1.9) respectively) for each diopter increase towards myopia.
1.2.8 Public Health and Socioeconomic Impact of Myopia
Under-correction of myopia is a major public health problem worldwide
and is one of the leading causes of visual impairment among school-aged children
and undermines their vision-related quality of life.[74-78] Another public health
issue is related to the potentially blinding ocular complications (cataract,
glaucoma and retinal detachment) associated with high myopia.[65, 71, 79, 80]
6
This is a significant problem in countries with increased prevalence of high
myopia for instance the East Asian nations and in certain susceptible ethnic
groups such as the Chinese. Blindness can lead to a heavy loss of economic
productivity especially if it struck at the peak productivity.
Highly myopic individual may experience an impaired quality of life. A
study on 112 myopic patients aged 18 to 65 in the United Kingdom found that
highly myopic individuals had significant worse vision related quality of life
(QOL) scores (VCM1).[81] The study also showed that high degrees of myopia
have an adverse effect on the quality of life that is comparable to that of patients
suffering from eye diseases such as keratoconus. In particular, high myopes
expressed psychological, cosmetic, practical and financial factors associated with
wearing thick spectacles lenses as major handicaps in everyday life which
augmented the reported worst QOL.
Significant myopia poses a life-long recurrent use of optician services such
as prescription of spectacles and contact lenses, contact lenses solutions and repeat
optometry visits. There are also medical cost associated with treating myopia
induced morbidities such as retinal detachment, glaucoma and cataract, and
associated visual disability and blindness.[82] Myopia is associated with
considerable financial burden in Singapore; the mean and median annual direct
cost of myopia for each Singapore school children aged 7 to 9 years was S$221.68
(US$148) and S$125.00 (US$83.33) respectively.[7] Based on age-specific
prevalence of myopia, it was estimated to cost Singapore S$37.5 million (US$25
million) to correct myopia in Singapore teenagers. Recently in the United States,
NHANES estimated the annual direct cost of correcting distance vision
7
impairment owing to refractive error to be between US$3.9 billion and US$7.2
billion.[83]
1.3 Prevalence of Myopia
1.3.1 Methodology of the literature search
The search was conducted in Pubmed. Keywords used were “refractive
error” and “prevalence”. A total of 1820 articles were retrieved. 97 titles were
selected on relevance to prevalence of myopia. The abstracts of the titles selected
were screened. Finally, 26 abstracts were deemed relevant and the journal articles
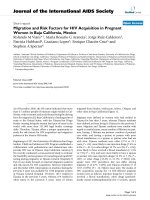
were retrieved and reviewed.(Figure 1)
Prevalence
(Exploded)
N=1365202
Refractive error
(Exploded)
N=17625
Combined
(English)
N=1820
1723 excluded based on titles
N=97
71 excluded based on
irrelevance to prevalence of
myopia in children abstract
N=26
Figure 1. Flowchart for Pubmed (Medline) Search on the Prevalence of Myopia in Children
1.3.2 Myopia Prevaence among Asian Children
The RESC is a joint comparative study of the prevalence rate of myopia in
urban cities and rural villages in Asian as well as Non-Asian countries. A total of
11 locations included in the RESC used similar protocol, sampling strategies and
definitions.[54] Briefly, children aged 5 to 15 years were randomly sampled in
clusters in population-based prevalence surveys. Myopia was defined as SER at
least -0.5 D and cycloplegic refraction measured using streak retinoscopy and
hand-held autorefractor.
8
Among the Asian countries conducted by RESC, the prevalence rate of
myopia was highest in urban China (78.4% in 15-year-old Chinese
children)(Table 1)[77] and lowest in rural Nepal (less than 3% in Nepalese
children aged 5 to 15 years).(Table 1)[84] In the Gombak district of Malaysia,
prevalence of myopia was lowest in the 7-year-old (10%), rising to 16.2% among
the 10-year-olds and reaching the highest in the 15-year-old children (32.5%);
Chinese children had the highest prevalence of myopia (46.4%), followed by
Indians (16.2%) and Malays (15.4%) across all ages.(Table 1)[85] In Nepal,
prevalence of myopia ranged from 10.9% in 10-year-olds children, 16.5% in the
12-year-olds, to 27.3% in 15-year-olds children living in the urban region whereas
it was less than 3% in rural Nepalese aged 5 to 15 years.(Table 1)[84, 86] In India,
the prevalence of myopia ranged from 4.68% in the 5 year-olds, 6.95% in the 10year-olds and 10.8% among the 15-year-olds in the urban city. In the rural region,
the prevalence of myopia was 2.8% in the 7-year-olds, 4.06% in the 10-year-olds
and 6.74% in the 15-year-olds.(Table 1)[78, 87] In China, the prevalence of
myopia was neligible in the 5-year-olds, and increased to 36.7% in the 15-yearolds males and 55% in the females in the rural part of Northern China.(Table
1)[76] In rural region of Southern China, 36.8% of 13-year-olds, 43% of 15-yearolds and 53.9% of 17-year-olds were myopic.(Table 1)[88] Among Chinese
children in urban region of China, the prevalence of myopia ranged from 5.7% in
the 5-year-olds, 30.1% in the 10-year-olds and increasing to 78.4% in the 15-yearolds.(Table 1)[77]
In Singapore, the prevalence of myopia was 29% in 7-year-olds, 34.7% in
8-year-olds and 53.1% in 9-year-olds based on the school-based population of the
Singapore Cohort Study of Risk factors for Myopia (SCORM)(Table 1)[89] while
9
the population-based survey, Strabismus, Amblyopia and Refractive error Study
in Singapore Preschool Children (STARS)(Table 1)[90] showed that the ageadjusted mean prevalence of myopia was 11% in Chinese children aged 6 to 72
months.
In Hong Kong, the prevalence of myopia (SER ≤ -0.5 D) in 1991 ranged
from 27.3% to 33.3% in the 6 to 7-year-olds group to 52.6% to 71.4% in the 16
to17-year-olds group among 383 Chinese children aged 6 to 17 years.[91](Table
1). In a clinic-based five-year longitudinal study conducted from 1991 to
1996,[92](Table 1) 123 Hong Kong Chinese children aged 7 years at start of study
was examined. The study showed that the prevalence of myopia (SER ≤ -0.5 D)
increased from 11% at 7 year to 35% at 10 year old and increased to 55% at 12
years old. The largest cross-sectional survey on the prevalence of myopia was
performed in 7560 Hong Kong Chinese children from 1998 to 2000 aged 5 to 16
years using cycloplegic autorefraction to assess SER.[93](Table 1) Myopia was
defined as SER ≤ -0.5 D. Overall, the prevalence of myopia was 36.71% (standard
deviation (SD) = 2.87) among all the children. But there was a trend for myopia
prevalence to increase with age. For instance, the prevalence was 17% in children
aged less than 7 years and which increased to 37.5% among those aged 8 years
and 53.1% in children aged more than 11 years.
In Taiwan, five large-scaled population-based studies[2, 94-96] were
performed to determine the prevalence of myopia and rate of progression of
myopia. The prevalence of myopia among Taiwanese Chinese primary school
children aged 7 years was 5.8% in 1983, 3.0% in 1986, 6.6% in 1990, 12.0% in
1995 and 20% in 2000.(Table 1) Among Taiwanese children aged 12 years, the
myopic rates were 36.7%, 27.5%, 35.2%, 55.5% and 61% correspondingly. At the
10
junior high school level, the prevalence was 64.2%, 61.6%, 74%, 76% and 81%
respectively.(Table 1) Among children aged 16 to 18 years, myopic prevalence
rates was almost constant at around 74% to 75% in studies conducted in 1983,
1986 and 1990. However, the prevalence rate increased to 84% in studies
conducetd in 1995 and 2000.(Table 1)
1.3.3 Myopia Prevalence among Non-Asian Children
RESC was conducted in a few non-Asian populations. In Brazil, the
prevalence of myopia was 5.4% to 6.05% among the children aged 11 to 14
years.(Table 2)[97] Among South African children, prevalence of myopia was
generally about 3% or 4% before increasing to 6.3% in the 14-year-olds and 9.6%
in the 15-year-olds.(Table 2)[98] In suburban region of Chile, 3.4% of the 5-yearolds were myopic and the prevalence rate rose to 19.4% and 14.7% in males and
females aged 15 years respectively.(Table 2)[74]
In Australia, a population-based survey conducted by the Sydney Myopia
Study (SMS) found the prevalence of myopia was 11.9% in the 12-year-olds
(predominantly Caucasians)(Table 2)[99], 1.43% among all the 6-year-olds,
0.79% in the White children and 2.73% among other ethnic groups.(Table 2)[99,
100]
In the Orinda Longitudinal Study of Myopia (OLSM), the prevalence of
myopia increased from a low rate of 4.5% in 6 to 7-year-olds to 28% in 12-yearolds in a predominantly white population in United States.(Table 2)[101] The
Multi-ethnic Pediatrics Eye Disease Study (MEPEDS) showed that the mean
prevalence of myopia in children aged 6 to 72 months was 6.6% in the AfricanAmericans and 3.7% among the Hispanics.(Table 2)[102] The Baltimore
Pediatrics Eye Disease Study (BPEDS) showed that the mean prevalence of
11
myopia was 9.6% in the African-Americans and 1.1% in the White Americans
aged 6 to 72 months.(Table 2)[103]
1.3.4 Myopia Prevalence Among Singaporean Adults
In a study analysing data from Singapore male conscripts aged 17 to 19
years conducted from year 1974 to 1978 and 1987 to 1991, the prevalence of
myopia was 26.3% and 43.3% respectively.[104](Table 3) However, myopia was
defined using visual acuities less than 6/18 and the prevalence rates were
calculated for all the 3 major races of Singapore (75% of the Singapore population
is Chinese, 15% is Malays and 7% is Indians). Two separate studies was
performed to evaluate the prevalence of myopia among the 3 major races in
Singapore using the data on male conscripts aged 17 to 19 collected from year
1987 to 1992[105] and 1996 to 1997.[4](Table 3) Using the criterion of visual
acuities less than 6/18 to define myopia, the earlier study found that 48.5% of the
Chinese, 30.4% of the Indians and 24.5% of the Malays were myopic.[105] With
SER assessed using non-cycloplegic autorefraction and myopia defined as SER ≤
-0.5 D, the latter study demonstrated the Chinese, Indians and Malays had
prevalence rate of 82.2% (95% CI (81.5, 82.9)), 68.7% (95% CI (65.1, 67.1)) and
65% (95% CI (62.9, 67.1)) respectively.[4]
At the secondary school levels, the prevalence of myopia for teenagers
aged 15 to 19 years from the 2 secondary schools was determined to be 73.9%
using noncycloplegic autorefraction to assess SER.[106](Table 3) The Tanjong
Pagar study (TPS) analyzed Singapore Chinese adults aged 40 to79 years and
found the prevalence of myopia (defined as SER ≤ -0.5 D) assessed using
subjective refraction to be 38.7% (95% CI (35.5, 42.1)).[107](Table 3) The
Singapore Malay Eyes Study (SiMES) examined adults Malays aged 40 to 80
12
years and demonstrated the prevalence of myopia in the right eye (defined as SER
≤ -0.5 D using subjective refraction) to be 26.2% (95% CI (26.0,
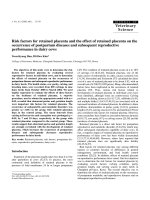
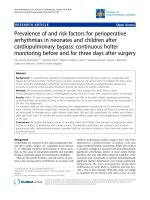
26.4)).[108](Table 3) Figure 2 shows the prevalence of myopia in Singapore
across the age groups from the very young to the old. There is a marked increase
of myopia from the children aged 6 months to young adults aged 19 years even
when races are taken into account.
STARS
SCORM
High
school
students
Male conscripts
Tanjong
Pagar
SiMES
Study
on
Ch
th
in
s
es
e7
ye
Ch
ar
in
s
es
e8
Ch
ye
ar
Al
in
s
lr
es
ac
e9
es
ye
15
ar
Ch
t
s
o1
in
es
9
e1
ye
ar
7
In
s
t
o
di
19
an
s1
ye
ar
7t
M
s
o
ala
19
ys
ye
17
ar
Ch
s
to
in
19
es
e4
ye
ar
0
M
s
t
o
ala
79
ys
ye
40
ar
s
to
80
ye
ar
s
Ch
in
es
e6
to
72
m
Prevalence of myopia (%)
90.0
80.0
70.0
60.0
50.0
40.0
30.0
20.0
10.0
0.0
Figure 2. Prevalence of myopia (SER at least -0.5 D) across different age groups in Singapore
Data taken from: STARS[90], SCORM[89], High schools students[106], Male conscripts[4],
Tanjong Pagar Study[107] and SiMES[108]
1.3.5 Epidemic of Myopia in Asia
There has been a mark increased trend in prevalence of myopia in the past
30 to 40 years in Asia.[109] Currently, the high prevalence of myopia is clustered
among the East Asian countries and especially ‘epidemic’ among the Chinese
population.
The most concrete evidence came from the five large-scale population
surveys conducted in Taiwan[2, 94-96] which have demonstrated a constant
longitudinal increase in the prevalence of myopia (defined as SER ≤ -0.25 D) over
13
a 20-year period in Chinese school children. The prevalence of myopia reached
over 80% among the secondary school leavers aged 16 to 18 years, of which about
20% were high myopic (defined as SER ≤ -6.0 D) indicating an acceleration of
change especially over the last decade. In Singapore, the prevalence of myopia
ranged from about 20 to 30% and 40 to 50% in the 1960s and 1970s respectively
in the male school leavers.[104] The prevalence of myopia increased rapidly to
over 80% in the male school-leaving cohort of which 15% were highly myopic in
the late 1990s.[4] Among the ethnic groups, the Chinese male school leavers were
slightly more myopic than the Malay or the Indians although the increasing trend
in the prevalence of myopia was still evident for each ethnic group.[105] The
latest myopia survey conducted in two secondary school showed a high
prevalence rate of 79.3% among the school leavers aged 15 to 19 years.[106] In
Japan, over a 13 year period from 1984 to 1996, the population-based prevalence
of myopia increased from 49.3% to 65.4% in Japanese students aged 17
years.[110] Elsewhere in Asia such as China and Hong Kong with predominantly
Chinese population, the increasing trend towards high prevalence of myopia was
fairly evident in the urban regions although longitudinal data was unavailable.[3,
111, 112] Nevertheless, the cohort effect of increasing trend of high prevalence of
myopia has been disputed.[113]
1.4 Distribution of Ocular Biometry
1.4.1 Axial Length
There are few population-based studies on distribution of AL. Prior studies
were limited by the study designs and method of technical measurements as AL
was determined either indirectly[59] or directly with radiography[114, 115]. In
contrast, most recent studies utilised ultrasound biometry[89, 116] or noncontact
14
partial coherence interferometry, such as the IOL Master[100, 117] to provide
more precise measurement of AL.
In the SMS which surveyed AL of predominantly European Caucasian
children (more than 60% of the study population) with IOL Master, the mean AL
ranged from 22.58 mm in the 6-year-old children and 22.67 mm in the 7-yearolds,[100] to 23.38 mm in the children aged 11.1 to 14.4 years.[117] The OLSM
analysed predominantly Caucasian population (87.1% of the study population)
using ultrasound biometry and reported mean AL of 22.49 mm in the 6-year-olds,
22.65 mm in the 7-year-olds, 23.31 mm in the 11-year-olds and 23.09 mm in the
12-year-olds.[116] In the SCORM which used ultrasound biometry, the mean AL
was 23.1mm in the 7-year-olds, 23.4 mm in the 8-year-olds and 23.8 mm in the 9year-old Chinese children.[89]
A multi-centre population-based study was conducted in children ages
less than 6 years in different ethnic groups from four sites of the world. In the
STARS, the mean AL was 22.12 mm in children aged 30 to 72
months.(Unpublished) Other study sites included the MEPEDS in Los Angeles,
United States, BPEDS in Baltimore and Sydney Pediatrics Eye Disease Study
(SPEDS), of which the distribution of ocular biometry in different populations and
ethnic groups will be made available soon.
1.5 Risk Factors for Development of Myopia and Elongation of Axial Length
1.5.1 Methodology of the Literature Search
The search was conducted in Pubmed. The keywords for risk factors for
myopia included “family history”, parental history”, ”nearwork”, “near work”,
“outdoor”, “stature”, “height”, “weight”, “BMI”, “anthropometry”, “birth
parameters”,
“birth length”, “birth weight”, “birth head circumference”,
15