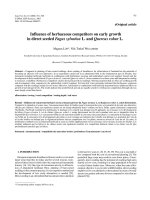
Influence of transboundary pollution of biomass burning on ionic compounds in urban particulates
Bạn đang xem bản rút gọn của tài liệu. Xem và tải ngay bản đầy đủ của tài liệu tại đây (1.83 MB, 109 trang )
INFLUENCE OF TRANSBOUNDARY POLLUTION OF
BIOMASS BURNING ON IONIC COMPOUNDS IN URBAN
PARTICULATES
NGUYEN DUC MINH
NATIONAL UNIVERSITY OF SINGAPORE
2010
INFLUENCE OF TRANSBOUNDARY POLLUTION OF
BIOMASS BURNING ON IONIC COMPOUNDS IN URBAN
PARTICULATES
NGUYEN DUC MINH
(B.Eng. (Hons.), Ho Chi Minh City University of Technology, Vietnam)
A THESIS SUBMITTED
FOR THE DEGREE OF MASTER OF ENGINEERING
DEPARTMENT OF ENVIRONMENTAL SCIENCE AND
ENGINEERING
NATIONAL UNIVERSITY OF SINGAPORE
2010
Acknowledgements
I would like to express my deepest gratitude and appreciation to my supervisor; Associate
Professor Liya Yu, who not only gives me valuable guidance in research but is my mentor
throughout my academic program.
I would also like to give my deepest appreciation to all the staff members in the Division of
Environmental Science and Engineering and all my fellows in the lab.
I would like to acknowledge to National University of Singapore for providing the Research
Scholarship and to the Division of Environmental Science and Engineering for providing the
facilities to take this study through in its entirety.
I am extremely grateful to my parents and parents-in-law for their love and full support
throughout the time. Last but not the least, I would like to express the greatest appreciation to
my wife and son for their patience and love which encourage me during hard time of my
experimental progress.
Nguyen Duc Minh
Aug 2010
i
TABLE OF CONTENTS
Acknowledgements .................................................................................................................... i
TABLE OF CONTENTS.......................................................................................................... ii
SUMMARY ............................................................................................................................. iv
LIST OF TABLES ................................................................................................................... vi
LIST OF FIGURES ................................................................................................................ vii
Chapter 1: INTRODUCTION................................................................................................... 1
1.1 Introduction ........................................................................................................................ 1
1.2 Objectives........................................................................................................................... 4
Chapter 2: LITERATURE REVIEW........................................................................................ 6
2.1 Transboundary Pollution.................................................................................................... 6
2.1.1 Transboundary Pollution of Dust Storm ......................................................................... 6
2.1.2 Transboundary Pollution of Anthropogenic Pollution.................................................... 7
2.1.3 Transboundary Pollution of Biomass Burning................................................................ 7
2.1.4 Transboundary Pollution of Biomass Burning and Particulate Matters ....................... 13
2.1.5 Transboundary Pollution of Biomass Burning and Ionic Species ................................ 13
2.2 Oxalic Acid in Atmospheric Aerosols ............................................................................. 16
2.3 Size Distribution of Inorganic Ions, Oxalic, Malonic, and Succinic Acid....................... 17
2.3.1 Size Distribution of Inorganic Ions in Atmospheric Aerosols ...................................... 18
2.3.2 Size Distribution of Oxalic, Malonic and Succinic Acids in Atmospheric Aerosols ... 20
Chapter 3: METHODOLOGY................................................................................................ 33
3.1 Sample Collection ............................................................................................................ 33
3.1.1 Sampling Site and Duration .......................................................................................... 33
ii
3.1.2 Bulk Particulate Sampling (PM2.5)................................................................................ 34
3.1.3 Size-Segregated Particulate Sampling .......................................................................... 35
3.2 Back Trajectory Analysis................................................................................................. 35
3.3 Chemical Analysis ........................................................................................................... 36
Chapter 4: RESULTS AND DISCUSSION ........................................................................... 38
4.1 Effects of Transboundary Pollution on Bulk and Size Segregated Particulates .............. 38
4.1.1 Identification of Influence of Transboudanry Smoke ................................................... 38
4.1.2 PM2.5 and PM10 ............................................................................................................. 44
4.1.3 Size Segregated Particulate Matter ............................................................................... 48
4.2 Effects of Transboundary Pollution on Oxalates in PM2.5 ............................................... 51
4.3 Effects of Transboundary Pollution on Size Distributions of Inorganic Ions and
Oxalates................................................................................................................................... 55
4.3.1 Size Distribution of Cations .......................................................................................... 56
4.3.2 Size Distribution of Anions........................................................................................... 61
4.3.3 Size Distribution of Oxalates ........................................................................................ 65
4.3.4 Correlation Among Ionic Species ................................................................................. 67
4.3.5 Chemical Composition of Fine Particulates.................................................................. 69
Chapter 5: CONCLUSIONS AND RECOMMENDATIONS................................................ 76
5.1 Conclusions ...................................................................................................................... 76
5.2 Recommendations ............................................................................................................ 78
Appendix ................................................................................................................................ 79
References ............................................................................................................................... 86
iii
SUMMARY
Transboundary pollution of biomass burning smoke is a recurrent issue affecting air quality at
receptor site, such as Singapore. In this study, daily PM2.5 collected in Singapore in 2006,
2008, and 2009, and weekly size segregated particles sampled in 4 weeks of 2008 were
chemically characterized. Back trajectory analysis along with satellite images (haze maps)
was employed to differentiate between smoke episodes vs. non-smoke episodes. With a
strong influence of transboundary smoke, PM2.5 was linearly correlated with visibility
(R2=0.85), and PM10 to PM2.5 ratio substantially decreased.
Mass size distribution of
particulates appeared in bimodal distribution, peaking at cut-off size of 0.38 and 4.1 µm.
Transboundary pollution of biomass burning smoke reinforced size distribution with higher
concentration, rather than altering distribution pattern. Oxalates in PM2.5 were enhanced by
2.5, 1.6, and 0.6 times due to the transboundary smoke in 2006, 2008, and 2009 respectively.
Chemical characterization of size segregated particles showed that NH4+, K+, SO42- and
oxalates dominated in fine mode particles (0.384 µm), whereas Mg2+, Ca2+, Cl-, NO3occupied in coarse mode particles. The concentration of major ions changed in the order of
SO42- > NH4+ > NO3- > Cl- > K+ > Na+ > Ca2+ > Mg2+. Appearance of both NH4+ and SO42- in
droplet mode (0.384 µm) was attributed to condensation of NH3 on surface of acidic particles,
and an unusual appearance of NH4+ in 0.029 µm (nuclei mode) in week 2 is observed. K+ was
highly affected by biomass burning smoke with higher fine-coarse ratio of K+ during smoke
episodes.
Mg2+ and Ca2+ were mostly found in coarse mode particles; and significant
enhanced under influence of transboundary pollution.
It indicated Mg2+ and Ca2+ were
contributed from crustal particles which were re-suspended during burning process. Cl- and
iv
NO3- concentrated in coarse mode particles during the transboundary smoke episode.
Oxalates showed unimodal distribution in background condition, bimodal distribution under
partial effects of transboundary pollution, and trimodal distribution with full effect of
transboundary pollution. A high correlation coefficient (R2>0.82) between oxalates and SO42in 4 sampling weeks suggested their in-cloud process formation pathway. Enrichment of
oxalates in 2.4 µm particles was attributed to heterogeneous formation on surface of sea salt
particles, while their appearance in nuclei mode (0.057 µm) could be due to photochemical
reactions of hydrocarbons with oxidants followed by gas-particle condensation.
v
LIST OF TABLES
Table 2.1: Effects of transboundary on atmospheric aerosols .................................................. 9
Table 2.2: Effects of biomass burning transboundary pollution on PM10 and PM2.5.............. 15
Table 2.3: Size distribution of inorganic compounds in atmospheric aerosols....................... 22
Table 2.4 Size distribution of oxalic (C2 DCA), malonic (C3 DCA) and succinic (C4
DCA) acids in atmospheric aerosols ....................................................................................... 29
Table 4.1: Visibility and its correlation with particulate matter during the sampling
periods in 2006, 2008, and 2009. ............................................................................................ 43
Table 4.2: Effects of transboundary smoke on PM10 and PM2.5 during the sampling
periods in 2006, 2008, and 2009, and in other studies on transboundary biomass burning
pollution. ................................................................................................................................. 45
Table 4.3: Comparison of accumulated particulate in size segregated ELPI with PM2.5. ...... 49
Table 4.4: Concentrations of oxalates under transboundary pollution. .................................. 54
Table 4.5: Fine/ coarse ratio of size segregated particles during 4 weeks of sampling
period in 2008 ......................................................................................................................... 61
Table 4.6: Linear correlation coefficient between ions........................................................... 69
Table 4.7: Chemical compositions (presented in percentage (%) and average
concentration (ng/m3)) of fine particles in various studies ..................................................... 73
vi
LIST OF FIGURES
Figure 4.1: (a) gravimetric data vs. the minimal transport duration of smoke to reach
Singapore, and (b) gravimetric data and visibility during the sampling period in 2006......... 39
Figure 4.2: (a) gravimetric data vs. the minimal transport duration of smoke to reach
Singapore, and (b) gravimetric data and visibility during the sampling period in 2008......... 41
Figure 4.3: (a) gravimetric data vs. the minimal transport duration of smoke to reach
Singapore, and (b) gravimetric data and visibility during the sampling period in 2009......... 42
Figure 4.4: Accumulative mass concentration of size segregated particulates during
sampling period of 2008.......................................................................................................... 50
Figure 4.5: Distribution of particulates during the sampling period in 2008.......................... 51
Figure 4.6: Temporal trend of PM2.5 and oxalate during sampling period of (a) 2006; (b)
2008; and (c) 2009. ................................................................................................................. 54
Figure 4.7: Mass size distribution of (a) NH4+; (b) K+; (c) Mg2+; (d) Ca2+ during 4 weeks
of sampling period in 2008 ..................................................................................................... 61
Figure 4.8: Mass size distribution of (a) Cl-; (b) NO3-; (c) SO42- during 4 weeks of
sampling period in 2008.......................................................................................................... 64
Figure 4.9: Mass size distribution of oxalates during 4 weeks of sampling period in 2008... 66
Figure 4.10: Contribution of chemical species to mass concentration of fine particles. ........ 70
vii
Chapter 1: INTRODUCTION
1.1 Introduction
Singapore, a small island city-nation located at the southern tip of Malayan peninsula, is
highly urbanized and industrialized.
The weather of Singapore is characterized with a
relatively stable condition throughout the year due to its close proximity to the equator with
high relative humidity (RH) (61-90%) and abundant rainfall (~2300 mm per year). The
maximum and minimum daily average temperature in 2009 was 31.1oC and 24.7oC,
respectively (Yearbook of Statistics Singapore 2009). There are two monsoon seasons in
Singapore yearly: northeast monsoon season from late November to March and southwest
monsoon season from late May to September. From April to early May and October to early
November are generally transitional months separating the two monsoon seasons. During the
northeast monsoon season, the wind direction of north to northeast dominates. On the other
hand, during the southwest monsoon season, the south to southwest/southeast wind prevails.
Northeast monsoon season brings more rainfall, about 48% of the total annual rainfall; only
36% of the annual rainfall occurs during the southwest monsoon season (Yearbook of
Statistics Singapore 2009). Depending on wind speed and direction, air quality in Singapore
can be substantially influenced by transboundary pollutants from neighboring countries.
The transboundary pollutants were originated from biomass burning in Sumatra and Borneo/
Kalimantan island for removing dry vegetation, clearing land, shifting cultivation, and
converting forest to agricultural lands (Nichol, 1998). From 1985 to 1997, there was a total
loss of forest land area of 19 million hectares in Indonesia (Jones, 2006; Nichol, 1998). In
1
1997 alone, there were over 40,000 hospitalization cases, mostly in respiratory issues, and 19
cases of life loss in Indonesia are related to the episode of biomass burning smoke (Jones,
2006). In general, biomass burning releases a large amount of combustion products to the
atmosphere (Crutzen and Andreae, 1990), which can affect regional climate pattern through
changes in the local radiation budget and the hydrological cycle since particulates emitting
from biomass burning can serve as cloud condensation nuclei (CCN), and influence formation
and optical properties of cloud (Seinfeld and Pandis, 2006). Nevertheless, the smoke of
biomass burning in Southeast Asia region appeared unique because the composition of soil in
the region, usage of land, and amount of biomass burning smoke (Granier et al., 1996, Gouw
et al., 2004) substantially differs from that in other locations. Linuma et al. (2007) reported
that the biomass burning smoke in Southeast Asia significantly differs from others of
European conifers and peat, African hardwood, and savanna grass. In particular, the biomass
burning smoke in Southeast Asia seems to unusual amounts of cloud condensation nuclei
(CCN) close to the burning sites.
Impacts of biomass burning on source region and receptor sites depend on several factors,
including numbers of hot spots, intensity of fire, and meteorological conditions. For example,
the widespread forest fires can be particularly intense during dry seasons influenced by El
Nino phenomenon (Jones, 2006), affecting air quality in Indonesia, Singapore, Malaysia,
Thailand and southern Philippine.
Initial studies of the biomass burning smoke in the region of Southeast Asia were conducted
in late 1990s when episodes of biomass burning took place in 1994, 1997, and 1998
(Radojevic and Hassan, 1999; Fang et al., 1999; Koe et al., 2001; Muraleedharana et al.,
2000; Abas et al.,2004; Radojevic, 2003; Narakawa et al., 1999; Radojevic and Tan, 2000).
2
In 1998, biomass burning in Indonesia raised PM10 (109.9 µg/m3) in Brunei Darussalam for
more than five times, compared with 20.4 µg/m3 during non-episode days (Radojevic and
Hassan, 1999). In Radojevic’ study (2003) on smoke episodes in Southeast Asia (1994, 1997,
1998), substantial amounts of carbon monoxide and methane releasing from biomass burning
can rapidly react with hydroxyl radicals, affecting the oxidation capacity of the atmosphere.
The same study showed that emission of nitric oxide and hydrocarbons from biomass burning
leads to high concentrations of ozone in the tropics, in particularly during the dry season.
Many studies reported transboundary biomass burning smoke in Brunei Darussalam, Kuala
Lumpur (Malaysia), and Singapore during August to October (Radojevic and Hassan, 1999;
Fang et al., 1999; Muraleedharan et al., 2000; Koe et al., 2001; Radojevic, 2003; Abas et al.,
2004; See et al., 2006), but the specific period when Singapore is affected by the
transboundary pollution may shift, depending on wind directions. The most direct impact of
transboundary smoke on Singapore is reflected by the increase in airborne particulates. In
1997, transboundary biomass burning smoke increased PM10 concentration in Singapore upto
226 µg/m3 (Koe et al., 2001). In 2002, transboundary pollutants from the forest fires in
Sumatra increased the averaged PM2.5 in Singapore from 19.51 ± 3.26 µg/m3 to 38.96 ± 8.28
µg/m3 substantially reduced visibility to < 8000 m (See et al., 2006).
Concurrent with the substantial increase in particulate concentrations, transboundary
pollutants originating from biomass burning carried large amounts of inorganic and organic
components (such as Ca2+, K+, Mg2+, SO42-, NO3-, n-alkanols, fatty acids, PAHs, steroids,
etc.) (Fang et al., 1999; Abas et al., 2004; See et al., 2006). See et al. (2006) reported that the
concentration of formate, acetate, pyruvate, malonate, inorganic cations and anions, metal
elements in Singapore during the smoke episode of biomass burning increased for around two
3
times. Abas et al. (2004) also found that severe biomass burning in 1994 and 1997 in Sumatra,
Indonesia contribute substantially to polar organic compounds in aerosols observed in Kuala
Lumpur, Malaysia.
In particular, biomarkers, such as levoglucosan (polyol class) and
palmitic acid (alkanoic acid class), were among the compounds with a highest concentration
up to 34,000 and 440 ng/m3, respectively (Abas et al., 2004).
Among the identified organic compounds in transboundary smoke, the concentration of oxalic
acid (or oxalates) was considerably enhanced (Sillanpaa et al., 2005; Mochida et al., 2003)
because oxalic acid can be the sink of oxidation process of many organic compounds (Ervens
et al., 2004). Sillanpaa et al. (2005) showed that transboundary biomass burning pollutants
increase concentrations of particulate in accumulation mode with less impact on particles in
Aitken mode. Although some studies showed that oxalic acid (or oxalates) in long-range
transported smoke mainly concentrated in the accumulation mode (0.32–0.56 µm) (Zhao and
Gao, 2008, Yao et al., 2003b; Muller et al., 2005; Mochida et al., 2003), endeavor is needed to
understand the influence of transboundary biomass burning smoke on size distribution of
oxalic acid in urban environment. This can yield additional implications on radiative budget
of particulates attributed to large city or certain regions.
1.2 Objectives
This study aims to examine how transboundary biomass burning smoke affects urban
particulates in Singapore in three years, 2006 (October), 2008 (September-October), and 2009
(August-November) with specific objectives of
4
•
Identifying periods that Singapore was under the influence of transboundary biomass
burning smoke through back trajectory analysis;
•
Examining temporal trends of PM2.5 and PM10;
•
Evaluating effects of transboundary biomass burning smoke on the concentration of
oxalates in PM2.5; and
•
Examining effects of transboundary biomass burning pollutants on the size
distribution of inorganics, oxalates in urban particulates.
5
Chapter 2: LITERATURE REVIEW
2.1 Transboundary Pollution
Sources of air pollution involve both local emissions and long range transported pollution.
The latter (or transboundary pollution) is attributed to atmospheric pollutants transported over
long distances and cause impacts on the environment of receptor sites. While local emission
sources can be minimized or controlled, transboundary pollution affects larger areas and
challenges local or regional policy and regulations.
Impacts of transboundary pollution
include degradation or changes in visibility, human health, climate, etc.
Transboundary pollution can be triggered by dust storm, wildfire, and agriculture burning or
even anthropogenic emissions. Table 2.1 summarizes studies on transboundary pollution in
various regions worldwide, which identified potential pollution sources and impacts on
receptor atmosphere.
2.1.1 Transboundary Pollution of Dust Storm
Dust storm is a natural pollution source declining air quality by increasing particulate matter
and mineral elements in atmospheric aerosols. Liu et al., (2009) concluded that dust storms
from Mongolian and northern China can be responsible for 60–70% of PM10 in Taipei, which
lasted for 2–8 days.
During northeast winter monsoon, the mainland China dust also
contributed to 15 µg/m3 (~30%) of particulates in northern Taiwan (Liu et al., 2009). In
Beijing, with a sampling period from 2001 to 2004, Wang et al. (2006) noticed that
particulates collected on dust days were more basic, and mainly occupied with crustal
pollutions (Na+, Mg2+, Ca2+). Zhang et al. (2009) observed that dust storm from Gobi desert
6
or some regions of Mongolia enhanced mass concentration of particulates and mineral
elements (Mg, Si, Fe, Al, etc.) in Beijing for around two times (Table 2.1). Aymoz et al.
(2004) also mentioned that transported dust storm from Saharan desert was mainly
responsible for the increased concentration of Ca2+ observed in the French Alps, yet weak
interaction with secondary inorganic components (SO42-, NH4+, NO3-).
2.1.2 Transboundary Pollution of Anthropogenic Pollution
Transported anthropogenic emission can cause substantial impacts on other areas.
For
examples, Lin et al. (2005) and Junker et al. (2009) reported that long range transport of
pollution from the mainland China played a significant role degrading air quality in Taiwan
(Table 2.1). Based on an air monitoring program from 1993 to 2006, the long-range transport
of pollutants from the mainland China increased 2.8% of CO concentration per annum, and
doubled SO2 and NOx concentrations from 2001 to 2006 (Junker et al., 2009). Nguyen et al.
(2009) also showed that anthropogenic pollutants from China exerted a significant influence
on ionic compositions (NH4+, SO42-, NO3-, etc) in Jeju island of Korea, especially during
spring (Table 2.1).
2.1.3 Transboundary Pollution of Biomass Burning
Unlike dust storm and anthropogenic pollution, biomass burning such as forest fires,
agricultural burning causes substantial impacts on airborne particulate matters, organic and
inorganic species. Every year, wild fire and agriculture wastes burning in fields (so-called hot
spots) occur in various regions all over the world, including Eastern and Northern Europe,
Southeast Asia, USA, etc. (Niemi et al., 2009; Witham and Manning, 2007; Ward et al., 2006;
Radojevic and Hassan, 1999; See et al., 2006). Often a prolonged dry and hot period is
7
favorable for fire ignition and burning. Many studies showed that transboundary pollution of
biomass burning increases the pollutant concentrations in the receptor areas. For example, in
Europe, wildfire or agricultural burning in Eastern Europe (like Russia, Belarus, etc.) caused
high concentration of PM2.5, monosaccharides and potassium in Helsinki, Finland (Niemi et
al., 2009), or in UK (Witham and Manning, 2007) (Table 2.1). Such smoke episodes can
cause reduced visibility and irritation of eyes and airway, and a mortality rate increasing 0.5–
2% every additional 10 µg/m3 of PM2.5 (Hanninen et al., 2009). In America, transported
smoke of agricultural burning at long distance areas significantly increased the concentration
of PM2.5, monosaccharides, K+, OC/EC, levoglucosan, methodxyphenols, and inorganic
species in Washington state (Jimenez et al., 2006) and Missoula, Monata (Ward et al., 2006)
(Table 2.1). Biomass burning is particularly widespread in the tropics, releasing a large
amount of combustion products to the atmosphere (Crutzen and Andreae, 1990; Fang et al.,
1999; Abas et al., 2004; Graham et al., 2002). During the burning season in Brazil rainforest
in 1999, Graham et al. (2002) recorded a complex mixture of oxygenated compounds from
biomass burning smoke, mostly known as pyrolysis products of cellulose, hemicellulose, and
lignin. In Asia, many studies (See et al., 2006; Kang et al., 2004; Radojevic and Hassan,
1999) reported that transboundary pollution impacts due to biomass burning have worsened
air quality of various receptor countries, and are elaborated below.
8
Table 2.1: Effects of transboundary on atmospheric aerosols
Pollution Receptor
source
site
Dust storm
Dust
Taiwan
storm
Source site
Study period
Inner Mongolia in 2003 – 2006
northern China
Dust
storm
Beijing,
China
Dessert regions of Spring 2005
Mongolian and
northern China
Dust days
Beijing
-
2001 - 2004
Dust
storm
French Alps
Sahara desert
Aug 2000
Measured pollutants
Observation
• Increased PM10 of 24-30%
(during winter monsoon,)
• Increased PM10 of 60-70%
(during dust events)
Mineral dust particles (Mg, • Enriched Zn and Si in fine
Al, Si, P, S, Cl, K, Ca, Ti,
particles,
V, Cr, Mn, Fe, Ni, etc.)
• Enriched Cl in medium
particles
• Enriched other mineral
elements (Cu, Mg, Fe, Al,
etc.) in coarse particles
10 anions (SO42-, NO3-, Cl-, • Coarse particles were more
CH3COO-, etc.), 5 cations
elevated, and aerosols were
(NH4+, Ca2+, K+, Mg2+,
more basic in dust days
+
Na )
• Crustal (Na+, Mg2+, Ca2+)
and pollution ion (K+, SO42-,
Cl-) was main fractions in
dust days
2+
PM10, ionic species (Ca , • A large increase of Ca2+
Na+, K+, Mg2+, etc.), EC,
attributed to dust period.
OC, formate, glutarate,
• Secondary inorganic
oxalate
components (SO42-, NH4+,
NO3-) was enhanced but
weak interactions with
crustal particles
PM10
9
Reference
Liu et al.,
2009
Zhang et al.,
2009
Wang et al.,
2006
Aymoz et
al., 2004
Anthropogenic pollution
Anthropo- Taiwan
The mainland
genic
China
pollution
Anthropogenic
pollution
Taiwan
The mainland
China
Anthropogenic
pollution
Jeju island,
Korea
China
Biomass burning
Wildfire;
Helsinki,
agriculture Finland
burning
1993 – 2006
CO, O3, SO2, NOx, PM10
Nov 1999 –
May 2000
Nov 2000 –
May 2001
Mar – Nov
2006
PM10, SO2, CO
Eastern Europe
(Russia, Belarus,
Ukraine)
1999 – 2007
Biomass
burning
UK
Russia
May 2006
Sep 2002
Biomass
burning
Aveiro,
Portugal
Different inland
regions of Iberian
Peninsula
Summer 2003
Forest fire
burning
Missoula,
Montana,
USA
Western
Montana, USA
Aug – Sep 2003
Biomass
burning
Washington, ~200 km on
USA
eastern
Sep-Nov 2002
Cation: Na+, K+, etc.
Anions: NO3-, Cl-, etc.
PM2.5, monosaccharide
anhydrides, DCAs black
carbon, NO3-, SO42-, K+,
NH4+
PM10, SO2, NOx,
• Significant enhances of
pollutants (SO2, NOx, CO,
PM10) from the mainland
China
• Enhanced PM10, CO and
SO2 of 30 µg/m3, 230 ppb,
and 0.5 ppb due to longrange transport pollutants
• Enhanced ionic (SO42-,
NH4+, Ca2+, Na+, etc.)
composition in PM due to
long-range transport
pollutant ion
•
High concentrations of
PM2.5, monosaccharide
anhydrides, and K+
• High PM10 in Scotland and
north of England
PM2.5, WSOC (SO42-,
• PM2.5 was elevated 2-3 fold,
NH4+, NO3-, etc.), diacids,
high conc. of anhydrosugars
monosaccharides, sugar
and potassium
alcohols, levoglucosan, etc.
PM2.5, monosaccharide
• Significant increase of
anhydride,
PM2.5, organics, and
methodxyphenols, soluble
inorganic
K+
NOx, CO2, OC/EC,
• Enhanced levoglucosan,
levoglucosan
NOx, CO2, OC, and PM2.5
10
Junker et
al., 2009
Lin et al.,
2005
Nguyen et
al., 2009
Niemi et al.,
2009
Witham and
Manning,
2007
Pio et al.,
2008
Ward et al.,
2006
Jimenez et
al., 2006
Forest
fires
Rondonia,
Brazil
Biomass
burning
Seoul,
Korea
Biomass
burning
Kuala
Lumpur,
Malaysia
Biomass
burning
Kuala
Lumpur,
Malaysia
Biomass
Singapore
Washington State
Rondinia
Sep – Oct 1999
Water soluble organic
compounds (aromatic,
aliphatic, dicarboxylic,
tricarboxylic acids, sugar
and sugar alcohols, etc.)
HNO3, HNO2, SO2, NO3-,
SO42-, NH4+, PM2.5, OC,
EC
• Levoglucosan was the most
abundant individual
compounds, aliphatic was
the predominant group
• Increased HNO3, HNO2,
SO2
• (1.6-2.1 times), increased
NO3-, SO42-, NH4+ (4.4-6.1
times) compared to
background concentration
ã Increased PM2.5 (1.3-3.3
times) compared to 24h
standard, 65 àg/m3
ã Increase in OC, EC
Indonesia
June 1997
Solvent extractable organic • Significant increases in
compounds (n-alkanes,
conc. of every organic
alkanoic acids, alkanols,
classes. Examination indices
PAHs)
such as CPI, U:R, Cmax
identified strong vascular
plant wax signatures during
smoke episodes
Southern Sumatra Sep – Oct 1991, Solvent extractable organic • Levoglucosan and palmitic
and Kalimantan,
Aug – Oct
compounds (levoglucosan,
acid were the most
Indonesia
1994, Sep – Oct fatty acids, mono
abundant. Appearances of
1997
saccharides, steroids, etc.)
other organic compounds
during smoke episodes
(plant wax components,
lignin breakdown products,
etc.)
Indonesia
Mar 2001 – Mar Physical (mass
• Increase in PM2.5 and most
Korea and China
Oct-Nov 2001
11
Graham et
al., 2002
Kang et al.,
2004
Fang et al.,
1999
Abas et al.,
2004
See et al.,
burning
Biomass
burning
2002
Brunei
Darussalam
Indonesia
Feb – Apr 1998
concentration, size
chemical components
distribution), chemical (14
approximately by a factor of
ions, 24 metals, EC, OC),
two
and optical properties of
aerosols
PM10, SO2, NO, NO2, O3, • Increase in PM10 during
CO
smoke episode
12
2006
Radojevic
and Hassan,
1999
2.1.4 Transboundary Pollution of Biomass Burning and Particulate Matters
Table 2.2 summarizes effects of transboundary pollution originating from biomass burning on
PM10 and PM2.5. In Helsinki, Finland, biomass burning smoke from Eastern Europe raised
PM2.5 from 8.7 µg/m3 to 49 µg/m3 (Niemi et al., 2009). In USA, Ward et al. (2006) observed
that forest fires from Western Montana increased PM10 to 115 µg/m3, which is a ~5.8 time of
the back ground concentration (20 µg/m3).
In Washington State, Jimenez et al. (2006)
reported that during smoke episodes, major contribution (35%) of PM2.5 was from vegetation
burning (Table 2.1).
In Southeast Asia, haze due to biomass burning smoke is recurrent phenomenon. In Brunei,
during the smoke episode (Feb.–Apr., 1998), particle concentration was enhanced from 20.4
to 109.9 µg/m3 (Radojevic and Hassan, 1999). See et al. (2006) reported that during smoke
episode in 2001, particulate matter in Singapore increased for around two times (from 19.5 to
39.0 µg/m3). In addition to increasing the concentration of particulate matter, transboundary
pollutants originating from biomass burning complicated the chemical composition therein
(Pio et al., 2008; Abas et al., 2004; Fang et al., 1999) with enhanced concentrations (Kang et
al., 2004; See et al., 2006; Niemi et al., 2009) (Table 2.1).
2.1.5 Transboundary Pollution of Biomass Burning and Ionic Species
In Seoul, Kang et al. (2004) observed that NO3-, SO42-, NH4+ during smoke episode increased
by a factor of about 4–6 compared to those during non-episodic periods (Table 2.1). Niemi et
al (2009) also concluded that concentration of biomass burning tracers (levoglucosan,
monosaccharide anhydrides, potassium) peaked during smoke episodes. With investigations
of long-range transported particulates, Sillanpaa et al. (2005) reported elevated concentrations
13
of K+, Ca2+, secondary inorganic species (NO3-, SO42-, NH4+), short chain DCAs (oxalates,
malonates, succinates) of long-range transported biomass combustion aerosols.
These
chemical components have been reported to be generated during biomass combustion or
release of incompletely combusted plant tissue and ash or suspension of soil particles
(Sillapaa et al., 2005). During intense forest fire period in Portugal, Pio et al. (2008) realized
that fine/ coarse ratios of 8 quantified inorganic ions (SO42-, NH4+, Cl-, NO3-, Na+, K+, Ca2+,
Mg2+) increased by a factor of 2 – 4. Especially, the enrichment of K+ in the fine mode
particles was obvious (upto 27.8 times); NO3-, SO42-, NH4+ also reached their highest values
during the intense fire events (Pio et al., 2008). In Singapore, the concentration in most of
chemical components (14 ions, 24 metals, OC) was increased by a factor of 2 during smoke
episodes (March 2001 to March 2002) (See et al., 2006) (Table 2.1).
Biomass burning is recognized as a major source of emissions, contributing large amount of
CO2, inorganic and organic species, particulate organic carbon, and elemental carbon to the
atmosphere. The majority of the particulates produced in biomass burning can be transported
over long distance. Besides elevated ionic species found in transboundary pollutants, a large
amount of organic compounds were also identified in long-range transport aerosols (Fang et
al., 1999; Abas et al., 2004; Ward et al., 2006; Graham et al., 2002; Pio et al., 2008). Among
organic species, dicarboxylic acids, especially oxalic acid, are one of the key components in
organic aerosols because of their high concentration and important role in forming cloud
condensation nuclei (Cruz and Pandis, 1997; Kumar et al., 2003). Following will discuss
short chain DCAs (oxalic, malonic, succinic acids) in bulk particulates (PM2.5), their emission
sources and formation processes.
14
Table 2.2: Effects of biomass burning transboundary pollution on PM10 and PM2.5
Study
period
PM2.5 concentration
Average ± SD (µg/m3)
(Range)
Sampling
location
With trans.
pollution
1999 – 2007 Helsinki,
Finland
25 to 49
Aug to Sep
2003
Missoula,
Montana,
USA
14 Mar,
2001 to 30
Mar, 2002
Singapore
Oct to Nov
2001
Seoul,
131 ± 50.2
South Korea
Without trans.
pollution
8.7
Brunei
Darussalam
With trans.
pollution
39.0 ± 8.3
19.5 ± 3.3
(25.1-76.6)
(9.2-24.8)
40.1 ± 12.0
-
-
Pollutant sources
Study
Without trans.
pollution
-
-
Biomass burning in Niemi et al.,
Eastern Europe
2009
115 (1st event)
20
Forest fire burning
from western
Montana
-
-
Biomass burning in See et al., 2006
Southern Sumatra,
Indonesia
-
-
Agri. burning in
Mongolia & China
Kang et al.,
2004
42 ± 12
27 ± 10
-
Lin et al., 2005
20.4 ± 41.0
109.9 ± 148.7
Biomass burning
(9.0-393)
(1.2-999)
Radojevic and
Hassan, 1999
67 (2nd event)
Nov 1999 to Taiwan
May 2000
and Nov
2000 to
May 2001
1 Feb to 30
Apr 1998
PM10 concentration
Average ± SD (µg/m3)
(Range)
15
Ward et al.,
2006
2.2 Oxalic Acid in Atmospheric Aerosols
Dicarboxylic acids (DCAs) have been identified as a major constituent of the organic
aerosols in urban (Kawamura and Ikushima, 1993), rural (Kawamura et al., 1995; Pio
et al., 2006), polar (Kerminen et al., 1999) and marine atmosphere (Kawamura and
Sakaguchi, 1999; Mochida et al., 2003) in variable concentrations. The presence of
DCAs in the atmosphere may result from primary emissions such as vehicle emission
(Kawamura and Kaplan, 1987; Kleeman et al., 2000) and biomass burning (Pio et al.,
2008; Graham et al., 2002), as well as from secondary photochemical reaction
(Kawamura and Kasukabe, 1995; Warneck, 2003; Wang et al., 2006). DCAs have
received much attention also because of their potential of affecting the radiative
budget of ambient particulates and regional/global climate. Owing to high water
solubility, DCAs have a potential to facilitate atmospheric particles becoming cloud
condensation nuclei (Shulman et al., 1996; Cruz and Pandis, 2000; Kumar et al.,
2003).
Generally, oxalic acid (C2) exhibits a dominant concentration among DCAs in the
atmosphere, followed by malonic (C3) and succinic acids (C4) (Kawamura and
Kaplan, 1987; Kawamura and Ikushima, 1993; Yao et al., 2002). Previous studies
suggested that low molecular weight (LMW) DCAs are produced in the atmosphere
by either photochemical chain reactions of unsaturated hydrocarbons and fatty acids
(Kawamura and Sakaguchi, 1999; Kawamura et al., 1996) or direct emission from
fossil fuel combustion, biomass burning and cooking (Kawamura and Kaplan, 1987;
Narukawa et al., 1999; Schauer et al., 2001, 2002a, 2002b). The concentration of C2,
C3, and C4 DCAs deviated substantially depending on sampling sites, seasons,
background conditions, etc. In urban atmosphere, C2 DCA can vary from 288–1423
ng/m3, while C3 DCA can fluctuate from 62.8 – 177 ng/m3 (Wang et al., 2002; Ho et
16