Functional and inhibitory studies on cystathionine gamma lyase
Bạn đang xem bản rút gọn của tài liệu. Xem và tải ngay bản đầy đủ của tài liệu tại đây (3.47 MB, 151 trang )
FUNCTIONAL AND INHIBITORY STUDIES ON
CYSTATHIONINE-γ-LYASE (CSE)
HUANG SHUFEN
(B. Sc. (Hons.), NUS)
A THESIS SUBMITTED
FOR THE DEGREE OF MASTER OF SCIENCE
DEPARTMENT OF CHEMISTRY
NATIONAL UNIVERSITY OF SINGAPORE
2009
ACKNOWLEDGEMENTS
I would like to thank my supervisor, Dr Tan Choon Hong, as well as Dr Deng Lih-Wen,
Dr Jayaraman Sivaraman and Prof Philip Keith Moore for the use of their laboratory
facilities and their invaluable guidance and support in this project. My appreciations also
go towards Miss Guan Yanyi, Mr Zhao Yujun, Mr Fu Xiao, Mr Tan Yaw Sing and Miss
Chua Jia Hui for their effort in synthesizing the inhibitor candidates, Mr Sun Qingxiang
for his guidance on X-ray crystallography studies, Ms Wang Xiaoning, Ms Liu Jie and
Mr Cheng Fei for their patience in guiding me on molecular cloning and immunoblotting
techniques, as well as members of Dr Tan’s, Dr Deng’s, Dr Sivaraman and Prof Moore’s
labs for their help in this project. Last but not least, I would like to express my gratitude
towards my husband, Mr Bryan Lim for his constant encouragement and emotional
support in my pursuance of the Masters degree.
i
TABLE OF CONTENTS
Acknowledgements .............................................................................................................. i
Table of Contents ................................................................................................................ ii
Summary ............................................................................................................................. v
List of Publications ........................................................................................................... vii
List of Tables ................................................................................................................... viii
List of Figures .................................................................................................................... ix
List of Symbols ................................................................................................................ xiv
1. Introduction .................................................................................................................... 1
2. Tissue H2S assay for screening inhibitors of H2S production........................................ 5
2.1. Objectives ................................................................................................................ 5
2.2. Experimental ............................................................................................................ 5
2.3. Results and discussion ............................................................................................. 7
2.4. Conclusion ............................................................................................................. 13
3. Cloning and expression of recombinant human CSE .................................................. 14
3.1. Objectives .............................................................................................................. 14
3.2. Experimental .......................................................................................................... 15
3.2.1. Preparation of recombinant human CSE plasmids ......................................... 15
3.2.2. Mammalian expression of FLAG-tagged CSE ............................................... 16
3.2.3. Western blotting .............................................................................................. 16
3.2.4. Optimization of bacterial expression of human CSE ...................................... 17
3.2.5. Miniaturized assay of H2S production ............................................................ 18
3.2.6. Bacterial expression of human CSE enzyme .................................................. 19
3.2.7. Purification of human CSE enzyme ................................................................ 19
3.3. Results and discussion ........................................................................................... 22
3.3.1. Construction of recombinant human CSE plasmids ....................................... 22
3.3.2. Expression and determination of H2S synthesizing activity of recombinant
human CSE ............................................................................................................... 23
3.3.3. Purification of human CSE enzyme ................................................................ 26
3.4. Conclusion ............................................................................................................. 32
ii
4. Purified protein assay screen for inhibitors of H2S production ................................... 33
4.1. Objectives .............................................................................................................. 33
4.2. Experimental .......................................................................................................... 33
4.2.1. Kinetics of H2S production from purified recombinant human CSE ............. 33
4.2.2. Protein H2S assay screen for inhibitors of H2S production............................. 34
4.2.3. Determination of H2S standard curve ............................................................. 35
4.2.4. Optimized protein H2S assay screen for inhibitors of H2S production ........... 36
4.3. Results and discussion ........................................................................................... 37
4.3.1. Kinetics of H2S production from purified recombinant human CSE ............. 37
4.3.2. Protein H2S assay screen of various commercially available inhibitor
candidates .................................................................................................................. 39
4.3.2. Protein H2S assay screen of various chemically synthesized inhibitor
candidates .................................................................................................................. 42
4.3.4. Optimization of protein H2S assay screen ...................................................... 44
4.3.5. Redetermination of H2S standard curve .......................................................... 49
4.3.6. Redetermination of inhibition potency of inhibitor candidates ...................... 50
4.4. Conclusion ............................................................................................................. 54
5. Elucidation of the three-dimensional structure of human CSE ................................... 55
5.1. Objectives .............................................................................................................. 55
5.2. Experimental .......................................................................................................... 55
5.2.1. Determination of protein homogeneity via DLS experiments ........................ 55
5.2.2 Screening and optimization of crystallizing conditions ................................... 56
5.2.3. X-ray diffraction and structure determination ................................................ 56
5.2.4. Proteolytic cleavage of CSE ........................................................................... 57
5.3. Results and discussion ........................................................................................... 59
5.3.1. Optimization of protein concentration for crystallization studies................... 59
5.3.2. Screening and optimization of crystallizing conditions for CSE .................... 60
5.3.3. Screening and optimization of crystallizing conditions for CSE-inhibitor
complexes ................................................................................................................. 64
5.3.4. Proteolytic cleavage of CSE ........................................................................... 69
5.4. Conclusion ............................................................................................................. 71
6. Mechanism of H2S production ..................................................................................... 73
Objectives ..................................................................................................................... 73
Experimental ................................................................................................................. 76
6.2.1. Assay of H2S synthesis from various in vivo sulfur-containing compounds.. 76
6.2.2. Cloning of pET-22b(+)_CSE .......................................................................... 76
6.2.3. Bacterial expression and purification of polyhistidine-tagged (His-tagged)
CSE ........................................................................................................................... 76
6.2.4. Optimization of bacterial induction conditions for His-tagged CSE .............. 77
6.2.5. Preparation of mutant CSE clones .................................................................. 78
6.2.6. Bacterial expression of mutant GST-tagged CSE proteins ............................. 78
iii
6.2.7. Optimized procedure for purification of GST-tagged mutant and wild-type
CSE ........................................................................................................................... 79
6.2.8. Analysis of protein secondary structure via circular dichroism (CD)
measurements ............................................................................................................ 80
6.2.9. Comparison of the H2S synthesizing activities of the CSE mutant proteins .. 80
6.2.10. Kinetics of H2S production under varying exogenous PLP concentrations . 80
6.3. Results and discussion ........................................................................................... 82
6.3.1. Assay of H2S synthesis from various in vivo sulfur-containing compounds.. 82
6.3.2. Cloning of pET-22b(+)-CSE .......................................................................... 84
6.3.3. Bacterial expression and purification of His-tagged CSE .............................. 85
6.3.4. Preparation of mutant CSE clones .................................................................. 86
6.3.5. Bacterial expression and purification of mutant GST-tagged CSE proteins .. 87
6.3.6. Analysis of protein secondary structure via CD measurements ..................... 89
6.3.7. Comparison of the H2S synthesizing activities of the CSE mutant proteins .. 91
Mutant CSE proteins affecting the binding of PLP cofactor ................................ 92
Mutant CSE proteins affecting the activation of L-cysteine substrate.................. 95
Mutant CSE proteins affecting the affinity of the enzyme for L-cysteine.............. 99
6.3.8. Kinetics of H2S production in the presence of varying PLP concentrations 102
6.3.9. Proposed mechanism for catalysis of H2S production by human CSE ......... 107
6.4. Conclusion ........................................................................................................... 112
7. Development of a polyclonal antibody specific towards human CSE ....................... 114
7.1. Objectives ............................................................................................................ 114
7.2. Experimental ........................................................................................................ 115
7.2.2. Immunoprecipitation (IP) of endogenous CSE using rabbit antibody serum 115
7.2.3. Purification of anti-hCSE 1366..................................................................... 116
7.2.4. Probing for endogenous CSE levels in various cell lysates .......................... 116
7.2.5. Immunoprecipitation of endogenous CSE using purified anti-hCSE antibody
................................................................................................................................. 117
7.3. Results and discussion ......................................................................................... 118
7.3.1. Testing of anti-hCSE sera ............................................................................. 118
7.3.2. Purification of antibody serum from rabbit 1366 ......................................... 119
7.3.3. Characterization of purified anti-hCSE antibody ......................................... 120
7.4. Conclusion ........................................................................................................... 123
8. Concluding remarks ................................................................................................... 125
Biblography..................................................................................................................... 127
Appendix 1: Forward and reverse primers used for PCR amplification of CSE ............ 132
Appendix 2: Mutagenic primers used for thermal cycling of mutant strands................. 133
Appendix 3: Mechanism for H2S production as proposed in the Honors project. .......... 135
iv
SUMMARY
In recent years, increased interest has been directed towards hydrogen sulfide (H2S) as a
third gasotransmitter and its role in various neurodegenerative and cardiovascular
diseases. Cystathionine-γ-lyase (CSE) is one of the two enzymes believed to be
responsible for the endogenous production of H2S. Research has also shown that
inhibitors of H2S production are effective in reducing the severity of certain diseases
caused by increased endogenous H2S levels. However, these established inhibitors of
CSE exhibit low potency, low selectivity and poor cell-membrane permeability. As such,
we aimed to develop more specific and potent inhibitors of CSE towards H2S production.
To achieve this, various inhibitor candidates were synthesized and tested using a
previously established rat liver homogenate assay. An expression and purification system
for the human CSE enzyme was also developed to enable a more reliable method of
screening of the inhibitor candidates via a purified protein assay, which was optimized
for more efficient trapping of evolved H2S in this work. The X-ray crystal structures of
the enzyme in its apo- and holoenzyme forms, as well as in complex with one of its
inhibitors have also been determined to aid in future rational design of inhibitors. Initial
attempts to co-crystallize the enzyme with some of our inhibitor candidates were also
performed in this work.
Although CSE has been well-known for its role in the transsulfuration pathway, the
biochemical role of the enzyme in production of H2S is currently not well understood.
Hence, we were also interested in the mechanism for CSE-mediated H2S production. This
was achieved via site-directed mutagenesis and kinetic studies on the enzyme. The in
v
vitro release of H2S from various sulfur-containing compounds present in our bodies was
also tested using our purified protein assay. Through these studies, not only were we able
to propose a more detailed mechanism for the catalysis of H2S production, we were also
able to identify crucial residues which may directly affect the binding of inhibitors as
well as certain key functional groups and their distribution within the inhibitor to allow
for increased binding affinity to the enzyme. Lastly, a polyclonal rabbit antibody that is
specific towards human CSE was also developed to serve as a platform for future studies
of the function of the enzyme at the cellular level.
vi
LIST OF PUBLICATIONS
Sun, Q., Collins, R., Huang, S., Holmberg-Schiavone, L., Anand, G. S., Tan, C. H., vanden-Berg, S., Deng, L. W., Moore, P. K., Karlberg, T., and Sivaraman, J. (2009).
Structural Basis for the inhibition mechanism of human cystathionine-gamma-lyase:
An enzyme responsible for the production of H2S. Journal of Biological Chemistry ,
284 (5), 3076-3085.
Huang, S., Chua, J. H., Sivaraman, J., Tan, C. H., & Deng, L. W. (2009). Site-directed
mutagenesis and kinetic studies on human cystathionine-gamma-lyase reveal
interesting insights into the mechanism of H2S production. Paper in preparation.
vii
LIST OF TABLES
Table 1. Percentage inhibition levels for various commercially available compounds
assayed at 10 mM L-cysteine, 2 mM PLP and 5 mM test compound concentrations unless
otherwise stated................................................................................................................... 8
Table 2. Percentage inhibition levels for various chemically synthesized test compounds
assayed at 10 mM L-cysteine substrate, 2 mM PLP and 5 mM test compound
concentrations unless otherwise stated. .............................................................................. 8
Table 3. Effect of various buffers on the polydispersity index of the protein solution, as
measured by DLS at a protein concentration of 1mg/mL and a temperature of 20 °C. ... 29
Table 4. Effect of increasing sodium chloride concentrations on the polydispersity index
of the protein solution. ...................................................................................................... 29
Table 5. A comparison of the kinetic parameters of human CSE when utilizing L-cysteine
or L-cystathionine as substrate.......................................................................................... 39
Table 6. Observations upon addition of a mixture of ZnAc and varying concentrations of
NaOH, and TCA in the presence of ZYJ4291 as a test compound................................... 48
Table 7. Effect of varying protein concentration on the polydispersity index of the protein.
........................................................................................................................................... 60
Table 8. Data collection and refinement statistics for crystallized human CSE enzyme. 61
Table 9. Correlation between logP values and production of H2S for the various mutated
amino acids at 339th position of human CSE .................................................................. 101
Table 10. Relative levels of endogenous CSE in various cell lines. ............................... 122
viii
LIST OF FIGURES
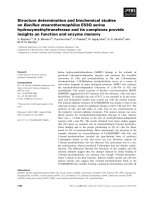
Figure 1. Inhibition profiles and IC50 values of (A) PAG, (B) BCA, (C) N-Boc-L-cysteine
and (D) N-Cbz-D-cysteine determined in the presence of 10 mM L-cysteine substrate... 12
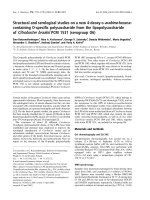
Figure 2. (A) PCR amplification of human CSE for subsequent cloning into pGEX-4T-3,
pcDNA3.1(+) and p3xFLAG-CMV-10. (B) DNA gel electrophoresis of restriction
enzyme cleaved recombinant CSE plasmids. ................................................................... 22
Figure 3. Western blot analysis of the expression of FLAG-tagged human CSE in 293T
cells transfected with recombinant pcDNA3.1(+)-FLAG-CSE and p3xFLAG-CMV-10CSE plasmids. ................................................................................................................... 23
Figure 4. (A) 10 % SDS-PAGE gel showing expression of GST-CSE fusion protein (~66
kDa) under different induction conditions. (B) 10 % SDS-PAGE of total (T), soluble (S)
and insoluble (I) fractions of cell lysates from bacteria induced for 3 h at 30 °C or 18 h at
18 °C. ................................................................................................................................ 24
Figure 5. H2S synthesizing activities (expressed as nmol H2S produced per mg total
protein) of rat liver homogenate, lysates of 293T cells transfected with pcDNA3.1(+)FLAG-CSE or p3xFLAG-CMV-10-CSE and lysates of bacterial cells transformed with
pGEX-4T-3-CSE induced under various conditions. ....................................................... 25
Figure 6. 10 % SDS-PAGE analysis of affinity purification and thrombin cleavage of
GST-CSE. ......................................................................................................................... 27
Figure 7. (A) Anion exchange profile of the affinity pure CSE enzyme. (B) Gel filtration
profile of the protein after ion exchange chromatography................................................ 31
Figure 8. 10 % SDS-PAGE (A) and 6 % native-PAGE (B) gels of the peak gel filtration
fractions and the final purified CSE enzyme after gel filtration chromatography . .......... 32
Figure 9. Relationship between amount of H2S produced in 30 min against amount of
purified recombinant CSE added in the presence of 10 mM L-cysteine substrate. .......... 37
Figure 10. (A) Graph of initial reaction velocity against L-cysteine substrate
concentration in the presence of 2 mM PLP. (B) Logarithmic Hill plot of lg(V/(Vmax-V))
against lg[S]. ..................................................................................................................... 38
Figure 11. Average percentage inhibition values of various L-cysteine analogues, BCA
and PAG assayed at 10 mM concentration in the presence of 10 mM L-cysteine substrate,
2 mM PLP and 10 µg purified CSE. ................................................................................. 40
ix
Figure 12. Inhibition profiles and IC50 values of (A) N-acetyl-L-cysteine, (B) Nisobutyryl-L-cysteine, (C) BCA and (D) PAG determined in the presence of 5 mM Lcysteine substrate, 2 mM PLP and 5 µg purified CSE...................................................... 42
Figure 13. Averaged percentage inhibition values of various synthesized inhibitor
candidates assayed at 0.1 mM, 1 mM or 5 mM concentration in the presence of 2.75 mM
L-cysteine substrate, 2 mM PLP and 5 µg purified CSE (candidates 1 to 6) or 7.5 µg
purified GST-CSE (candidates 7 to 9). ............................................................................. 44
Figure 14. Net A670 readings reflecting the distribution of trapped sulfides when different
amounts of NaOH were added together with ZnAc.......................................................... 47
Figure 15. Relationship between absorbance at 670 nm and amount of H2S produced. .. 50
Figure 16. Average percentage inhibition values of various synthesized inhibitor
candidates assayed at 2.5 mM concentration in the presence of 2.75 mM L-cysteine
substrate, 0.5 mM PLP and 7.5 µg GST-CSE. ................................................................. 51
Figure 17. DLS profile and parameters for the purified CSE protein at 5.0 mg/mL. ....... 60
Figure 18. Optimization of CSE crystallizing condition for X-ray diffraction and
subsequent structure determination................................................................................... 61
Figure 19. Asymmetric units of human CSE determined in this work (A) and by our
collaborator (B). ................................................................................................................ 62
Figure 20. (A) Electron density map around PLP in the CSE holoenzyme. Significant
differences in stereo-overlay of peptide chains around the Tyr-114 (B) and Lys-212 (C)
residues, shown in green (our structure) and yellow (collaborator’s structure). .............. 63
Figure 21. Absorbance spectra of our purified CSE enzyme before and after L-cysteine
incubation, and upon a readdition of equimolar amount of PLP. ..................................... 64
Figure 22. A closed-up view of the active site region of the CSE-PAG complex. ........... 65
Figure 23. Proposed mechanism for the inhibition of CSE by PAG. ............................... 66
Figure 24. IC50 analysis on the inhibition of H2S production from the Y114F mutant CSE
protein by PAG. ................................................................................................................ 67
Figure 25. (A) Spherulites of CSE complexed with 5 mM N-isobutyryl-D-cysteine
formed in 0.1 M BICINE pH 9, 20 % PEG 6000; (B, C) Needles formed around
spherulites 2 weeks later. .................................................................................................. 68
Figure 26. (A) Crystal of CSE complexed with 5 mM N-isobutyryl-L-cysteine in 0.1 M
BICINE pH 9, 20 % PEG 6000, 10 mM ZnCl2; (B, C) ZnCl2 crystals at bottom of well.69
x
Figure 27. 10 % SDS-PAGE gel analysis on the proteolytic cleavage of CSE. ............... 70
Figure 28. Optimization of the proteolysis of CSE by chymotrypsin............................... 71
Figure 29. Alignment of the amino acid sequences of mouse, rat, human, Dictyostelium
(slime mold), yeast and Streptomyces CSE as well as E. coli cystathionine-γ-synthase
(CGS) and cystathionine-β-lyase (CBL)........................................................................... 74
Figure 30. Active site of the human CSE enzyme showing the location of crucial amino
acids (only side chains shown) which would be studied by site-directed mutagenesis. ... 75
Figure 31. A comparison of the net amount of H2S produced over 30 min by 5 mM of
various sulfur-containing compounds. .............................................................................. 82
Figure 32. (A) PCR amplification of CSE for cloning into pET-22b(+). (B) Restriction
enzyme cleaved plasmids indicating the presence of CSE insert which was determined to
be correct upon sequencing. .............................................................................................. 85
Figure 33. 10 % SDS-PAGE gel analysis showing attempted expression of His-tag CSE
in the presence of 0.1 mM IPTG at 20 °C for 20 h (A) and optimization of bacterial
expression conditions (B). ................................................................................................ 86
Figure 34. 0.8 % agarose gel showing PCR amplification of various mutant pGEX-4T-3CSE plasmids. ................................................................................................................... 87
Figure 35. 10 % SDS-PAGE analysis of the induction of GST-tagged mutant and wildtype CSE proteins. ............................................................................................................ 88
Figure 36. Proportion of α-helices, β-sheets, turns and unordered regions of GST-tagged
mutant and wild-type CSE proteins. ................................................................................. 89
Figure 37. Distances (in angstroms) between the polar contacts of the carboxylic acid side
chain of Glu-157 and amino group of Tyr-114 in the CSE holoenzyme (A) and
apoenzyme (B). ................................................................................................................. 91
Figure 38. A comparison of the H2S synthesizing abilities from 5 µg of various GSTtagged CSE alanine mutants against wild-type GST-CSE. .............................................. 91
Figure 39. H2S synthesizing activities of mutant CSE proteins with mutagenic alterations
to the Lys-212, Tyr-114, Asn-161 and Phe-190 residues, assayed in the presence of 5 µg
GST-tagged protein, 0.5 mM PLP and 2.75 mM L-cysteine. ........................................... 94
Figure 40. H2S synthesizing activities of mutant CSE proteins with mutagenic alterations
to the Tyr-60, Arg-62, Ser-340 and Thr-189 residues, assayed in the presence of 5 µg
GST-tagged protein, 0.5 mM PLP and 2.75 mM L-cysteine. ........................................... 96
xi
Figure 41. (left) The human CSE tetramer made up of a dimer of dimers. (right)
Magnification of the interactions between PLP and Tyr-60 and Arg-62 from the adjacent
monomer in subunits C and D of the enzyme. .................................................................. 97
Figure 42. (left) Schematic representation of the hydrogen bonding network involving
Thr-189, Asp-187 and the PLP cofactor. (right) H2S synthesizing activities of mutant
CSE proteins with mutagenic alterations to the Asp-187 residue, assayed in the presence
of 5 µg GST-tagged protein, 0.5 mM PLP and 2.75 mM L-cysteine................................ 98
Figure 43. H2S synthesizing activities of mutant CSE proteins with mutagenic alterations
to the Glu-339 residue. .................................................................................................... 101
Figure 44. Ionic interactions involving Arg-375 before (left) and after (right) the binding
of L-cysteine substrate. ................................................................................................... 102
Figure 45. Amount of H2S produced in 30 min under different exogenous concentrations
of PLP, assayed in the presence of 7.9 µg GST-tagged CSE and 2.75 mM L-cysteine. 103
Figure 46. (A) Graphs of initial reaction velocity, V against concentration of exogenous
PLP determined under various concentrations of L-cysteine substrate. (B) Graphs of
initial reaction velocity, V against L-cysteine substrate concentration for the various
concentrations of PLP that was added in the assay......................................................... 105
Figure 47. (A) Double reciprocal plots for the various concentrations of L-cysteine
substrate that was added in the assay. (B) Secondary plot for determination of the true
Vmax and KM values for L-cysteine. ................................................................................. 106
Figure 48. (A) Double reciprocal plots for the various concentrations of exogenous PLP
that was added in the assay, up to 75 µM. (B) Secondary plot for determination of the
true Vmax and KM values for PLP. ................................................................................... 107
Figure 49. Proposed mechanism for the catalysis of H2S production from L-cysteine by
human CSE. .................................................................................................................... 109
Figure 50. Amount of H2S produced in 30 min under different exogenous concentrations
of PLP, assayed in the presence of 5 µg GST-tagged Y114F mutant CSE and 2.75 mM Lcysteine. .......................................................................................................................... 112
Figure 51. Probing of different amounts of pure CSE (A) and endogenous CSE from
HepG2, 293T and 5 % w/v rat liver homogenate (B) with anti-hCSE sera from either
rabbit 1365 or rabbit 1366. (C) Immunoprecipitation of endogenous CSE from 293T cell
lysates by utilizing antibody serum of either rabbit 1365 or 1366. ................................ 119
Figure 52. Chromatograph of eluted anti-hCSE from HiTrap Protein A column and
volume of 1 M Tris pH 9.0 base needed to neutralize various fractions from the blank run.
......................................................................................................................................... 120
xii
Figure 53. Western blot on purified CSE and endogenous CSE levels in various
homogenates or lysates utilizing anti-hCSE antibody from different immunization
batches............................................................................................................................. 121
Figure 54. A comparison of the relative endogenous CSE levels among various cell
lysates, normalized against β-actin. ................................................................................ 122
Figure 55. Immunoprecipitation of endogenous CSE from 293T, HepG2, K562 and U937
cells. ................................................................................................................................ 123
xiii
LIST OF SYMBOLS
Symbol
Significance
A670
Absorbance at 670nm
BCA
β-cyanoalanine
BME
β-mecaptoethanol
CD
Circular dichroism
CSE
Cystathionine gamma lyase
DLS
Dynamic light scattering
DTT
Dithiothreitol
ECL
Enhanced chemiluminescence
GST
Gluthathione S-transferase
His-tag
Polyhistidine-tag
HRP
Horse raddish peroxidase
IP
Immunoprecipitation
IPTG
Isopropyl-β-D-thiogalactopyranoside
LB
Luria-Bertani
LB-Amp100
LB broth supplemented with 100μg/mL of ampicillin
NNDPD
N,N-dimethyl-p-phenylenediamine dihydro-chloride
PAG
DL-propargylglycine
PLP
Pyridoxal 5’-phosphate
SDS-PAGE
Sodium dodecyl sulfate-polyacrylamide gel electrophoresis
TBS
Tris buffered saline
xiv
TCA
Trichloroacetic acid
V
Initial reaction velocity
ZnAc
Zinc acetate
xv
1. Introduction
Cystathionine-γ-lyase (CSE, EC 4.4.1.1), an enzyme found in mammals and some fungi,
is involved in the reverse transsulfuration pathway (Scheme 1) where L-methionine is
converted to L-cysteine through a series of metabolic interconversions (Rose & Wixom,
1955). Specifically, the role of CSE in this reaction pathway is to convert L-cystathionine
to L-cysteine whilst generating α-ketobutyrate and ammonia. The reaction proceeds via
an α, γ-elimination mechanism where the C-γ-S bond of L-cystathionine is specifically
cleaved to yield L-cysteine (Flavin, 1971). A defect in this metabolic pathway has been
found to be associated with cystathioninuria as well as L-cysteine deficiency and
subsequent impairment of glutathione metabolism (Uren, Ragin, & Chaykovsky, 1978,
Vina, et al., 1995). In humans, CSE activity was detected in adult liver tissue but not that
in fetal liver (Sturman, Gaull, & Raiha, 1970). This was however attributed to posttranslational regulation of CSE gene expression in the developing human liver (Levonen,
et al., 2000). Studies by Levonen et al. (2000) had also identified two isoforms of CSE as
splice variants of one another; the longer being enzymatically more active than the
shorter. Structurally, CSE is composed of four identical monomers of approximately
45kDa with a covalently bound pyridoxal 5’-phosphate (PLP) cofactor in each monomer.
The crystal structure of the enzyme was first depicted from yeast CSE by X-ray
crystallography (Messerschmidt, et al., 2003). In Messerschmidt’s study, factors affecting
the enzymatic specificity of the various transsulfuration enzymes had also been discussed.
Recently, studies on the single nucleotide polymorphic variant of human CSE
(c.1364G>T, Ser403ÆIle) which had previously been found to be correlated with higher
plasma homocysteine concentrations under homozygous conditions
(Wang, Huff,
1
Spence, & Hegele, 2004) had shown that the PLP content and steady-state kinetic
properties of the polymorphic enzyme was similar to that for the normal Ser403 variant
(Zhu, Lin, & Banerjee, 2008). Experiments on the Thr67ÆIle and Gln240ÆGlu mutant
CSE proteins which had previously been identified to lead to cystathioninuria (Wang &
Hegele, 2003) had also revealed that the affinity of the mutant enzymes for PLP was
weakened and that the enzyme activity could be restored by exogenous PLP in this study
(Zhu, Lin, & Banerjee, 2008).
Scheme 1. Reverse transsulfuration pathway present in mammals and fungi.
NH3
OOC
S
β
γ
α COO
NH3
L-cystathionine
L-serine
L-methionine
H2O
Cystathionine
γ-lyase (CSE)
HS
COO
NH3
L-cysteine
COO
+
O
+
NH3
α-ketobutyrate
Cystathionine
β-synthase (CBS)
L-homocysteine
Besides the primary role of the enzyme in the conversion of L-cystathionine to L-cysteine,
studies have also shown that rat liver CSE can utilize L-cysteine as a substrate for
producing H2S gas (Stipanuk & Beck, 1982; Braunstein & Goryachenkova, 1984). This
gas which had previously been primarily regarded as an environmental hazard and toxic
gas, has recently been recognized as a third gasotransmitter besides carbon monoxide and
nitric oxide (Wang, 2002). Other than CSE which accounts for endogenous production of
H2S in the liver, kidney, intestine and vascular smooth muscle cells, the in vivo
production of H2S has also been attributed to cystathionine-β-synthase (CBS) and 3mercaptopyruvate sulfurtransferase for brain and heart tissues respectively (Kamoun,
2004). Studies by Yang et al. (2008) had specifically shown H2S as a physiologic
2
vasorelaxant and that prononced hypertension was triggered in CSE knockout mice
models due to the absence of in vivo H2S production. Characterization of a novel, slowreleasing H2S compound, GYY4137 under in vivo conditions had also shown that the
vasorelaxant effect of H2S occurs via the opening of vascular smooth muscle KATP
channels (Li, et al., 2008). Imbalances in the endogenous H2S levels have therefore been
associated with various diseases such as Alzheimer’s disease (Eto, et al., 2002),
pulmonary hypertension (Li, et al., 2005), haemorrhagic shock (Mok, et al., 2004),
carrageenan-induced hindpaw oedema (Bhatia, et al., 2005a), acute pancreatitis (Bhatia,
et al., 2005b) and endotoxemia (Collin, et al., 2005). In addition, H2S donors such as
sodium hydrosulfide or GYY4137 as well as inhibitors of H2S production such as DLpropargylglycine (PAG) and β-cyanoalanine (BCA) have been found to exhibit
therapeutic potential in various disease models where the severity of the diseases were
found to be alleviated upon administration of these compounds (Szabó, 2007; Li, et al.,
2008). H2S donor compounds and inhibitors of H2S biosynthesis may hence provide
insights into the mechanisms underlying various diseases, or function as therapeutic
drugs. Currently, the two commercially available inhibitors of H2S production, PAG and
BCA possess low potency, low selectivity and limited cell-membrane permeability
characteristics (Szabó, 2007). Therefore, there is a need to develop more effective
inhibitors of H2S production.
To achieve our aim, various L-cysteine and L-cystine analogues would first be tested
using a rat liver homogenate assay. However, due to many problems with this assay, we
proceeded to develop a pure protein assay by cloning, expressing and purifying the
3
human CSE enzyme for subsequent screening of inhibitor candidates. The purified
protein would also be utilized for X-ray crystallography studies for elucidation of the
three-dimensional structure of human CSE so as to aid in the rational design of inhibitors
of H2S production in future. In addition, the expressed protein would also enable us to
further explore the functional role of CSE in the catalysis of H2S production which is
currently not well understood, as well as gain further insights into the mechanism for
production of H2S. These would be achieved via site-directed mutagenesis and kinetic
studies. Lastly, a polyclonal antibody which is specific towards the human CSE enzyme
would be developed and characterized so as to serve as a platform for future functional
studies on this protein.
4
2. Tissue H2S assay for screening inhibitors of H2S production
2.1. Objectives
As mentioned in the introduction, there lies a need in developing more selective and
potent inhibitors of H2S production since the current commercially available inhibitors,
PAG and BCA are relatively weak and less selective. In this section which had been
accomplished during the UROPS project, various commercially available and chemically
synthesized L-cysteine analogues would be tested for their inhibition levels towards H2S
production from rat liver homogenates. Drawbacks of the strategy used for inhibitor
design as well as the tissue H2S assay screen would also be discussed.
2.2. Experimental
A spectrophotometric assay modified from that described by Stpanuk and Beck (Stipanuk
& Beck, 1982) was used for assaying the production of H2S from rat liver homogenates.
All experiments on intact animals were undertaken with adherence to guidelines from the
local National University of Singapore Institutional Animal Care and Use Committee
(IACUC). Upon killing the rats, the livers were removed, cut into small pieces and kept
frozen at
-80 °C prior to the assay. For each assay, a small portion of the rat liver was
thawed and homogenized in appropriate amounts of ice-cold 100 mM KHPO4 pH 7.4
buffer. Stock solutions of PLP and L-cysteine were prepared in 100 mM KHPO4 pH 7.4
buffer. For each test, a duplicate and a baseline control were performed in 1.5 mL
cryovial tubes. A negative control experiment without addition of any test compound was
also performed. Test compounds were either purchased from commercial sources or
chemically synthesized. Trichloroacetic acid (TCA, 10 % w/v, 250 µL) was first added to
5
only the baseline control tubes to stop enzymatic reactions immediately by denaturing
protein once the liver homogenate was added. This was followed by the sequential
addition of saline (10 μL for test compounds dissolved in 100 mM KHPO4 pH 7.4 buffer;
25 µL for test compounds dissolved in DMSO), PLP (50 mM, 20 μL), rat liver
homogenate (5 % w/v, 430 μL), and the test compound (20 μL for compounds dissolved
in KHPO4 buffer; 5 µL for compounds dissolved in DMSO) to each tube. For the
negative control experiment, the same volume of solvent in which the test compound was
dissolved was added instead of the test compound. The tubes were then vortexed and
preincubated on ice for 30 min, after which L-cysteine substrate (10 mM, 20 μL) was
added. The tubes were parafilmed tightly, gently vortexed and incubated in a 37 °C water
bath for 30 min. After incubation, the tubes were cooled on ice. Zinc acetate (ZnAc, 1 %
w/v, 250 μL) was added via needle to trap evolved H2S and all enzymatic reactions were
stopped by addition of TCA (250 μL) via needle. After centrifuging at 4 °C, 10000 rpm
for 2 min, N,N-dimethyl-p-phenylenediamine dihydro-chloride dye (NNDPD, 20 mM,
133 μL) in 7.2 M HCl and FeCl3 (30 mM, 133 μL) in 1.2 M HCl were added for
development of methylene blue. The tubes were centrifuged at 4 °C again, at 12000 rpm
for 4 min. 300 μL of the supernatant from each tube was loaded into a 96-well microplate,
and the absorbance at 670 nm (A670) was measured. The amount of H2S produced was
calculated against a calibration curve of sodium hydrosulfide (NaHS: 0-100 μM) and the
percentage inhibition of each test compound was then determined. For determination of
the IC50 values of potential inhibitors, the assay was performed in varying concentrations
of the inhibitor. The IC50 value was then estimated from the graph of percentage
inhibition versus inhibitor concentration.
6
2.3. Results and discussion
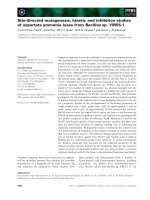
From the commercially available compounds which were tested, N-isobutyryl-L-cysteine,
N-isobutyryl-D-cysteine and N-acetyl-L-cysteine were some of the better inhibitors
besides PAG and BCA which are the two established inhibitors of CSE (Table 1). Our
strategy was hence to synthesize L-cysteine or D-cysteine analogues with modifications
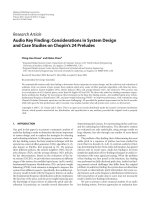
to the amino group. Compounds with substituents attached to the sulfhydryl group of Lcysteine were also synthesized and tested, but these were found to be poorer inhibitors
compared to L-cysteine analogues with only their amino groups modified by the same or
a similar group (Table 2). Modification to both amino groups of cystine also led to a
decrease in inhibition potency. These results suggest that a free sulfhydryl group may
play a crucial role in the binding of the compound to the enzyme’s active site. Although
PAG and BCA do not possess this sulfhydryl functionality, they bind to the enzyme
mechanistically through their amino group unlike these test compounds, which we
believe would bind to the enzyme through other reversible or non-mechanistic means. As
for the N-substituted urea or thiourea L-cysteine derivatives, the urea derivatives
generally fared better than their corresponding thiourea derivatives. The inhibition levels
were observed to increase when the electron-withdrawing property of the thiourea group
was
increased
(from
phenyl-thiourea
to
(3,5-difluoro)-thiourea
to
(3,5-bis-
trifluoromethyl-phenyl)-thiourea), though such a trend could not be established for the
corresponding urea groups. Initially, it was also postulated that D-cysteine rather than Lcysteine analogues, could be better inhibitors of H2S production since both N-isobutyrylD-cysteine and the Cbz-protected D-cysteine analogue exhibited higher inhibition levels
than their corresponding enantiomer. However, this was not observed for the Boc7
protected D- and L-cysteine analogues. Due to the low availability and high cost of Dcysteine as a starting material for synthesis of D-cysteine analogues, subsequent cysteine
analogues were all synthesized from L-cysteine.
Table 1. Percentage inhibition levels for various commercially available compounds
assayed at 10 mM L-cysteine, 2 mM PLP and 5 mM test compound concentrations unless
otherwise stated.
O
O
O
S
OH
OH
OH
NH2
NH2
DL-propargylglycine
94.0 %
NH2
DL-penicillamine
S-methyl-L-cysteine
0.0 %
O
-21.9 %*
O
O
NC
OH
NH2
Beta-Cyanoalanine
100.0 %
N
S
OH
NH2
S-β-(4-pyridylethyl)-L-cysteine
5.6 %
HS
OH
NH2
DL-homocysteine
-106.6 %*
O
O
HS
OH
NH
O
HS
HS
OH
NH
O
N-isobutyryl-L-cysteine
O
O
N-isobutyryl-D-cysteine
*
*
17.3 %
HS
19.9 %
OH
NH
N-acetyl-L-cysteine
24.2 %*
* Compounds assayed at 10 mM concentration.
Table 2. Percentage inhibition levels for various chemically synthesized test compounds
assayed at 10 mM L-cysteine substrate, 2 mM PLP and 5 mM test compound
concentrations unless otherwise stated.
O
HS
O
O
OH
NH
O
N-Boc-L-Cysteine
38.8 %
HS
O
O
OH
NH
O
N-Boc-D-Cysteine
11.9 %
HS
O
OH
NH
N-pivaloyl-L-cysteine
8.1 %
8
O
O
S
OH
NH
HO
NH
O
O
O
O
S
S
O
HS
OH
N,S-dipivaloyl-L-cysteine
N,N-dipivaloyl-L-cystine
-5.3 %
2.0 %
O
HS
O
O
NH
O
OH
NH
CF3
N-(trifluroacetyl)L-cysteine
13.5 %†
O
OH
HS
NH
O
OH
NH
O
S
Cl
S-benzyl-L-cysteine
N-(chloroacetyl)L-cysteine
-28.0 %†
N-(Butyryl)-L-cysteine
3.6 %†
-6.4 %
O
O
HS
O
O
S
OH
NH2
OH
O
NH2
HS
OH
NH
OH
O
O
NH
O
S-(1-phenyl-ethanone)L-cysteine
N-Cbz-L-cysteine
17.2 %^
4.0 %
O
NH
HO
O
S
O
S
O
OH
NH
O
NH
HO
O
7.8 %
S
O
S
O
OH
O
OH
NH
HS
O
OH
NH
N,S-di(benzoyl)-L-cysteine
-28.3 %^
O
S
O NH
HO
S
O
Cl
N,S-di(4-chlorobenzoyl)L-cysteine
N-(2-naphthoyl)-L-Cysteine
8.0 %
14.1 %†
OH
NH
O
NH
31.5 %
O
O
S
O
S
N,N-dibenzoylL-cystine
N,N-diCbzL-cystine
Cl
O
O
O
O
N-Cbz-D-cysteine
27.0 %
O
S
OH
O NH
S
O
N,N-ditosyl-L-cystine
30.0 %
9