Exploring the factors affecting purchase intention of smartphones a study of office workers in ho chi minh city
Bạn đang xem bản rút gọn của tài liệu. Xem và tải ngay bản đầy đủ của tài liệu tại đây (1.57 MB, 78 trang )
EXPLORING THE FACTORS AFFECTING PURCHASE INTENTION OF
SMARTPHONES: A STUDY OF OFFICE WORKERS IN HO CHI MINH CITY
In Partial Fulfillment of the Requirements of the Degree of
MASTER OF BUSINESS ADMINISTRATION
In International Business
By
Mr. Nguyen Dang Hat
ID: MBA04013
September 2013
International University - Vietnam National University HCMC
EXPLORING THE FACTORS AFFECTING PURCHASE INTENTION OF
SMARTPHONES: A STUDY OF OFFICE WORKERS IN HO CHI MINH CITY
In Partial Fulfillment of the Requirements of the Degree of
MASTER OF BUSINESS ADMINISTRATION
In International Business
by
Mr. Nguyen Dang Hat
ID: MBA04013
International University - Vietnam National University HCMC
September 2013
Under the guidance and approval of the committee, and approved by all its members, this
thesis has been accepted in partial fulfillment of the requirements for the degree.
Approved:
---------------------------------------------Chairperson
--------------------------------------------Committee member
---------------------------------------------Committee member
--------------------------------------------Committee member
---------------------------------------------Committee member
--------------------------------------------Committee member
September 2013
Acknowledgements
First and foremost, I would like to express my sincere gratitude and appreciation
to my advisor, Mr. Nguyen Van Phuong, who has always encouraged and supported me
to solve problems of my thesis. He has taught me things beyond my understandings. He
is really a wonderful advisor. I was so lucky to have his encouragements and precious
advices during all of my study.
I would like to give special thanks to all members of my thesis committee for
their insightful comments and advices.
I am very grateful and proud of all teachers at International University who have
gave me precious lessons and useful knowledge during two years. To me, all teachers of
International University are the best teachers who inspire me to keep moving forward.
I would like to appreciate all the supports of respondents in my survey. If they did
not support me, this thesis would not be finished.
To my friends who are also advised by Mr. Phuong, I appreciate all the time we
shared, supported and encouraged each other to keep going ahead to complete thesis.
Now we can be proud of ourselves for what we did.
To my friends who supported me in my research work, I would like to thank them
so much.
Finally, I would like to give special thanks to my beloved parents for always
giving me infinite love, care, belief and supporting me during my research period and
also throughout my life. Mom and Dad, you are wonderful and I am so proud to be your
son.
Plagiarism Statements
I would like to declare that, apart from the acknowledged references, this thesis
either does not use language, ideas, or other original material from anyone; or has not
been previously submitted to any other educational and research programs or institutions.
I fully understand that any writings in this thesis contradicted to the above statement will
automatically lead to the rejection from the MBA program at the International University
– Vietnam National University Ho Chi Minh City.
ii
Copyright Statement
This copy of the thesis has been supplied on condition that anyone who consults
it is understood to recognize that its copyright rests with its author and that no quotation
from the thesis and no information derived from it may be published without the author’s
prior consent.
© Nguyen Dang Hat/MBA04013/2011-2013
iii
Table of Contents
Chapter One – Introduction ............................................................................................ 1
1.1.
Background ......................................................................................................... 1
1.2.
The problem statement ...................................................................................... 1
1.3.
Research question ............................................................................................... 3
1.4.
Research objective .............................................................................................. 3
1.5.
Scope and limitations of research ..................................................................... 3
1.6.
The structure of the study ................................................................................. 4
Chapter Two – Literature Review and Hypotheses Development ............................... 5
2.1.
Literature review ................................................................................................ 5
2.1.1.
Smartphones ................................................................................................. 5
2.1.2.
Technology acceptance model (TAM)......................................................... 5
2.1.3.
Perceived Ease of Use .................................................................................. 8
2.1.4.
Perceived Usefulness.................................................................................... 8
2.1.5.
Self-Efficacy ................................................................................................. 9
2.1.6.
Functional Attributes ................................................................................... 9
2.1.7.
Playfulness ................................................................................................. 10
2.1.8.
Social Influence ......................................................................................... 10
2.1.9.
Users’ Attitude ............................................................................................ 11
2.1.10. Purchase Intention ..................................................................................... 12
2.2.
Hypotheses development.................................................................................. 12
2.2.1.
Proposed research model ........................................................................... 12
2.2.2.
Hypotheses development ............................................................................ 13
iv
Chapter Three – Research Methodology ...................................................................... 17
3.1.
Source of data ................................................................................................... 17
3.1.1.
Primary data ............................................................................................... 17
3.1.2.
Secondary data ........................................................................................... 17
3.2.
Research design ................................................................................................ 17
3.3.
Data Collection Method ................................................................................... 20
3.4.
Procedure for analyzing data .......................................................................... 21
Chapter Four – Data Analysis ....................................................................................... 22
4.1.
Respondents Characteristics ........................................................................... 22
4.2.
Descriptive Statistics ........................................................................................ 25
4.3.
Cronbach Alpha test ........................................................................................ 31
4.4.
Exploratory Factor Analysis (EFA)................................................................ 33
4.5.
Confirmatory Factor Analysis (CFA) ............................................................ 37
4.6.
Structural Equation Modeling – SEM ........................................................... 43
4.7.
Result Discussion .............................................................................................. 46
Chaper Five: Conclusion and Recomendation ............................................................. 49
5.1.
Conclusion ......................................................................................................... 49
5.2.
Practical Implication ........................................................................................ 49
5.3.
Limitation and further recommendation ....................................................... 52
v
List of figures
Figure 1: Original TAM proposed by Fred Davis (Source: Davis, 1986, p.24) ........... 7
Figure 2: New relationship formulation in TAM (Davis 1993, p.481) ......................... 8
Figure 3: Research model ............................................................................................... 12
Figure 4: Sex .................................................................................................................... 23
Figure 5: Age ................................................................................................................... 23
Figure 6: Total working experience .............................................................................. 24
Figure 7: Income ............................................................................................................. 24
Figure 8: Education ........................................................................................................ 25
Figure 9: CFA of the measurement model standardized ............................................ 39
Figure 10 - Structural Equation Modeling result after adjusting theoretical model
(Standardized) ................................................................................................................. 43
Figure 11: Final research model .................................................................................... 46
vi
List of tables
Table 1: Coded items of measurement scale................................................................. 18
Table 2: Respondents Characteristics ........................................................................... 22
Table 3: Variables Descriptive Statistic ........................................................................ 26
Table 4: Result of Cronbach Alpha test........................................................................ 31
Table 5: KMO and Bartlett's Test ................................................................................ 34
Table 6: Total Variance Explained ................................................................................ 35
Table 7: Pattern Matrixa................................................................................................. 35
Table 8: KMO and Bartlett's Test ................................................................................. 36
Table 9: Total Variance Explained ................................................................................ 36
Table 10: Component Matrixa........................................................................................ 37
Table 11: Criteria for measurement model .................................................................. 38
Table 12: CMIN ............................................................................................................... 40
Table 13: RMR, GFI ....................................................................................................... 40
Table 14: Baseline Comparisons .................................................................................... 40
Table 15: RMSEA ........................................................................................................... 40
Table 16: Standardized Regression Weights (Group number 1 - Default model) .... 41
Table 17: Regression Weights ........................................................................................ 41
Table 18: Convergent and discriminant validity and correlation matrix .................. 42
Table 19: SEM – Regression Weights............................................................................ 44
Table 20: SEM – Standardized Regression Weights for main parameters ............... 45
vii
Abstract
It is clearly to say that mobile technology plays a crucial role in how the world
communicates, whether in individual settings or a business. Smartphones have gradually
reducing the people’s dependence of computers or laptops since smartphones allow
people to communicate and do things that have traditionally been done by computers or
laptops. For this reason, more people nowadays buy smartphones. However, the process
of deciding to buy a smartphone of users is varied by a great number of diverse factors.
The main aim of this study is to explore the factors affecting purchase intention of
smartphones of office workers in Ho Chi Minh City. The factors in the research include
self-efficacy, functional attributes, social influences, playfulness, perceived usefulness,
perceived ease of use, users’ attitude and purchase intention. Data were collected from
405 respondents through online and offline survey. Survey results support that
smartphone purchase intention of office workers in Ho Chi Minh City is mostly based on
functional attributes, users’ attitude and perceived usefulness.
viii
-i-
Chapter One – Introduction
1.1. Background
In recent decades, the world has witnessed the great explosion of technology,
especially information technology. Accordingly, many industries have quickly adopted
mobile devices, and personal digital assistant (PDA) is one of the most outstanding
examples. Nowadays, there appears to be a new world with high frequency: “smart
phone” which is a clear evidence for the increasing development of technology and
innovation, especially in young generation and businessmen. Garner (2006) revealed that
total worldwide PDA and smartphone shipment reached 3.65 million units in the first
quarter of 2006, increasing 6.6% compared to that of 2005. Especially, the shipment of
smartphone increased dramatically at 55% year-on-year in the second quarter of 2006.
According to Yu-Ting Huang and Yi-Hsiang Chen (2013), 1.2 billion of smartphone
users appear to exist in 2011. The usage of smartphone increased 36% from 2010 to 2011
and it is forecasted to keep increasing in the next decades.
1.2. The problem statement
An article on provided that in a recent study by Ericsson
Consumer Lab revealed that to the end of 2013, the number of smartphone users in Viet
Nam will reached 21%, increasing 5% compared to the last year and tablet users were
forecasted to keep increasing. Furthermore, this study showed that the frequency of using
smartphone was expected to lift 36% to 40% in 2013. Besides, a similar survey from
Nielsen (2012) showed that 70% Vietnamese people are using mobile phone and 42%
among them are planning to switch to using smartphones. As far as we have witnessed, in
recent years the number of mobile phone service subscribers has significantly increased.
-1-
This is an advantage for Viet Nam telecommunication industry, especially mobile phone
and smartphone market as well.
According to Jan Wassenius (2012) – General Director of Ericsson in Viet Nam,
Laos and Cambodia, keeping upgrading infrastructure quality, together with offering
reasonable price will enables smartphone market to develop significantly in the next
period. Besides, he stressed that it is highly recommended for Viet Nam mobile service
providers to keep maintaining good broadcasting range, high speed and stability in order
to best serve for the development of smartphone market in the next time.
The research firm Gartner found that there would be a trend in using smartphone
among office workers, which is called “Bring your own device”. Due to the result of the
research, workers will be required to use smartphones and tablets by half of all employers
by 2017, in order to fulfill their work needs. Moreover, smartphones can highly support
for the jobs of office workers in Vietnam, while they are now working in modern
environments under the pressure of completing tasks in the office as soon as possible.
Therefore, the demand of buying smartphones is increasing in the office, which suggests
mobile companies to have the products that can meet the needs of a majority of office
workers.
From the current situation of Viet Nam smartphone market and together with the
dynamic nature of information technology field, the writer/author realizes that it is very
useful to make the study relating smartphone users’ inside. However, there are currently
few researches relating to this issue carried and published. The writer himself supposes
that smartphones have greatly contributed to connecting all the people and making the
world smaller. Therefore, the smartphone is considered as innovation, and deserves a
-2-
serious academic study. Form these above reasons, the writer decided to choose his final
thesis topic as follow: EXPLORING THE FACTORS AFFECTING PURCHASE
INTENTION OF SMARTPHONES: A STUDY OF OFFICE WORKERS IN HO
CHI MINH CITY.
1.3. Research question
1. What factors significantly affecting smartphone purchase intention of
office workers in Ho Chi Minh City among following factors: self-efficacy (SE),
social influence (SI), functional attributes (FA), playfulness (PL), perceived
usefulness (PU), perceived ease of use (PEU), user’s attitude (AU), and purchase
intention (PI)?
2. How do critical factors (SE, SI, FA, PL, PU, PEU, AU, and PI) affect
each other in the research model?
1.4. Research objective
The first objective of the study is to identify determinants of smartphone purchase
intention of office workers in Ho Chi Minh City. The second one is to evaluate the
affecting extent of the determinants and which have the impact on the purchase intention
of smartphones. The last one is to offer improvement suggestions for strategic decisions
of companies having businesses in mobile devices.
1.5. Scope and limitations of research
This study focuses on office workers in Ho Chi Minh City. In other words, it does
not represent all consumers in Vietnam. In addition, it may have many factors affecting to
the purchase intention of smartphones that the technology acceptance models cannot
explain.
-3-
Besides, the data used in this research may not be sufficient enough due to the
lack of official data. At last, due of the limitation of time and money, the research survey
was carried out only with small sample size.
1.6. The structure of the study
The research is divided into five chapters:
Introduction: This part introduces background of smartphones and the importance
and development of smartphones today. Besides, the problem discussion and the purpose
of the study is also showed in this part
Literature review and hypotheses development: In Literature Review, theories and
models related to purchase intention of smartphones are reviewed for the theoretical
foundation study. In hypotheses development, based on previous relevant studies, the
reasons why hypotheses are established are clearly stated.
Research methodology: The approach to develop and conduct the research model
is demonstrated in this part
Data analysis and results: Data and results after tests by reliability, validity test as
well as Confirmatory Factor Analysis and Structural Equation Modeling are presented
and discussed clearly. Discussion for results is also included in this part
Conclusions and recommendation: This chapter concludes all ideas, theories and
limitations in study and recommends solutions for further researches about relevant
problem.
-4-
Chapter Two – Literature Review and Hypotheses Development
2.1. Literature review
2.1.1. Smartphones
In the mobile industry, there is no clear industry-standard definition of
smartphones. However, generally, the PDA (Personal Digital Assistant) and the general
mobile phone combine the functions of various applications, using the Internet and the
portable personal computer. It means the smartphone can provide a frame of reference: a
mobile phone with more advantages such a computing ability, combining the functions of
a multimedia player (allowing for music/video storage and playback) and a personal
digital assistant (PDA), offering mobile Internet connectivity, built-in GPS and camera,
and the ability to run a wide variety of third party applications (such as games,
communication software, applications offering weather or traffic information). In general,
smartphones offer advanced computing capability and connectivity when their operating
system is capable of running general-purpose applications.
2.1.2. Technology acceptance model (TAM)
When the demand of electric device with multiple function and application is
increasing day by day, a laptop not handy enough, smartphone market is in hot period
than ever. Mobile phone companies are in strict competition than ever, they continuously
produce new products with new designs, improve functions, and update more
applications, however, products of different companies are quite similar. A numerous
factors were discussed in the reason why users accept and buy different smartphone
systems. Over two decades, based on intention-based models many models were
conducted to examine the differences in the acceptance and adoption of technology such
-5-
as the theory of reasoned action (TRA) by Fishbein and Ajzen (1975), the technology
acceptance model (TAM) by Davis (1985) and its extensions and the theory of planned
behavior (TPB) by Ajzen (1985). In which, the Technology Acceptance Model has been
the only one which has captured the most attention of the information systems
community. While this research aims to clarify the purchase intention of smartphones of
consumers, part of information system community, TAM will be used as a central model
to apply in the research methodology.
In 1985, Fred Davis first proposed TAM model in his doctoral thesis. The basic
conceptual model is that system use is a response that can be explained or predicted by
user motivation, which is directly influenced by external stimulus consisting of actual
system’s features and capabilities. The relationship is shown as follow:
Conceptual model for technology acceptance (Davis, 1985, p.10)
He then developed his model by relying on the theory of reasoned action (TRA) by
Fishbein and Ajzen (1975) and other related researches as the original TAM:
-6-
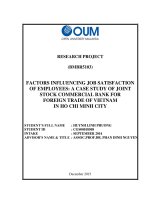
Figure 1: Original TAM proposed by Fred Davis (Source: Davis, 1986, p.24)
User motivation can be explained by three elements: Perceived Ease of Use
(PEOU), Perceived Usefulness (PU) and Attitude toward using the system (ATU). PU is
defined as the degree to which an individual believes that using a particular system would
enhance his or her job performance, PEOU is defined as the degree to which an
individual believes that using a particular system would be free of physical and mental
effort (Davis, 1985).
In the model, ATU was the major determinant that directly affected on user actual
willing to use the system or not. On the other hand, ATU was influenced by both factors
PEOU and PU; meanwhile PU is affected by PEOU. Finally, system designs
characteristics such as wireless Internet, design, multimedia impacted on PU and PEOU.
He continuously conducted further research in TAM and then came up with a new
TAM model in 1993:
-7-
Figure 2: New relationship formulation in TAM (Davis 1993, p.481)
Davis (1993) proposed that in contrast to what he initially hypothesized, PU could
also directly impact on Actual System Use (ASU). At the same time, a new founding was
raised that system characteristic could have direct effect on ATU of consumer toward
using the system without the need for the person to form an actual belief about the
system.
2.1.3. Perceived Ease of Use
Perceived ease of use is the degree to which a person believes that using a tablet
PC or smartphone would be free of effort. Effort is a finite resource that people may
allocate to various activities that they are responsible for (Radner et al., 1975). When an
application is perceived to be easier to use than another one, it is more likely to be
accepted by users (Davis, 1989).
2.1.4. Perceived Usefulness
Perceived usefulness is the degree to which a person believes that using a
smartphone would enhance his or her job performance. People are generally reinforced
for good performance by raises, promotions, bonuses, and other rewards (Pfeffer, 1982;
-8-
Vroom, 1964). Therefore, a system with high-perceived usefulness is one which a user
believes in the existence of a positive use/performance relationship (Davis, 1989).
2.1.5. Self-Efficacy
Self-efficacy is the confidence of the users in learning to use a smartphone. Their
perception of smartphone is easier to use. Self- efficacy does not measure one’s existing
skill set but measure one’s perception on how he or she is complete a task at hand (Kuan
Chin Chen, Jengchung V. Chen, 2011).
2.1.6. Functional Attributes
A product consists of functional attributes that meet personal needs, such as
satisfaction and expectation. Each consumer accepts different functional attributes. If a
consumer does not receive satisfaction from the influential functional attributes, he or she
will not use the product. There is more factor of functionality such as wireless internet,
design, multimedia, application, and after service. According Young Mo Kang et al.
(2011), users who purchase or replace smartphones and analyzed the ways functionality
affect PI of smartphones and PU significantly affects PI directly, while PEOU does not in
adopting smartphones. Beside, a study of Kim, S. H. (2008) with TAM model and
Diffusion of Innovation (DOI) theories indicated perceived applications update (PAU),
perceived available applications (PAA), perceived smartphone company’s willingness to
update operating system (POS), influence of the social network (SN), and
security/privacy (SP). In this study, the functional attributes focus on design,
applications, hardware, and operation system.
-9-
2.1.7. Playfulness
Playfulness is a pleasure or enjoyment which occurs from the assessing of digital
items such as a smartphone. It can cause a positive effect on the purchase intention of a
smartphone. According to the Kim (2011), consumption of goods and services is
frequently associated with emotional response, contributing to an enhanced emotional
value for the consumer. In other words, playfulness shows the degree to which a person’s
interest, feeling, or curiosity, generated from engaging in absorbing interactions with the
smartphone (Moon et al., 2001).
2.1.8. Social Influence
Social influence is defined as the way that people’s behavior, feelings and
thoughts is influenced by other person or a group. Consumers may be susceptible to
social influence by observation, perceptions or anticipations of decisions made by others
in engaging to smartphones (Suki and Suki, 2007). They adjust their beliefs with respect
to the others to whom they feel similar in accordance with psychological principle such
as sense of identity. They are also affected by another who is perceived to be the expert in
the matter at hand or by their referent social groups. Social influence may be represented
by peer pressure, family belief or adulthood whereas. Friends and family members are
seen as social influences that are perceived to be important to consumers in encouraging a
greater dependency on smartphones (Auter, 2007). Klobas and Clyde (2001) found that
social influences have positive impact on the dependency of using smartphones. People
tend to be easier influenced by the words of other (Kelman, 1961) If smartphones make a
good impression on others, consumers’ dependency on them will increase and
consequently will lead to positive word-of-mouth communication to others. Nevertheless,
- 10 -
consumers who are more likely to incorporate and rely on positive word-of mouth
opinions of important others on smartphones will in turn increase their usage rate by
either transforming them into beliefs, or through a process of imitation (Basaglia et al.,
2009).
2.1.9. Users’ Attitude
The concept of attitude is considered one of the most crucial issues being
discussed in the field of consumer behavior. Birgelen et al. (2003) defined attitude as ‘‘a
psychological tendency that is expressed by evaluating a particular entity with some
degree of favor or disfavor”. Malhotra (2005) defined attitude as a summary of appraisal
of an object, and stated that beliefs is very important in person attitude because of its
stability in mind, people have different beliefs in different objects and usually their
beliefs lead them to the objects and change their attitude which can form positive or
negative reaction. Maio and Haddock (2010) argued that both negative and positive
reactions in the psychological science can be reflected in attitude. In fact, attitudes have
demonstrated their efficacies as a predictor’s of behaviours and behavioural intentions in
a variety of contexts including work related behaviours (Morris et al., 2009). In addition,
attitude can be directly related to the environmental responsiveness because Maio and
Haddock (2010) suggested that by holding to their attitude, people are able to determine
the approaches in responding to their environment. By responding to a service or a brand,
people from their attitude measurement based on what they believe and how they feel
about the service or a brand (Farris et al., 2003).
- 11 -
2.1.10. Purchase Intention
Purchase intention can be defined as an advance plan to purchase certain goods or
service in future. This plan may not always lead to implementation because it is affected
by ability to perform (Warshaw & Davis, 1985). In other words, what the consumers
think and will buy in their mind represents the purchase intention (Blackwell, Miniard, &
Engel, 2001). Besides that, purchase intention can also determine the possibility of a
consumer lead to purchase action. Through identifying the intensity of purchase
intention, there is a high possibility to purchase particular product when the purchase
intention is stronger (Dodds, Monroe, & Grewal, 1991; Schiffman & Kanuk, 2000).
2.2. Hypotheses development
2.2.1.
Proposed research model
This study sets a research model with additional external variables. There are four
independent variables such as self-efficacy, functional attributes, social influences and
playfulness. There are four dependent variables such as perceived usefulness, perceived
ease of use, users’ attitude and purchase intention. The research framework is shown in
[Figure 3]
Functional
attributes
Perceived
Usefulness
H1
H2
Social influence
H10
Users’ Attitude
H4
H12
Perceived Ease of
use
H13
H11
H6
H3
H5
Playfulness
H7
H15
H8
H14
Purchase Intention
H9
Self- efficacy
Figure 3: Research model
- 12 -
In this study, the proposed research model is based on the proposal research of Dalsang
Chung and Sun Gi Chun (2008). However, the security and privacy (SP) is not concerned
with this research because security and privacy have not been well protected in Vietnam.
In the study of Park, Y., & Chen. J. V. (2007), self –efficacy had significant impact on
user’s attitude and purchase intention. In addition, Mon and Kim (2001) was proposed
that playfulness was a positive relationship with user’s attitude and purchase intention.
2.2.2. Hypotheses development
Kahn et al. (2011) applied TAM model in their research to analysis factors
affecting adoption of Smartphone. Their research model includes five derived primary
function attribute (wireless internet, design, multimedia, application, and after service).
They indicated that, most research on adoption of Smartphone assumed that Smartphone
is a tool used for specific purpose such as medical usage. Also, they emphasized on the
needs for studying adoption of Smartphone in a holistic approach that cover general
consumers and usage. Verkasalo, et al., (2010) studied adoption of Smartphone using
TAM model to understand users’ intention to use specific Smartphone’s’ applications
including internet access, mapping services, and games. Their research model included
the following variables; behavioral control, technical barriers, social norm, perceived
enjoyment. They highlighted the needs for further research that investigate the impacts of
social norms factors on the adoption of Smartphone adoptions. Kim (2008) indicated that
even though mobile wireless technology market is rapidly growing, studies on key factors
that affecting its adoption is limited.
H1: Functional attributes has the positive impact on perceived usefulness
H2: Functional attributes has the positive impact on user’s attitude
H3: Functional attributes has the positive impact on purchase intention of
smartphones
- 13 -
Ding Hooi Ting, et al (2010) has investigated and made clear the impact of
convenience, social needs and social influences on university students’ dependency and
the impact on purchase behavior of smartphones. The findings showed that there is a
significant and positive relationship between convenience and university students’
dependency on smartphones. Klobas and Clyde (2001) found that social influences have
a positive impact on the dependency of using smartphones. Friends and family members
are seen as social influencers who are perceived to be important to consumers in
encouraging a greater dependency on smartphones (Auter, 2007). Like other innovative
products, the smartphone is an ‘‘experience good’’; consumers must be experienced to
value and are more ambiguous about their potential uses (Kim, 2008). If smartphones
make a good impression on others, consumers’ dependency on them will increase and
consequently will lead to positive word-of-mouth communication to others. Nevertheless,
consumers who are more likely to incorporate and rely on positive word-of-mouth
opinions of important others on smartphones will in turn increase their usage rate by
either transforming them into beliefs, or through a process of imitation (Basaglia et al.,
2009). This leads to the next hypothesis:
H4: Social influence has the positive impact on user’s attitude
H5: Social influence has the positive impact on purchase intention of
smartphones
Farshad Maghnati and Kwek Choon Ling (2013) showed playfulness have
positive relationship with the usage attitude towards the mobile apps in the smartphone
industry. However, aesthetic and service excellence do not have significant positive
relationship with usage attitude towards the mobile apps because most of the respondents
- 14 -