Factors affecting the customers purchase intention the case of online groupon (online purchasing group) in HCMC
Bạn đang xem bản rút gọn của tài liệu. Xem và tải ngay bản đầy đủ của tài liệu tại đây (1.67 MB, 102 trang )
FACTORS AFFECTING THE CUSTOMER’S PURCHASE INTENTION - THE
CASE OF ONLINE GROUPON (ONLINE PURCHASING GROUP) IN HCMC
In Partial Fulfillment of the Requirements of the Degree of
MASTER OF BUSINESS ADMINISTRATION
In International Business
By
Mr. Lu Van Phan Nho
ID: MBA04025
International University - Vietnam National University HCMC
September 2013
FACTORS AFFECTING THE CUSTOMER’S INTENTION - THE CASE OF
ONLINE GROUPON (ONLINE PURCHASING GROUP) IN HCMC
In Partial Fulfillment of the Requirements of the Degree of
MASTER OF BUSINESS ADMINISTRATION
In International Business
by
Mr. Lu Van Phan Nho
ID: MBA04025
International University - Vietnam National University HCMC
September 2013
Under the guidance and approval of the committee, and approved by all its members, this
thesis has been accepted in partial fulfillment of the requirements for the degree.
Approved:
---------------------------------------------Chairperson
--------------------------------------------Advisor: Dr. Ho Nhut Quang
---------------------------------------------Committee member
--------------------------------------------Committee member
---------------------------------------------Committee member
--------------------------------------------Committee member
Acknowledge
This study would not have been completed without the kind guidance and the
support of my supervisor, my family and friends.
First of all, I would like to express my profound gratitude and appreciation to my
supervisor Dr. Ho Nhut Quang for his valuable guidance, advices and recommendations
throughout this research. Thank you for your kind support every time I am in need for
consultation.
I would like to express my great appreciation to all the teachers of the Master’s
program in the International University, who imparted their knowledge and experience to
me during the past two years.
I would like to give special thanks to my beloved family which has been my
inspiration throughout the past time and always been the endless source of joy in my life.
It is also my pleasure to have the opportunity to study with classmates from
MBAIU04 who have shared with me their impressive knowledge and skills during the
challenging courses of the MBA program.
Finally, I would like to thank the members of the Examination Committee for
taking time and giving valuable comments so that I could improve this thesis.
-i-
Plagiarism Statements
I would like to declare that, apart from the acknowledged references, this thesis
either does not use language, ideas, or other original material from anyone; or has not been
previously submitted to any other educational and research programs or institutions. I fully
understand that any writings in this thesis contradicted to the above statement will
automatically lead to the rejection from the MBA program at the International University
– Vietnam National University Ho Chi Minh City.
- ii -
Copyright Statement
This copy of the thesis has been supplied on condition that anyone who consults
it is understood to recognize that its copyright rests with its author and that no quotation
from the thesis and no information derived from it may be published without the author’s
prior consent.
© Lu Van Phan Nho/MBA04025/2011-2013
- iii -
Table of Contents
Chapter One – Introduction ............................................................................................ 1
1.1.
Research Backgroud .......................................................................................... 2
1.2.
Problems Of Research ....................................................................................... 5
1.3.
Research Questions ............................................................................................ 6
1.4.
Research Objectives ........................................................................................... 6
1.4.1.
General objectives ........................................................................................ 6
1.4.2.
Specific objectives ........................................................................................ 6
1.5.
Research Scopes and Limitations ..................................................................... 7
1.6.
Significant Of Research ..................................................................................... 7
1.7.
Structure of Research ........................................................................................ 7
Chapter Two: Literature Review ................................................................................... 9
2.1.
Previous Research ............................................................................................ 10
2.1.1.
Charles Dennis, Bill Merrilees, ChanakaJayawardhena, Len Tiu
Wright’s model .......................................................................................................... 10
2.1.2.
Philip K.Hellier-Gus, M. Geursen-Rodney A. Carr-John A.Rickard’s
model
11
2.2.
Chen And Dubinsky’s Model .......................................................................... 12
2.3.
Conceptual Model of Thesis ............................................................................ 12
2.4.
Related Concepts .............................................................................................. 14
2.4.1.
Purchasing intention.................................................................................. 14
2.4.2.
Perceived customer value........................................................................... 14
2.4.3.
Easy to Use The Website. ........................................................................... 17
- iv -
2.4.4.
Customer Service........................................................................................ 18
Chapter 3 Research Methodology ................................................................................. 19
3.1.
Research Methodology ..................................................................................... 20
3.1.1.
Research frameworks................................................................................. 21
3.2.
Qualitative Research Methods ........................................................................ 21
3.3.
Quantitative Research Methods ...................................................................... 22
3.3.1.
Questionnaire design ................................................................................. 22
3.3.2.
Measures..................................................................................................... 22
3.3.3.
Sampling design ......................................................................................... 23
3.4.
Data Analysis Techniques................................................................................ 23
3.4.1.
Descriptive statistics ................................................................................... 24
3.4.2.
Reliability tests............................................................................................ 24
3.4.3.
Exploratory factor analysis........................................................................ 24
3.4.4.
Correlation testing...................................................................................... 26
3.4.5.
Regression analysis. ................................................................................... 26
3.4.6.
Path analysis .............................................................................................. 29
Chapter Four: Data Analysis and Finding .................................................................. 31
4.1.
Profile of Sample .............................................................................................. 32
4.2.
Characteristics of Sample ................................................................................ 32
4.2.1.
Gender ........................................................................................................ 32
4.2.2.
Age .............................................................................................................. 33
4.2.3.
Experience of online shopping .................................................................. 33
4.2.4.
Highest education ...................................................................................... 34
-v-
4.2.5.
4.3.
Monthly income.......................................................................................... 34
Descriptive Statistics ........................................................................................ 35
4.3.1.
Valence of Experience ............................................................................... 35
4.3.2.
Trust ............................................................................................................ 36
4.3.3.
Product Price .............................................................................................. 37
4.3.4.
Perceived Product Quality ......................................................................... 37
4.3.5.
Perceived Customer Value ......................................................................... 38
4.3.6.
Websites Brand ........................................................................................... 38
4.3.7.
Customer Intention .................................................................................... 39
4.4.
Reliability Tests ................................................................................................ 39
4.4.1.
Valence of Experience ............................................................................... 39
4.4.2.
Trust ............................................................................................................ 40
4.4.3.
Product Price .............................................................................................. 41
4.4.4.
Perceived Product Quality ......................................................................... 42
4.4.5.
Perceived Customer Value ......................................................................... 43
4.4.6.
Website Brand ............................................................................................ 44
4.5.
Exploratory Factor Analysis (EFA)................................................................ 45
4.5.1.
Exploratory factor analysis for independent variables (IDVs) ................ 46
4.5.2.
Exploratory factor analysis for Perceived Customer Value ..................... 49
4.6.
Revision of Research Model And Hypotheses ............................................... 50
4.7.
Reliability Tests After Exploratory Factor Analysis .................................... 51
4.7.1.
Reliability test for Trust & Perceived Quality after EFA ......................... 51
4.7.2.
Reliability test for Product Price after EFA .............................................. 52
- vi -
4.7.3.
Reliability test for Easy to Use Website after EFA ................................... 52
4.7.4.
Reliability test for Customer Services after EFA ...................................... 53
4.7.5.
Reliability test for Website Brand after EFA ............................................ 53
4.7.6.
Reliability test for Perceived Customer Value after EFA......................... 54
4.8.
Correlation Testing .......................................................................................... 55
4.9.
Regression Analysis .......................................................................................... 57
4.9.1.
Linear regression of Model 1..................................................................... 57
4.9.2.
Linear Regression of Model 2 ................................................................... 59
4.9.3.
Linear regression of Model 3..................................................................... 61
4.10. Hypotheses Testing Result ............................................................................... 63
4.11. Relationship between Independent and Dependent Variables .................... 64
4.12. Path Analysis .................................................................................................... 64
Chapter 5: Conclusions and Recommendation ............................................................ 66
5.1.
Summary ........................................................................................................... 67
5.2.
Conclusion ......................................................................................................... 67
5.2.1.
Easy to Use Website ................................................................................... 69
5.2.2.
Customer Service........................................................................................ 69
5.2.3.
Trust and Perceived Product Quality ........................................................ 69
5.2.4.
Perceived Price ........................................................................................... 70
5.2.5.
Perceived Customer Value ......................................................................... 71
5.2.6.
Website Brand ............................................................................................ 71
5.2.7.
Purchase Intention ..................................................................................... 71
5.3.
Limitation And Recommendation For Future Research.............................. 72
- vii -
Appendix 1: The Questionnaires ................................................................................... 76
Appendix 2 – Exploratory Factor Analysis .................................................................. 79
- viii -
List of figures
Figure 1: Definition of group online purchasing ................................................................ 3
Figure 2: Statistics of Sales ................................................................................................. 4
Figure 3: Statistics of Sales 2 .............................................................................................. 4
Figure 4: Charles Dennis, Bill Merrilees, ChanakaJayawardhena, Len Tiu Wright’s
model................................................................................................................................. 10
Figure 5: Philip K.Hellier-Gus, M. Geursen-Rodney A. Carr-John A.Rickard’s model .. 11
Figure 6: Chen and Dubinsky’s model ............................................................................. 12
Figure 7: Conceptual model .............................................................................................. 13
Figure 8: Research frameworks ........................................................................................ 21
Figure 9: Percent of accept or reject questionnaires. ........................................................ 32
Figure 10: Revised Conceptual Research Model .............................................................. 50
Figure 11: Diagram of relationship between independents and dependent variable ........ 64
- ix -
List of table
Table 1: Interpreting Strength of Path Coefficients .......................................................... 30
Table 2: Frequency of gender ........................................................................................... 32
Table 3: Frequency of age................................................................................................. 33
Table 4: Frequency table of experience of online shopping ............................................. 33
Table 5: Frequency table of highest education ................................................................. 34
Table 6: Frequency table of monthly income ................................................................... 34
Table 7: Descriptive statistics of Valence of experience .................................................. 35
Table 8: Descriptive statistics of Trust ............................................................................. 36
Table 9: Descriptive statistics of Product Price ................................................................ 37
Table 10: Descriptive statistics of Perceived Product Quality.......................................... 37
Table 11: Descriptive statistics of Perceived Customer Value ......................................... 38
Table 12: Descriptive statistics of Website Brand ............................................................ 38
Table 13: Descriptive statistics of Customer Intention ..................................................... 39
Table 14: 4.4. Reliability Test of Valence of Experience .............................................. 39
Table 15: Reliability test of Trust first time...................................................................... 40
Table 16: Reliability test of Trust second time ................................................................. 41
Table 17: Reliability test of Product Price ........................................................................ 41
Table 18: Reliability test of Perceived Product Quality ................................................... 42
Table 19: Reliability test of Perceived Customer Value first time ................................... 43
Table 20: Reliability test of Perceived Customer Value second time .............................. 44
Table 21: Reliability test of Website Brand first time ...................................................... 44
Table 22: Reliability test of Website Brand second time ................................................. 45
Table 23: KMO and Bartlett's Test for IDVs .................................................................... 46
-x-
Table 24: Total Variance Explained for IDVs .................................................................. 46
Table 25: Rotated Component Matrix of IDVs ................................................................ 47
Table 26: KMO and Bartlett's Test ................................................................................... 49
Table 27: Total Variance Explained of PCV .................................................................... 49
Table 28: Rotated Component Matrix .............................................................................. 49
Table 29: Reliability Test of Trust & Perceived Quality after EFA ................................. 51
Table 30: Reliability test of Product Price after EFA ....................................................... 52
Table 31: Reliability test of Easy to Use Website after EFA ........................................... 52
Table 32: Reliability test of Customer Services after EFA............................................... 53
Table 33: Reliability test of Website Brand after EFA ..................................................... 53
Table 34: Reliability test of Perceived Customer Value after EFA .................................. 54
Table 35: Pearson's Correlation Coefficient of four independent variables and PCV...... 55
Table 36: Pearson's Correlation Coefficient of WB and PCV with PI ............................. 56
Table 37: Independent and dependent variables of three models ..................................... 57
Table 38: Model Summary and ANOVA table of Model 1.............................................. 57
Table 39: Coefficients for first model............................................................................... 58
Table 40: Model Summary and ANOVA table of model 2 .............................................. 59
Table 41: Coefficients for second model .......................................................................... 60
Table 42: Model Summary and ANOVA table of Model 3............................................. 61
Table 43: Coefficients for Third model ............................................................................ 62
Table 44: Hypotheses Testing Result ............................................................................... 63
Table 45: Direct, Indirect, and Total Causal Effects ........................................................ 65
Table 46: Final results ....................................................................................................... 68
- xi -
Abstract
Starting from a simple business concept, group online purchasing has become a
successful business model and expanded worldwide. A number of researches in this topic
have been conducted in various countries however only few studies have been made in this
field for Vietnamese groupon websites.
This research aims to identify factors affecting customer’s purchasing intention for
the case of online groupon (online purchasing group) in Ho Chi Minh City when they buy
a product or service via Groupon Website.
The literature review comprises of theoretical framework for the research model,
the measurement of five factors mentioned in the model, and questionnaires for the study
of customer’s purchasing intention though Groupon websites.
After data were collected, SPSS software was used for analyzing the primary data.
The results showed that the following factors Easy-to-Use Website, Trust and Perceived
Product Quality, Customer Service, Product Price, Website Brand and Perceived Customer
Value have positive impact on Customer’s Purchase Intention.
Although there are still limitations in terms of this study, the author hopes that the
research findings could be a useful source of reference for managers of Groupon websites
when they want to improve service quality and increase Customer Perceived Value.
Keywords: Online Purchasing Group or Groupon, Customer Purchase Intention,
SPSS, Easy to Use Website, Customer Services, Trust, Perceived Price, Perceived Product
Quality, Valence of Experience, Website Brand, and Perceived Customer Value.
- xii -
Chapter One – Introduction
The first chapter provides an introduction on the current research and
comprises of 9 sections. Research background, rationale of research, research
problem
as well as research question, objectives, methodology, scopes and
limitations, significance of research and structure are presented in this chapter.
-1-
1.1. Research Backgroud
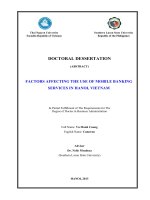
Generally understood as “Groupon = Group + Coupon”, the Groupon is a win-winwin model. Not only online shopping companies/groups are benefited from the Groupon
model, but vendors/supplier/producers and customers (who sell the good or service to the
online shopping companies/groups) also do. Specifically, customers have the opportunity
to buy goods and service at a lower price, approximately 10% to 60% lower as compared
to normal price. Vendors/suppliers/producers can take advantage of the chance to approach
and attract more customers with less expense as compared to other traditional selling
channels. The time duration for selling goods are significantly reduced due to the
stimulated demand over a short time. Online shopping companies could make profit by
grouping the online purchasing of goods and services at dealed discount rate. For example,
for a 55% discount rate product, Groupons earn 5%, and the rest 50% for the customers.
Although the profit margin is low for each deal, Groupons could generate high profit thanks
to the high number of deals made.
Most promotion campaigns are offered in certain periods of time, therefore they
create high attraction and spread. Under the pressure of quantity, customers have to gather
in groups to be able to buy that goods or services.
-2-
Supplier
products
and
services
Website
(advertise
and sell
coupon)
Price of
products or
services ⬇
40 – 90% %
Group of
consumer
s
Figure 1: Definition of group online purchasing
Thanks to recent aggressive development of informatics technology and social
network as well as the introduction of smart mobile devices and most importantly, ecommerce, customers are getting familiar with and fond of online shopping.
According to a recent study of website dealcuatui.com currently there are
approximately more than 100 website offering online Groupon and over 14 websites
gathering deals from offering Groupon service shopping in Vietnam. This reflects the
development potential of Groupon market in the country. Hence, it is important for online
shopping groups to have a deep understanding about the factors influencing the online
buying intention of customers, for example brand of online purchasing groups, type of
product, variety of products, price, delivery policy, method of payment, guarantee policy,
website design to name just a few. Especially in the context of current downturn of many
online purchasing groups, the development suggestion basing on empirical findings from
this study is expected to contribute to the understanding of this market and support for
-3-
operation and management decisions to attract more customers and increase sales for some
online purchasing groups in Ho Chi Minh City.
According to the recent survey made by the website dealcuatui.com, there are 15
most popular Groupon websites on the market, among them are nhommua.com, hotdeal.vn,
muachung.vn and cungmua.com. In 2011, over 6700 deals and 4.2 million vouchers were
sold (statistic in 2011). The amount saved for customers is more than VND 1.200 billion
(statistics of web dealcuatui.com).
Source: dealcuatui.com
Figure 2: Statistics of Sales
Source: dealcuatui.com
Figure 3: Statistics of Sales 2
-4-
It is estimated that the e-commerce sales only accounts for from 0.3% to 0.5% of
total retail sales in Vietnam. The figure 3 is not commensurate with the potential, as there
are more than 31 million people using the Internet, equivalent to 35.5% of the population.
Results of the "Study Monitoring Consumer Electronic Commerce 2012" by Visa has
revealed that Vietnamese have gradually getting used to online shopping and gaining more
trust in online security measures. Therefore, the room for development of Groupon market
in Vietnam is very promising, which is the driver for this research.
1.2. Problems of Research
It can be seen that the online purchasing group market in Vietnam developed
quickly and was quite thriving in the early stage by taking advantage of the newness of the
model and interest of Vietnamese consumers. Moreover, online purchasing groups could
easily approach to a large number of buyers since internet has become popular. Especially
many students and officers prefer online purchasing group service due to some advantages:
lower price, free delivery, convenience, time saving to name just a few.
Currently there are many opposite opinions and even doubts about the success of
this modern selling channel. Some state that Groupon hardly gets success in Viet Nam due
to some reasons such as difficulties in making payment, poor customer care, unguaranteed
product quality, limited knowledge and experience of related partners and so on.
Unfortunately, so far the online purchasing group has not performed stably (see
figure 3. The reasons may come from the negative effects of economic crisis that forced
buyers to pay a lot of attention to their spending. Besides, the quality of products and
service do not satisfy customers. Therefore in order to run a good business, it is highly
recommended for online shopping groups to take into consideration about the customer’s
-5-
buying intention, provide attractive service package to increase customers’ awareness and
offer suitable methods of payment.
From the above reasons, I choose topic as follow:
FACTORS AFFECTING THE CUSTOMER’S PURCHASE INTENTION - THE
CASE OF ONLINE GROUPON (ONLINE PURCHASING GROUP) IN HCMC
The purpose of this study is to define factors affecting customers’ purchase
intention, and then apply business strategy that is most suitable for the enterprise’s real
situation. Moreover, online Groupon is a field of my favorite.
1.3. Research Questions
From problem statement, the research raises the following research question
Which factors will affect the customer’s intention of online purchasing group (online
Groupon).
1.4. Research Objectives
1.4.1. General objectives
Generally, this thesis research will identify some factors affecting the customer’s
purchase intention of online Groupon (online purchasing group) in Ho Chi Minh City.
1.4.2. Specific objectives
To answer the research question, thesis objective will be
- To review theories, previous research so as to build conceptual model for the
research
- To identify factors that have direct and indirect impact on the customer’s
intention toward online Groupon
- To analyze the results and suggest recommends to rate up customer’s intention
-6-
- To give some suggestion and recommendation for current website in other to
increase customer’s intention of online Groupon.
1.5. Research Scopes and Limitations
This thesis mainly focuses on intention of customer whom officers and students
from eighteen to fifty years old in Ho Chi Minh City. Because officers and students are
target customers of online Groupon method. Moreover, Ho Chi Minh City is the main
economic city and a city is the most population in Vietnam.
Secondary data I just collect about 3 years from 2010 to 2013.
1.6. Significant of Research
This thesis is expected to bring the following significant:
To me: This thesis gives me the opportunity to qualify for graduation Master. In
addition, by doing this thesis, it is a good opportunity for me to apply theories, research
methodology, collection data, analysis data that I have studied into the practical situation.
Therefore, these things will help me orientate my career. With the enthusiastic support of
advisor, I can study more knowledge and experience to do research from him
To the online Groupon industry: I hope that this research can find some factors
affecting to customer’s intention of online Groupon after I can give suggestion for the
marketing strategy of company to rate up customer’s intention. As a result, I hope the
Groupon industry can develop quickly
1.7. Structure of Research
The thesis will be design included five chapters as follow
-7-
Chapter One: Introduction
The first chapter provides an introduction on the current research and
comprises of 9 sections. Research background, rationale of research, research problem
as well as research question, objectives, methodology, scopes and limitations, significance
of research and structure are presented in this chapter.
Chapter Two: Literature Review
This chapter focuses on introducing the concepts and theories relating to research
problem of the thesis such as Purchase Intention, Perceived Customer Value, Valence Of
Experience, Easy-To-Use Websites, Customer Services, Trust, Perceived Product Quality,
Perceived Price, Website Brand, etc.
Chapter Three: Research Methodology
This chapter provides detailed explanation of the employed research methodology
and statistical method in this thesis, including the research process, questionnaire design,
sampling design, survey method in addition to statistical techniques for data analysis
Chapter Four: Data Analysis and Findings
The previous chapter discussed the research methodology, Continuous, this chapter
will describe the profile of sample, present the data analysis by Statistical Package for the
Social Sciences (SPSS version 20) and discuss about the finding of this research.
Chapter Five: Conclusion
In this last chapter, the author’s individual conclusions about final results of the
thesis and recommendations for future research are presented.
-8-
Chapter Two: Literature Review
This chapter focuses on introducing the concepts and theories relating to
research problem of the thesis such as purchase intention, perceived customer
value, valence of experience, easy-to-use websites, customer services, trust,
perceived product quality, perceived price, brand, etc.
-9-
2. Literature Review
2.1. Previous Research
This part summaries some previous models which are relevant to the research topic
and are the based for the conceptual model.
2.1.1. Charles Dennis, Bill Merrilees, ChanakaJayawardhena, Len Tiu
Wright’s model
Source: Charles Dennis, Bill Merrilees, ChanakaJayawardhena, Len Tiu Wright (2009)
Figure 4: Charles Dennis, Bill Merrilees, ChanakaJayawardhena, Len Tiu Wright’s
model
As can be seen from the model, Purchase Intention in e-commerce depends on
factors such as attitude of buyer, which can be affected by image of product and customer
service; and trust that the customers have towards products or service.
- 10 -
2.1.2. Philip K.Hellier-Gus, M. Geursen-Rodney A. Carr-John A.Rickard’s
model
Source: Philip K.Hellier-Gus, M. Geursen-Rodney A. Carr-John A.Rickard (2003)
Figure 5: Philip K.Hellier-Gus, M. Geursen-Rodney A. Carr-John A.Rickard’s
model
This model was developed by Philip K.Hellier-Gus, M. Geursen-Rodney A. CarrJohn A.Rickard. The model illustrates factors determining the intention of repurchasing a
service of existing customers. As illustrated, customer satisfaction and Brand Preference
are the key factors for repurchase intention. Besides, other factors are considered such as
Perceived Quality, Perceived Value, Perceived Equity, Customer Loyalty, and expected
switching cost.
- 11 -