Investigating the role of menaquinone metabolism in dormant mycobacteria with antisense RNA
Bạn đang xem bản rút gọn của tài liệu. Xem và tải ngay bản đầy đủ của tài liệu tại đây (1.06 MB, 106 trang )
INVESTIGATING THE ROLE OF MENAQUINONE
METABOLISM IN DORMANT MYCOBACTERIA BY
ANTISENSE RNA
THOMAS M. FIEDLER
NATIONAL UNIVERSITY OF SINAGPORE
2007
Investigating the role of menaquinone metabolism in dormant
mycobacteria by antisense RNA
Thomas M. Fiedler (BSc.)
A thesis submitted for the Degree of Master of Science in Infectious
Diseases
Department of Medical Sciences
National University of Singapore
2007
ACKNOWLEDGEMENTS
First and foremost I would like to thank my supervisor Dr. Markus R. Wenk for giving
me the opportunity to be part of his wonderful lab group. On top of this, I sincerely thank
him and all the people involved in establishing this joint Masters course for their
commitment.
I would also like to express my gratitude towards my mentor Dr. Anne K. Bendt
for providing professional guidance and moral support throughout the course of this
thesis. Special thanks also go to Dr. Guanghou Shui for lending me his expertise
regarding mass spectrometry. My sincere appreciation to all the members of the NUS lab
for making this time in Singapore such an interesting and pleasant experience, thanks
guys!
Kind thanks also to Dr. Thomas Dick, Head of TB unit, for allowing me to use the
facilities at the Novartis Institute for Tropical Diseases (NITD). Special thanks go out to
Dr. Kevin Pèthe and Dr. Srinivasa Rao, who inspired this project and lent a helping hand
on innumerable occasions with all work performed at NITD. Further, I would like to
thank Angelyn Seet, whose help with the cloning work performed in this study was
invaluable. Last but not least, I dearly thank all the people at the TB unit who helped me
out whenever I got stuck.
I
Table of contents
1
Introduction .............................................................................................................1
1.1
1.1.1
Epidemiology ...........................................................................................2
1.1.2
The Pathogen ...........................................................................................3
1.1.3
Pathology .................................................................................................4
1.1.4
Treatment.................................................................................................6
1.1.5
Drug resistance.........................................................................................7
1.2
Dormancy and latent disease ............................................................................8
1.2.1
Dormancy induction .................................................................................8
1.2.2
Mimicking dormancy in vitro: the Wayne model ......................................9
1.3
2
Tuberculosis.....................................................................................................2
Energy metabolism during dormancy .............................................................10
1.3.1
The mycobacterial respiratory chain .......................................................10
1.3.2
A delicate balance?.................................................................................11
1.3.3
Menaquinone (MK)................................................................................12
1.3.4
Biosynthetic pathway of menaquinone ...................................................14
1.3.5
Antisense RNA approach .......................................................................16
1.3.6
Dormancy specific promoters NarK2 and Rv2466c.................................17
1.3.7
Mass spectrometry analysis ....................................................................17
Materials and Methods...........................................................................................19
2.1
Bacterial strains..............................................................................................20
2.2
Media and growth conditions .........................................................................20
2.2.1
7H9: Liquid growth media for aerobic mycobacterial cultures ................20
2.2.2
Dubos: Liquid growth media for anaerobic mycobacterial cultures.........20
II
2.2.3
7H11 agar: Solid media for growth of Mycobacteria ..............................21
2.2.4
LB: Liquid media for E. coli...................................................................21
2.2.5
LB agar: Solid media for E. coli and contamination checks ....................21
2.2.6
ImMedia Kan Blue™ : Solid media for growth of transformed E. coli....22
2.3
Plasmids and cloning procedures....................................................................22
2.3.1
Cloning and expression vectors ..............................................................22
2.3.2
Cloned genes..........................................................................................23
2.3.3
Primer design .........................................................................................23
2.3.4
Polymerase chain reaction ......................................................................25
2.3.5
Visualizing DNA....................................................................................25
2.3.6
Ligation into Primary vector...................................................................26
2.3.7
Transformation of TOP10 E. coli with TOPO2.1....................................27
2.3.8
TOPO Plasmid extraction .......................................................................28
2.3.9
Restriction enzyme double digest ...........................................................28
2.3.10
Gel extraction.........................................................................................29
2.3.11
Ligation into pJEM.................................................................................30
2.3.12
Transformation of TOP10 E. coli with pJEM..........................................30
2.3.13
pJEM plasmid extraction ........................................................................31
2.3.14
Transformation into BCG .......................................................................31
2.3.15
Generating seed stocks ...........................................................................32
2.4
Wayne dormancy model.................................................................................33
2.4.1
Plating out bacteria for CFU counts........................................................33
2.4.2
Lipid extraction with chloroform:methanol 2:1.......................................34
2.4.3
Preparation of MK4 standard..................................................................35
2.4.4
ATP quantification assay........................................................................36
III
2.5
3
Mass Spectrometry analysis ...........................................................................37
2.5.1
HPLC/ESI/MS analysis of polar lipids....................................................37
2.5.2
HPLC/APCI/MS analysis of menaquinones............................................37
Results...................................................................................................................39
3.1
Cloning ..........................................................................................................40
3.2
Transformants harbouring empty vectors .......................................................43
3.3
Growth of menX-NarK2 transformed BCG.....................................................43
3.3.1
Growth of menX-NarK2 transformants in Wayne model.........................43
3.3.2
Troubleshooting variations in OD600 .......................................................45
3.4
Wayne experiments with entC-NarK2 and menB-NarK2 ................................46
3.4.1
Growth of entC-NarK2 and menB-NarK2 in Wayne model ....................46
3.4.2
Troubleshooting variations in OD600 of wild-type cells...........................47
3.4.3
Colony forming units (CFU) of entC-NarK2 ..........................................48
3.4.4
ATP content of entC-NarK2 and WT......................................................52
3.5
Wayne experiments with menC-NarK2 and menD-NarK2..............................53
3.5.1
3.6
4
ATP content of menC-NarK2, menD-NarK2 and WT .............................55
Wayne experiments with menX-2466 .............................................................56
3.6.1
Growth of menA-2466 and entC-2466 in Wayne model ..........................56
3.6.2
CFU of menA-2466 and entC-2466.........................................................57
3.7
Summary of CFU results................................................................................59
3.8
Mass Spectrometry results..............................................................................60
Discussion .............................................................................................................63
4.1
Rationale of this study....................................................................................64
4.2
Discussion of results ......................................................................................65
4.2.1
MenA- and menB-silencing showed no effect..........................................65
IV
4.2.2
MenD-silencing impeded growth slightly ...............................................66
4.2.3
EntC-silencing with both promoters impedes growth..............................66
4.2.4
ATP-quantification uncertain..................................................................67
4.2.5
Detection of menaquinones with mass spectrometry ...............................68
4.2.6
Overcompensation hypothesis ................................................................69
4.2.7
Feedback hypothesis...............................................................................69
4.3
Isoprenic saturation ........................................................................................70
4.4
Future directions ............................................................................................71
5
Conclusions ...........................................................................................................73
6
References .............................................................................................................75
Appendix.......................................................................................................................84
Sequencing results .....................................................................................................85
V
I.
Summary
One of the many alarming discoveries of the late last century was the resurgence
of tuberculosis (TB), a disease caused by the pathogen Mycobacterium
tuberculosis. Great concern is also caused by the fact that mycobacteria have
developed extensive drug resistance over the past decades. The emergence of drug
resistance is partly due to TB therapy being a very lengthy process, the successful
completion of which takes at least 6 months, leading to problems of compliance,
premature termination of therapy and subsequently selection of resistant mutants.
The long treatment time is associated with the pathogens’ ability to switch into a
metabolic state referred to as dormancy. In this state the bacteria cease replication
and develop phenotypic resistance to most of the therapeutic agents in use today.
All these observations have fuelled renewed efforts to develop novel drugs with
greater potency and the capability of targeting dormant bacteria. The goal of the
study described here was to make a contribution to these efforts.
Mycobacteria exclusively use menaquinones (MK) in their respiratory
chain. The fact that humans rely on ubiquinone and do not have the capability to
synthesize menaquinones renders menaquinone metabolism an attractive drug
target. We investigate here if menaquinone is essential for bacterial survival
during dormancy, by inhibiting the translation of genes coding for menaquinone
synthesizing enzymes, through the experimental use of antisense RNA.
To this end, we inserted fragments of eight genes coding for enzymes
thought to be involved in menaquinone metabolism in the antisense orientation,
into two sets of plasmids containing two distinct dormancy-specific promoters.
VI
These plasmids were introduced into Mycobacterium bovis BCG and the resulting
bacterial transformants were cultivated under oxygen limiting conditions that
induce dormancy.
Differences between transformants and wild-type, concerning the
bacteria’s ability to survive hypoxia and synthesize menaquinone, were monitored
by counting colony forming units (CFU) and measuring levels of menaquinones
via mass spectrometry (MS).
Based on our observations of cell growth, cells transformed with a plasmid
carrying an antisense fragment of the gene entC were compromised in their ability
to survive hypoxic conditions. However, an inhibition of menaquinone synthesis
and concurrent drops in menaquinone levels could not be confirmed by
preliminary MS analysis.
VII
II.
Table of figures
Figure 1: World TB incidence.........................................................................................3
Figure 2: Early stage granuloma. ....................................................................................5
Figure 3: Growth curves of Wayne dormant cultures…………………………………...9
Figure 4: Mycobacterial respiratory chain.....................................................................11
Figure 5: Quinones .......................................................................................................12
Figure 6: Menaquinone synthesis in mycobacteria ........................................................15
Figure 7: 1kb plus DNA ladder.....................................................................................26
Figure 8: TOPO 2.1 vector map....................................................................................27
Figure 9: MRM ............................................................................................................38
Figure 10: PCR products...............................................................................................40
Figure 11: Restriction digest .........................................................................................41
Figure 12: pJEM vector map.........................................................................................42
Figure 13: Growth curves of menX-NarK2 transformants.............................................44
Figure 14: Growth curves of menB-NarK2 and entC-NarK2 transformants...................46
Figure 15: Day7 entC-NarK2 plates..............................................................................48
Figure 16: Day 20 entC-NarK2 plates...........................................................................49
Figure 17: CFU counts for menB-NarK2, entC-NarK2 transformants ...........................50
Figure 18: Plates and CFU counts of second entC-NarK2 experiment...........................51
Figure 19: ATP content of entC-NarK2 transformants from first experiment ................52
Figure 20: Wayne growth curve of Cnar and Dnar transformants..................................53
Figure 21: CFU counts of Cnar and Dnar transformants................................................54
Figure 22: Dnar plates day 20 .......................................................................................54
Figure 23: ATP content of Cnar and Dnar transformants...............................................55
Figure 24: Growth curves of menB-2466 and entC-2466 transformants ........................56
VIII
Figure 25: entC-2466 Day 40 plates..............................................................................57
Figure 26: CFU counts for menA-2466 and entC-2466. ................................................58
Figure 27: Q-TOF MK9 relative amounts. ....................................................................60
Figure 28: QTRAP-MRM plot of different menaquinone species..................................62
Figure 29: QTRAP-MRM plot of different menaquinone species..................................62
Table 1: Primers used for PCR reactions.......................................................................24
Table 2: Summary of CFU results................................................................................59
IX
III.
List of abbreviations
ATP = Adenosine triphosphate
Anar, Bnar … = menA-NarK2, menB-NarK2...
BCG = Bacille Calmette-Guérin
bp = Base pairs
CFU = Colony forming units
DOTS = Direct observed therapy short-term
HIV = Human immunodeficiency virus
LC-MS = Liquid chromatography-mass spectrometry
menX = Genes coding for enzymes involved in menaquinone biosynthesis
MK = Menaquinone
MS = Mass spectrometry
NarK2 = Promoter region of nitrite extrusion channel
NADH = Nicotinamine adenine dinucleotide
NDH = NADH dehydrogenase
NRP1 and 2 = Non-replicating persistence 1 and 2
Q-TOF = Time of flight
QTRAP = Quadrupole ion trap
RLU = Relative luminescence units
SDH = Succinate dehydrogenase
TB = Tuberculosis
WHO = World Health Organization
WT = wild-type
1
1
Introduction
1
1.1 Tuberculosis
1.1.1 Epidemiology
Tuberculosis (TB) is a common and deadly bacterial disease caused by the infectious
agent Mycobacterium tuberculosis (Mtb). Evidence of tubercular decay recently detected
in spines of Egyptian mummies impressively illustrates just how long this organism has
been an unwelcome companion to the human race (32, 59). However, in spite of its long
history, TB is not a problem of the past, as it has firmly resisted all the great efforts
humans have undertaken to get rid of this scourge and it is now becoming apparent that,
after initial success of chemotherapy in the second half of the 20th century, the disease is
resurging due to rising numbers of HIV infections, neglect of TB prevention programs
and the emergence of drug resistant strains (23, 57). Today the World Health
Organization (WHO) estimates that about a third of the world population is infected with
asymptomatic, latent TB, that 9 million people get infected each year and that
approximately 2 million die of active TB per year, which makes TB the deadliest
bacterial infectious disease of our day. High numbers of infections occur all along the
equator from Africa over the Middle East to Southeast Asia with China and Russia also
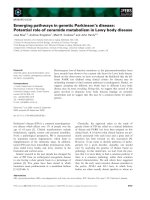
sharing a big part of the global TB burden (Figure 1). Out of all countries affected, South
Africa displayed the highest incidence of cases and India had the largest number of active
infections with over 1.8 million cases in 2004 (13).
2
Figure 1: World TB incidence. Cases per 100,000; Red = >300, orange = 200-300; yellow = 100-200;
green = 0-100 and grey <50. Data from WHO, 2006
1.1.2 The Pathogen
M. tuberculosis (Mtb) is a slow-growing, rod-shaped, aerobic bacterium that divides
every 16-20 hours. It belongs to the family of Actinomycetes and is closely related to
Corynebacteria, Streptomyces and Nocardia. As it has only one outer membrane, Mtb is
considered to be a Gram-positive bacterium. However, as a result of its lipid rich cell
wall, it only stains poorly upon performance of Gram staining (35). On the other hand,
Mtb can be successfully stained after being treated with acidic solutions and hence can be
classified as acid-fast bacilli (AFB) (35). One closely related species of Mtb of great
importance to researchers is Mycobacterium bovis, the causative agent of a tuberculous
disease in cattle. An attenuated strain of M. bovis, named Bacillus Calmette-Guérin
(BCG), in honour of its developers, was created for the purpose of using it as a vaccine
against TB. Although widely put to use, its efficacy has always been a matter of much
3
doubt and discussion, since results of studies investigating the protective efficacy of BCG
vaccination are highly variable and inconsistent. Furthermore there is some evidence that
revaccination does not improve the protective efficacy and can even cause adverse effects
(3, 18, 19). Apart from its original role as a vaccine, BCG is cultivated for research
purposes in numerous laboratories all over the world, to serve as the most relevant nonpathogenic model organism for in vitro studies in place of M. tuberculosis.
The knowledge gained about the biology of mycobacteria by conducting research
on BCG is not restricted to aiding the fight against M. tuberculosis alone. There are
numerous environmental species of mycobacteria that have been identified as being the
source of tuberculous diseases in humans such as M. avium and M. fortuitum, which
opportunistically cause infections in immuno-compromised individuals (12, 54). In
addition, mycobacterial species are the cause of other major, non-tuberculous diseases
such as M. leprae, the causative agent of leprosy and M. ulcerans the causative agent of
the severely neglected disease Buruli Ulcer.
1.1.3 Pathology
The mycobacteria enter the body through the airways as aerosols expelled by an infected
individual when coughing or sneezing. When they reach the pulmonary alveoli they
invade alveolar macrophages and set up a primary focus of infection known as Ghon
focus (36). Inside the macrophages the bacteria can effectively prevent the fusion of
phagosome and lysosome thereby evading destruction (2, 31, 48). Chemokines and
cytokines secreted by the invaded macrophages attract neutrophiles, monocytes, T- and
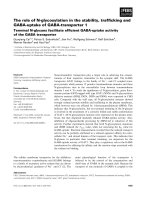
B-cells, which then aggregate around the site of infection forming a granuloma, thus
walling the infectious agent off and preventing the disease from spreading (Figure 2).
4
Figure 2: Early stage granuloma. Macrophages form the centre and inner layer, surrounded by lymphocytes
(Picture taken from: “Who put the tubercle in Tuberculosis?”, (41))
Granuloma formation also enables immune cells to communicate more effectively with
each other (5). In early stages of the immune response macrophages can be activated by
T-cells, which helps them resist the phagosome maturation arrest and delivers the bacteria
to an environment with lower pH value. This measure does not achieve effective killing
but clearly affects the bacteria’s ability to divide (41, 44). In the centre of the granuloma,
infected macrophages eventually fuse to giant multinucleated cells. During the Delayed
Type Hypersensitivity (DTH) reaction of the immune system, activated cytolytic T-cells
kill infected macrophages and their pathogenic cargo leading to destruction of the
surrounding tissue and necrosis (25). This necrotic tissue can develop into a caseous
lesion, named thus for its whitish, ‘cheesy’ appearance and smell. Caseous lesions have
been shown to harbour populations of dormant bacteria that are metabolically virtually
inactive, yet manage to stay viable over a very long time, possibly even decades (34).
Ridding patients of these dormant bacteria is one of the major challenges faced by current
TB treatment for several reasons. For one thing it is difficult for the drugs to enter the
core of these granuloma in sufficient concentrations, second the bacteria increase the
5
thickness of the cell wall upon entering dormancy protecting them from being targeted by
agents and finally most drugs currently used in TB chemotherapy were selected for their
ability to kill actively replicating cells (14, 58).
1.1.4 Treatment
Current treatment against active TB infections includes administration of the four drugs
rifampicin (RMP), isoniazide (INH), pyrazinamide (PZA) and ethambutol (EMB) for two
months, and RMP and INH alone for a further four months. The drugs have to be taken
daily during the first two months and three times a week for the remaining four months of
treatment (10). Long duration of treatment is among the biggest problems posed by
tuberculosis resulting from the tenacity with which the pathogen endures the activity of
therapeutic agents.
To ensure patients compliance over the course of the whole six months, WHO has
started the worldwide introduction of the Direct Observed Therapy Short term (DOTS)
program in 1995. The core idea is that the treatment has to be surveyed extensively in
order to ensure the patient’s compliance over the whole course of treatment. Over and
above this, the program aims at increasing political commitment in the fight against TB
and improving drug supplies, case detection and monitoring systems all over the world
(52).
6
1.1.5 Drug resistance
Over the last decades, increasing numbers of drug-resistant strains have arisen all over
the world. This development is largely due to inadequate treatment, patients not adhering
to the prescribed treatment regimen, premature termination of therapy or low quality
medication, all of which may lower the chances of total clearance of infection and set the
stage for resistant strains to crop up (13, 23). Drug resistance is an especially important
issue in developing countries, largely owing to the high cost of treatment and the
infrastructure needed to ensure steady supplies and sufficient surveillance of the patient’s
compliance (20).
Multidrug-resistant TB (MDR-TB) is defined as resistance to rifampicin (RMP) and
isoniazid (INH), the two most effective first line TB drugs. A patient infected with MDRTB must receive treatment with alternative, second-line drugs that are less potent, exhibit
more side-effects than RMP and INH and must be taken for at least 18 months (39).
Clearly this complication of the already lengthy and difficult treatment of a normal TB
infection causes even greater inconvenience for the patient and results in even bigger
problems of compliance. To make matters worse, some strains have developed into
extensively drug-resistant TB (XDR-TB), which basically is MDR-TB with additional
resistance to any fluoroquinolone and at least one of the three injectable second-line
drugs. Cases of XDR-TB have been confirmed all over the world including Central
Europe (10). For patients infected with such a strain, surgical removal of infected tissue
often remains the last hope. This desperate situation, brought about by the emergence of
resistant strains and the low success rate of their treatment, has rekindled the field of TB
research and fuelled renewed efforts to find novel drug targets.
7
1.2 Dormancy and latent disease
1.2.1 Dormancy induction
The pathogen’s talent for resisting our pharmaceutical assaults with a certain nonchalance
stems largely from its ability to go dormant (17). Dormancy is defined as a period of
suspended development or non-replication and minimal metabolic activity, that allows an
organism to conserve energy. Mycobacterial dormancy can be triggered by nutrient
starvation, elevated nitrate levels and oxygen deprivation (14, 26). The focus in this work
lies on the mechanism of oxygen-deprivation induced dormancy.
If Mtb resides in the lung, how can it ever run out of oxygen? As has been pointed
out before, mycobacteria do not just reside freely in the lung, but rather induce the
formation of highly structured cell aggregates termed granuloma. During granuloma
formation, more and more immune cells are being recruited to the site of infection and
pack tightly together. They presumably grow so tight that oxygen cannot freely diffuse to
the centre of the granuloma anymore. In later stages, the blood vessels retreat depriving
the inner region of its last means of fresh oxygen supply and leaving the bacteria in an
environment that grows ever more anaerobic (41). Although mycobacteria are historically
regarded and classified as obligate aerobes, which is true insofar as they need oxygen in
order to replicate, this does not mean they cannot survive extended periods of hypoxia.
Decreasing oxygen levels elicit a primary signal, the nature of which thus far has evaded
detection, and results in the activation of the two-component signalling system
DosR/DosS/DosT (8). DosS and DosT code for sensor kinases that autophosphorylate at
a histidine-residue and then transfer phosphate to an aspartate-residue of the transcription
factor DosR, which in turn controls expression of the 47-gene dormancy response regulon
8
(40). By orchestrating an orderly transition into dormancy, the regulon enables
mycobacteria to survive hypoxia, nutrient starvation and drug treatment. Populations of
these dormant bacteria are thought to be capable of causing recurrence of disease years
after the initial infection has been cleared.
1.2.2 Mimicking dormancy in vitro: the Wayne model
The temporal transition from aerobic to anaerobic conditions encountered by the bacteria
in a granuloma are mimicked in the laboratory using the Wayne dormancy model (50).
To set up a Wayne experiment, synchronized mycobacterial liquid cultures are distributed
into airtight tubes, placed on magnetic stirrer platforms at 37°C and subjected to gentle
stirring, to ensure a homogenous culture and a controlled rate of oxygen consumption.
This allows the bacteria time to adapt to the changing conditions. As the available oxygen
is gradually consumed the bacteria progress from exponential growth phase through NonReplicating Phase 1 (NRP1) at an oxygen saturation of 1%, into Non-Replicating Phase 2
(NRP2) or dormancy at an oxygen saturation of 0.06% (Figure 3) (9).
Wayne dormant cells vs. Aerobic cells
10
OD600
1
Wayne-1
Wayne-2
Wayne-3
aer-1
aer-2
aer-3
0.1
NRP 1
NRP 2
0.01
0
2
4
6
8
10
12
14
16
18
20
22
24
26
28
Days
Figure 3: Growth curves of Wayne dormant cultures. aer = aerobic; Wayne = dormant
(A-K. Bendt, personal communication)
9
1.3 Energy metabolism during dormancy
1.3.1 The mycobacterial respiratory chain
The evident correlation between oxygen deprivation and dormancy induction makes a
closer look at respiration in mycobacteria worthwhile.
Respiratory chains in general are made up of fairly immobile protein complexes
lodged in the membrane, and of mobile quinones that can diffuse along the membrane
and shuttle electrons from one complex to another. Some of the protein complexes, called
dehydrogenases, accept electrons from NADH on the inside of the cell and hand them
over to menaquinones, which in turn deliver the electrons to other protein complexes, the
oxidases or reductases. In a final step, oxidases pass the electrons on to the terminal
electron acceptor oxygen on the outside of the cell, whereas reductases use alternative
electron acceptors like nitrate on the inside of the cell. Several of these protein complexes
can translocate protons across the membrane while passing on electrons, thereby
establishing and maintaining a membrane potential (53).
Mycobacteria possess two known NADH dehydrogenases (NDH 1 and NDH 2)
and a succinate dehydrogenase (SDH), all of which can feed electrons into the chain
(Figure 4). NDH1 is a proton-pumping NADH-dehydrogenase, which is down-regulated
during NRP1, whereas the production of the non-proton pumping NDH2 is increased,
with the result that the proton motive force is lessened and ATP production reduced,
indicating a cut in energy requirements (51). The only detectable quinone in
mycobacteria is menaquinone (MK). Menaquinone acts as a centrepiece, as it can accept
electrons from NDH1, NDH2 as well as SDH and pass them on to the cytochromeoxidases or nitrate reductase.
10
Mycobacteria employ two different cytochromes, the aa3-type cytochrome c and the
cytochrome bd. Both are oxidases that pass on the electrons to the terminal electron
acceptor oxygen. Cytochrome c is bioenergetically more effective and is used during
normal growth. Cytochrome bd is less effective but shows higher affinity towards oxygen
and is therefore upregulated under microaerophilic conditions. Hypoxic conditions also
induce expression of the Nar operon, which controls genes coding for the nitrate
reductase (Nar) complex that can use nitrate as an alternative terminal electron acceptor.
Despite our knowledge on the mycobacterial respiratory chain under aerobic conditions
and NRP1, it must be emphasized that the energy metabolism during NRP2 remains a
poorly understood riddle yet to be unravelled.
Figure 4: Mycobacterial respiratory chain (picture taken from: “Tuberculosis- metabolism and respiration
in the absence of growth”, (9))
1.3.2 A delicate balance?
One of the hallmarks of dormancy is the metabolic downshift and the concurrent
reduction of ATP synthesis to only a fraction of what it had been during aerobic growth.
Since dormant bacteria are much more sensitive than aerobic cells to decoupling of the
proton gradient by nigericin (Srinivasa Rao, Kevin Pèthe; unpublished results), it can be
11
reasoned that this low level of ATP production is crucial for the maintenance of an
energized membrane and consequently essential for the bacteria’s survival. The
remaining metabolic activity in a dormant cell could therefore be likened to a very strict
diet, a narrow window of opportunity that allows the bacteria to survive under such
adverse conditions.
This ‘delicate balance’ might be easily disturbed if pressure is applied at the right
point. As has been mentioned earlier, it is poorly understood what metabolic activity is
needed to ensure that the cellular membrane of M . tuberculosis remains energized during
NRP2. We intend to investigate whether menaquinones play a central role in these
processes.
1.3.3 Menaquinone (MK)
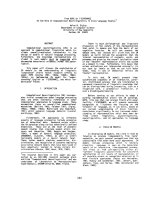
As mentioned in section 1.3.1, quinones constitute the mobile element of the respiratory
chain. There are two major types of quinones namely ubiquinones (UQ) and
menaquinones (MK).
O
H
n
O
MK
O
O
O
H
n
O
UQ
Figure 5: Quinones, electron shuttles of the plasma membrane. Head groups encircled;
MK = menaquinone, UQ = Ubiquinone
12