Investigation of the adsorption of biomolecules using surface plasmon fluorescence spectroscopy and microscopy
Bạn đang xem bản rút gọn của tài liệu. Xem và tải ngay bản đầy đủ của tài liệu tại đây (1.94 MB, 83 trang )
INVESTIGATION OF THE ADSORPTION OF
BIOMOLECULES USING SURFACE PLASMON
FLUORESCENCE SPECTROSCOPY AND
MICROSCOPY
NIU LIFANG
(Department of Chemistry, NUS)
A THESIS SUBMITTED
FOR THE DEGREE OF MASTER OF SCIENCE
DEPARTMENT OF CHEMISTRY SCIENCE
NATIONAL UNIVERSITY OF SINGAPORE
2004
Acknowledgements
This work was done with the help and instructions of many colleagues and friends,
and it is my pleasure to acknowledge their contribution. I’d like to give my greatest
respects to my two supervisors, Prof. Wolfgang Knoll and Dr. Thorsten Wohland, for
their always passionate support to this work. I am also grateful for many enlightening
discussions with Dr. Evelyne Schmid and Dr. Rudolf Robelek.
CONTENTS
SUMMARY
ⅰ
LIST OF TABLES
ⅲ
LIST OF FIGURES
ⅳ
MAIN BODY OF THESIS
1. INTRODUCTION
1
2. THEORY
9
2.1 Surface Plasmon Resonance
9
2.1.1. Electromagnetic Fields and Maxwell Equation of Plane Waves at Interface
10
2.1.2 Surface Plasmon
12
2.1.3 Plasmon Surface Polaritons at a Noble Metal/Dielectric Interface
13
2.1.4 Excitation of Surface Plasmons
16
2.1.5 Surface Plasmon Spectroscopy
19
2.2 Fluorescence
23
3. EXPERIMENTAL METHODS
27
3.1 Surface Plasmon Spectroscopy
27
3.2 Surface Plsmon Fluorescence Spectroscopy (SPFS)
30
3.3 Surface Preparation Methods
37
4. RESULTS
41
4.1 Theoretical Considerations
42
4.2 Energy Transitions for Fluorescence near Metal Surfaces
43
4.3 SPFS Recording of Adsorption of Labeled Streptavidin to Functionalized Surface 46
4.4 Monitoring DNA Hybridization Reactions by SPFS
47
4.5 Surface-Plasmon Field-enhanced Microscopy and Spectrometry
54
4.5.1 Introduction
54
4.5.2 Experimental Preparation
57
4.5.3 Experimental Results
61
BIBLIOGRAPHY
74
Summary
The development and characterization of biomolecule sensor formats based on the
optical technique Surface Plasmon Resonance (SPR) Spectroscopy were investigated.
The study can be divided into two parts of different scope: In the first part the
working mechanism and typical experiments of Surface-plamon Field Enhanced
Spectroscopy (SPFS) were studied. In the second part the ideas were extended to the
development of fluorescence spectrometry and microscope formats.
Fluorescence molecules could be excited in the evanescent surface plasmon field near
the surface. The fluorescence emission mediated by plasmon excitation was
characterized. DNA hybridizing could be monitored on metallic surfaces using SPFS.
The sensor architecture consisted of an unlabelled oligonucleotide probe sequence
immobilized on streptavidin matrix. Cy3 and Cy5 labeled target sequences were
hybridized from solution and their fluorescence signals were recorded. The high
surface sensitivity of fluorescence technique coupled to surface plasmon resonance
permitted the real-time recording of hybridization kinetics.
On the basis of the investigations in Surface-plamon Field Enhanced Spectroscopy
(SPFS), new novel detection schemes for labeled targets were developed. The first
one is a SPR fluorescence imaging format. Patterned self assembled monolayers
(SAMs) were prepared and used to direct the spatial distribution of biomolecules
immobilized on surfaces. Here the patterned monolayers serve as molecular templates
to detect different biomolecules to pre-determined locations on a surface. The binding
processes of labeled target biomolecules from solution to the sensor surface were
visually and kinetically recorded by fluorescence microscope, in which fluorescence
was excited by the evanescent field of propagating plasmon surface polaritons. The
i
second format which also originates from the SPFS technique concerns the coupling
of fluorometry to a normal SPR setup. A spectrograph mounted in place of the
photomultiplier or microscope can provide the information about the fluorescence
spectrum as well as the fluorescence intensity.
The final study demonstrates an analytical combination of surface plasmon enhanced
fluorescence spectroscopy, microscopy and spectrometry with fluorescent ananlytes
tagged by semiconducting nanocrystals (quantum dots). These quantum dots show
several advantages compared to the classic organic dyes, the biggest one being their
broad spectral absorption range and the well defined sharp emission wavelength,
which makes it possible to excite several quantum dot populations simultaneously
with a single light source and, hence, at a single angle of incidence for resonant
surface plasmon excitation.
Our experiments showed clearly, that the specific hybridization of QD conjugated
DNA-single stands to sensor attached complementary sequences could be detected by
a substantial shift in the angular reflectivity spectrum of the SPR, as well as, by a high
fluorescence signal, originating from the DNA bound QDs.
The transfer of the system to the platform of surface plasmon enhanced fluorescence
microscopy and the organization of the catcher probe DNA in a micro array format
rendered a qualitative analytical approach of measuring the decomposition of QDxDNAy mixtures possible. The spectral resolution of the obtained multicolor images
with a spectrograph shows the potential of the combination of QD-DNA conjugates
with SPFS for future applications in DNA chip analytics.
ii
LIST OF TABLES:
Table 4.1: Nucleotide sequences of the probe and target DNA strands
57
iii
LIST OF FIGURES:
Figure 2.1: Schematic diagram of surface plasmon
9
Figure 2.2: Dispersion relation of free photons in a dielectric and in a coupling prism
16
Figure 2.3: Schematic diagram of prism coupling
18
Figure 2.4: The momentum matching of the incident light with surface plsamon
19
Figure 2.5: Dispersion relation before and after the absorption of an additional layer
21
Figure 2.6: Jablonsky diagram
24
Figure 3.1: Schematic diagram of Surface Plasmon Spectroscopy (SPS) setup
27
Figure 3.2: Angular scan curves and associated kinetic measurement
29
Figure 3.3: Surface Plasmon Fluorescence Spectroscopy (SPFS) set-up
30
Figure 3.4: Mounting of the prism, sample and flow cell
32
Figure 3.5: Typical SPFS curves before and after adsorption of fluorescence
DNA target oligo
34
Figure 4.1: The combination of SPS with fluorescence method
41
Figure 4.2: Schematic of the distance dependence of the optical field of PSP mode
45
Figure 4.3: Architecture of dye-labeled streptavidin monolayer
46
Figure 4.4: Kinetic scan and angular scan of the binding of cy3-streptavidin
47
Figure 4.5: Schematic presentation of binding between complementary DNA bases A-T
and G-C
48
Figure 4.6: Schematic presentation of the sensor surface architecture
49
Figure 4.7: Structure formula of biomolecules and DNA strands
50
Figure 4.8: SPFS results of MM0 DNA hybridization
51
Figure 4.9: SPFS results of MM1 DNA hybridization
51
Figure 4.10: Schematic experimental setups for SPFM and SPFS
(microscopy & spectrometry)
Figure 4.11: Schematic diagram of the preparation of photopattern surface.
55
59
Figure 4.12: Schematic arrangement of different probe DNA spots on micro
array sensor surface
61
Figure 4.13: Images from SPFM before and after the adding of Cy3-labeled target
DNA solution
61
Figure 4.14: The grating images with same integration time but at different angles.
62
Figure 4.15: Quantum Dot grating-patterned surface architecture.
63
Figure 4.16: SPFM results of QDs grating
64
Figure 4.17: SPR and SPFM results at different hybridizing time for QDs-labeled target
DNA solution.
65
iv
Figure 4.18: SPR and SPFS measurements of the hybridization on different
micro array spots
67
Figure 4.19: SPFM images of micro array sensor surface
69
Figure 4.20: Measurement results of multi-spots by SPFS (spectrometry)
72
v
1 Introduction
The study of biomolecular interactions and recognition processes are an important
topic in the field of biophysics. They are central to our understanding of vital
biological phenomena such as immunologic reactions and signal transduction. In
addition, these biological recognition reactions are at the heart of the development and
application of biosensors. A number of analytical techniques used in biology,
medicine and pharmacy have been developed over the past years. Novel detection
methods have been developed which combine the specificity of biomolecular
recognitions systems with the advantages of instrumental analysis. Biosensor devices
have gained importance in areas like medical diagnostic, quality control and
environmental analysis.
Biosensor
A biosensor is defined as an analytical device which contains a biological recognition
element immobilized on a solid surface and an transduction element which converts
analyte binding events to a measurable signal[1-2]. Biosensors use the highly specific
recognition properties of biological molecules, to detect the presence of binding
partners, usually at extremely low concentrations. Biological recognition can surpass
any man-made concepts in sensitivity and specificity. This specificity permits very
similar analytes to be distinguished from each other by their interaction with
immobilized bio-molecules (antibodies, enzymes or nucleic acids). Biosensors are
valuable tools for fast and reliable detection of ananytes and have reached an
importance for scientific, bio-medical and pharmaceutical applications [3-4]. The
advantages that are offered by the ideal biosensor over other forms of analytical
techniques are: the high sensitivity and selectivity, low detection limit, good
1
reproducibility, rapid response, reusability of devices, ease of fabrication and
application, possibility of miniaturization, ruggedness and low fabrication cost. By
immobilizing the bio-recognition element on the sensor surface one gains the
advantage of reusability of the device due to the ease of separating bound and
unbound species. By simple washing steps the non-specifically bound molecules may
be removed. Some surface sensitive detection formats, such as evanescent wave
techniques, even make these washing steps redundant. These techniques are relatively
insensitive to the presence of analytes in the bulk solution.
The mere presence of the analyte itself does not cause any measurable signal from
the sensor, but the selective binding of the analyte of interest to the biological
component. The latter is coupled to a transducer, which responds the binding of the
bio-molecule. [5-6]. The three most frequently used transduction devices are
electrochemical, piezoelectric and optical detectors. While electrochemical sensors
respond to changes in the ionic concentration, redox potential, electron transfer rate or
electron density upon analyte binding, piezoelectric sensors monitor changes in the
adsorbed mass on the sensor surface [7]. A large number of optical biosensors are
based on the principles of fluorescence, chemi-luminescence or absorption
spectroscopy.
Surface-sensitive techniques
Surface-sensitive techniques provide a vital link, both for the understanding of
biomolecular recognition and the development of biosensors. Indeed, surfaces and cell
surfaces in particular, are involved in many important biological functions via the cell
surface itself (the recognition of foreign molecules by specific receptors located on
the cell surface for example) or across the cell membrane (as in the signal
2
transduction from one neuron to another involving complex membrane receptor
proteins). These interfaces are central to a variety of biochemical and biophysical
processes: triggering of cellular response by neurotransmitter binding, blood
coagulation by foreign substances, cellular mobility, etc.
In parallel, surface-sensitive techniques bring an inherent advantage over bulk
techniques in that they provide real-time binding data. By immobilizing one of the
partners of the binding process on the surface of the transducer, the binding of the
complement can be followed unperturbed by the presence of free molecules in the
bulk. This eliminates the need for lengthy and perturbing separation steps that are
required in most bulk techniques.
The techniques that provide surface-sensitivity, as well as being non-destructive and
giving in-situ responses can be classified by the method of detection on which they
are based:
-electrical:
impedance spectroscopy
microphysiometry
-acoustic:
piezoelectric waveguides
-optical:
ellipsometry
reflectometric interference spectroscopy
attenuated total internal reflection infrared spectroscopy
surface plasmon resonance
total internal reflection fluorescence
optical waveguides
3
Evanescent Wave Sensors
Evanescent wave sensors exploit the properties of light totally reflecting at an
interface and the presence of an evanescent field of light at this interface. These
techniques make use of the exponentially decaying electromagnetic field at the
boundary between two media of different optical constants upon irradiation with
electromagnetic waves. Under total internal reflection conditions the decay length of
the evanescent field into the optically thinner medium is on the order of the
wavelength of the used excitation light. For visible light the field decays within a few
hundred nanometers. Only analyte molecules in the evanescent region are probed,
which causes the surface sensitive character of such methods. Basically, three
different evanescent wave formats are known: planar waveguides, fiber-optics and
surface plasmon resonance devices.
A waveguide consists of a planar glass surface with a refractive index higher than the
adjacent medium. Under certain conditions light coupled into this waveguide can
travel through the sample by total internal reflection. An evanescent field can interact
with molecules in the region surrounding the waveguide. Adsorbed analytes change
the optical properties of the waveguide and alter the boundary conditions for guiding
light in the sample. Hence, the light coupling out of the waveguide can then used to
monitor binding reactions at the surface of the waveguide. Fiber-optic sensors utilize
the same principle as waveguides, but differ in the experimental geometry.
Surface Plasmon Resonance
The evanescent light wave is used to excite the nearly free electron gas in a thin film
(~50 nm) of metal at the interface. The excitation of these so called surface plasmons,
are directly dependent on the optical properties of the adjacent medium where any
4
mass deposition on the metal surface will lead to a change in the optical architecture,
and hence, in the coupling conditions of the evanescent wave with the plasmons. The
excitation of the resulting surface waves gives rise to a field enhancement compared
to the intensity of the incident electromagnetic field [8]. This is used to detect mass
changes on the film and thus to measure binding processes at the interface.
Illumination by laser light can be used to excite the plasmons in metals. Then the
system responds to changes in the optical properties of the medium close to the metal
film by altering the intensity of the reflected light. For surface sensitive investigations
of adsorption and desorption processes on metallic substrates Surface Plasmon
Resonance is the method of choice. Commercial instruments are available (such as the
BIAcore, Pharmacia, Sweden) and are routinely used to measure biomolecular
interactions.
Evanescent Enhancement of Fluorescence
Generally, sensor formats can be divided into direct and indirect sensors. The first
group is capable of detecting the presence of the analyte molecule directly, while the
indirect schemes detect the presence of an additional signal. In electrochemistry based
sensors redox-active labels like ruthenium pyridinium complexes bind to the receptortarget complex and may be detected voltammetrically. Sensitivity is an important
aspect for the detection of biomolecules to improve SPR measurements. For example,
the use of attached colloidal particles and amplification of hybridization signal
through streptavidin have been reported. Surface Plasmon Spectroscopy (SPS) and
piezo-electric techniques are sensitive to changes in the adsorbed mass and optical
thickness on the surface. Labels of large molecular weight like proteins can be used to
enhance the sensitivity of the system. Finally, the most prominent optical labels are
fluorescent molecules. They allow for a highly sensitive detection because the
5
excitation and emission wavelength can be separated. Therefore fluorophores are
widely used to detect molecules in a variety of applications.
The development of novel, easy-to-use detection protocols and assay designs rely on
the knowledge of kinetic constants of binding reactions. Thus, surface sensitive
techniques are essential for the investigation of surface reaction kinetics.
Unfortunately, many of the surface sensitive techniques such as Surface Plasmon
Spectroscopy lack in their detection limit if low molecular mass analytes are to be
detected. Therefore, combinations of surface sensitive optical techniques with
fluorescence detection formats were developed. The excitation of evanescent wave
techniques has been demonstrated for waveguides and fiber-optic devices [9-11].
Fluorescent molecules close to the sensor surface are excited by the evanescent
electrical field. Compared to direct illumination an enhancement of a factor of four
can be reached.
Recently surface plasmons were used as intermediate states between the incident light
and the excited fluorophore in Surface Plasmon Fluorescence Spectroscopy (SPFS)
[12-13]. Depending on the nature of the metal the plasmon field provides the
possibility to enhance the fluorescence signal up to a factor of 80. SPFS allows
probing the presence of fluorescent analytes with high sensitivity and simultaneously
provides information about the sensor architecture. From the viewpoint of biomolecular architectures employed for biosensors metal surfaces are important with
respect to immobilization strategies and are irreplaceable for self assembly of thiol
tethered lipids, proteins and nucleic acids. The detection formats for DNA
investigated in this study are based on controlled and reproducible formation of
monolayers of proteins and DNA on gold and silver films. Therefore the SPFS
6
technique was used to characterize the formation of the supporting matrix and the
DNA hybridization.
The excitation of fluorescence in the evanescent field of the plasmons is strongest
close to the metal surface. On the other hand the presence of the metal can reduce the
observed fluorescence intensity by inducing distance dependent quenching processes
like the Förster transfer. Excitation and quenching processes exhibit different distance
dependencies. An optimal distance to the metal exists at which maximal fluorescence
excitation is observed. Therefore, the experimental design of the sensor surface
architecture has to be optimized in order to obtain an efficient and sensitive sensor
concept.
Surface plasmon field enhanced techniques are particularly suited for the study of
biomolecular interactions where, in addition to its surface specificity, this technique
has a very high sensitivity thanks to the possible use of efficient fluorescent labels.
The use of this technique to study biomolecular recognition processes, as well as for
the development of biosensors, is central to this work.
Aim of the study
The aim of this study is the development and characterization of DNA biosensor
formats based on evanescent wave techniques such as Surface Plasmon Fluorescence
Spectroscopy. The surface plasmon enhanced fluorescence (SPFS) set-up was
recently described [13] and the current application of this technology for DNA
detection on surfaces was shown. However, the fluorescence microscopy format was
not investigated in full detail. Furthermore, the impact of multi-parallel biomolecular
detection by SPFM and SPFS techniques on biosensor development was not evaluated.
This study focuses on the development of surface plasmon enhanced fluorescence
7
spectroscopy (SPFS) and microscopy (SPFM) and their potential application in the
field of biosensor. The aims of this study are defined as follows:
(1) Study of DNA hybridization reactions on surfaces based on SPFS.
(2) Development and characterization of novel detection formats for nucleic acids
on surfaces. These studies can include the use of different fluorescence labels
and different surface pattern designs.
In part 2 the theoretical background of the surface plasmon resonance techniques is
reviewed and the concept of fluorescence is discussed. The combination of both
techniques in the form of SPFS (spectroscopy), SPFM (microscopy), SPFS
(spectrometry) and the influence of surface plasmon fields on fluorophores close to
planar surfaces is discussed in part 4. The use of SPFS and SPFM for the investigation
of DNA hybridization is also discussed. The design of the used sensor format is
presented and the measurement principle is explained.
8
2 Theory
2.1 Surface Plasmon Resonance
The phenomenon of surface plasmons has been known for a long time. The
underlying principles and theories are well understood, so that a number of
publications can be found which discuss their properties in detail [8, 14, 15]. Surface
plasmons are surface waves which can be excited at the interface between a metal and
a dielectric and the exact excitation conditions strongly depend on the optical
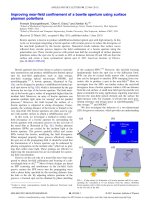
properties of the system. (Figure 2.1) It will be derived that changes in these
properties will lead to altered experimental excitation conditions. This measurable
response of the system permits the sensitive monitoring of processes near this
interface. Numerous descriptions of successful surface plasmon based sensors can be
found and are discussed later.
z
dielectric
metal
ε" >0
plasmon
x
ε' <0
Figure 2.1: Schematic diagram of surface plasmon
A major part of this work is based on the excitation of surface waves and the
interaction of the associated electromagnetic field within dielectric thin films. The
theoretical background of these processes are described in detail in this chapter, since
the understanding of electromagnetic waves in matter and their behavior at interfaces
is essential for the following discussion. Fundamental processes like refraction,
9
reflection, transmission and damping of electromagnetic waves at interfaces are
considered in general, followed by a discussion of surface plasmon excitation in a two
layer system. Finally, the derived model will be extended to multilayer systems and
the connection to experimental surface plasmon spectroscopy is made.
2.1.1. Electromagnetic Fields and Maxwell Equation of Plane Waves at interface
The general description of monochromatical electromagnetic waves in an isotropic,
homogenous medium without any source terms is given by Maxwell’s equations.
∇ × E(r, t ) = −
∂
B(r, t )
∂t
∇ × H (r, t ) =
∇ ⋅ D(r, t ) = 0
∂
D(r, t )
∂t
∇ ⋅ B(r, t ) = 0
(2.1)
Here, E is the electric field, D the electrical displacement, B the magnetic induction,
H the magnetic field, r the spatial vector and t is the time. The relations between D
and E, B and H are given by
D(r, t ) = εε 0 E(r, t )
B(r, t ) = µµ 0 H (r, t )
(2.2)
with ε and µ being the dielectric constant and the magnetic , respectively.
The solution of the above Maxell’s equations as a function of time t at point r is a
plane wave, which can be described in a complex form as:
[
]
E(r, t ) = E 0 ⋅ exp i(k ⋅ r − ω t )
(2.3)
The interpretation of the above equation is that only the real part of the complex
quantity has a physical meaning and the orientation of E0 is orthogonal to k. For each
pair of (k, ω ) two mutually orthogonal electric field amplitudes exist, spanning the
plane to give all possible polarizations. Besides the electric field, also the magnetic
field (with the corresponding mathematical notation) contains the full information
10
about the plane wave. Both representations may be transformed into each other by use
of
E(r, t ) =
H (r, t ) =
1
εε 0ω
k × H(r, t )
1
µµ 0ω
k × E(r, t )
(2.4)
The dispersion equation relates the modulus k of the wavevector to a given angular
frequency ω
ω2
k
2
=
1
µµ0εε 0
=
c2
n2
(2.5)
Here, the refractive index n is defined as the ratio of the speed of light c in vacuum
and in matter. Making the assumption of a nonmagnetic material ( µ = 1) the
dispersion equation can be further simplified to give
k = ω ⋅ εε 0 µµ 0 = k 0 ε = k 0 ⋅ n
(2.6)
The situation of light passing through medium 1 with a refractive index n1, which is
then reflected at medium 2 with a refractive index n2 that is smaller than n1 gives rise
to a special feature: Beginning at an angle of incidence θ1 of zero the transmission
angle θ2 can be determined according to Snell’s law. The increase of θ1 leads to an
increase of θ2 up to the point where θ2 reaches a value of 90°. Then the so-called
critical angle θc is reached. At that point the reflectivity reaches a value of R = 1, i.e.
light is totally reflected, and any further increased of θ1 has no influence on the
reflectivity anymore. However, at such high angles the component of the field normal
to the surface is not longer oscillatory but decays in an exponential way as given by
equation (2.1). This is the regime of evanescent waves.
2.1.2 Surface Plasmon
Before moving on to the theoretical description of plasmon surface polaritons, or
surface plasmons for short, a brief, descriptive understanding of surface polaritons is
11
given. The way in which surface plasmons are technically excited is then presented.
There are mainly two methods available, the prism and the grating coupling, with
only the prism formation being considered here in detail. Finally, the focus is put on
the question how the system responds if extra layer is then added to the dielectric.
Wave-like electromagnetic modes that propagate along an interface between two
media and whose amplitudes decrease exponentially normal to the surface are called
surface polaritons, i.e. surface electromagnetic modes involving photons coupled to
surface electric-dipole and/or magnetic-dipole excitations. A plane wave of transverse
electric-dipole excitation propagating along the x-axis in an optically isotropic
medium is now considered. Since the macroscopic polarization P is transverse and
∇ ⋅ P = 0 there are no volume polarization charges and, thus, no electric field exists.
Now a non-dispersive dielectric medium is introduced with a surface normal parallel
to P. As a result of the discontinuity in P a periodic surface charge density is
established at the surface giving an electric field with components along x and z. Due
to the fact that the surface charge density alternates in signs, the magnitude of the
fields decreases exponentially in the direction normal to the surface. Furthermore, the
surface charge density is the only source of the electric field and thus its zcomponents at equidistant points from the interface are opposite in sign. However,
since the normal components of the electric displacement D at the interface in both
media have to be continuous it follows that the dielectric constants ε 1 (ω ) and ε 2 (ω )
have opposite sigh. This is the basic condition for the existence of surface electricdipole excitations. Of such an electrostatic field is coupled to ‘surface photons’ a socalled surface polariton is created, the total electric field of which consists of a
superposition of the constituting electrostatic and electromagnetic fields. Since the
12
coupling photon has to provide for the surface charge density the surface polaritons
are TM modes.
2.1.3 Plasmon Surface Polaritons at a Noble Metal/Dielectric Interface
The interface between two media of different frequency-dependent, but this time
complex dielectric functions is examined.
ε 1 = ε 1 '+iε 1 "
ε 2 = ε 2 '+iε 2 "
(2.7)
The link between the complex dielectric constant ε and the complex refractive index
(n + iκ ) is given by
(n + iκ ) = ε '+iε " = ε
ε '= n2 − κ 2
ε " = 2nκ
(2.8)
The real part n is called refractive index whereas the imaginary part κ is the
absorption coefficient, i.e. responsible for the attenuation of an electromagnetic wave.
The magnetic permeabilities µ1 and µ 2 are considered to be equal to 1.
As explained above, there only exist surface polaritons for transverse magnetic
polarized incident plane waves. Thus, the solution to the problem will have the
general form of
A 1 = A 01 ⋅ exp[i (k x1 x + k z1 z − ωt )]
A 2 = A 02 ⋅ exp[i (k x 2 x + k z 2 z − ωt )]
(2.9)
with A either being the electric field E or the magnetic field H. k x1 and k x 2 are the
wavevectors in x-directions and k z1 , k z 2 the ones along the z-axis. The numbers 1 and
2 are references to the two media involved for z > 0 and z < 0, respectively. The
13
continuity of the tangential components of E and H at the surface, i.e. E x1 = E x 2 and
H y1 = H y 2 accounts for
k z1 H y 1 =
k z2 H y2 =
ω
c
ω
c
ε 1 E x1
(2.10)
ε 2 E x2
On the other hand, inserting equation (2.8) into Maxwell’s equations (2.4) gives
k x1 = k x 2 = k x
(2.11)
This leads to the only nontrivial solution if
k z1
ε
=− 1
k z2
ε2
(2.12)
This equation states that surface electromagnetic modes can only be excited at such
interfaces where both media have dielectric constants of opposite signs, as has already
been shown above. If one of the two media is a dielectric with a positive dielectric
constant ε d then the above relation can be fulfilled by a whole variety of possible
elementary excitations if and only if their oscillation strength is large enough to result
in a negative dielectric constant ε . For excitations like phonons or excitons the
coupling to a surface electromagnetic wave leads to phonon surface polariton or
exciton surface polariton modes, respectively. Another type of excitation that can
couple to surface electromagnetic waves is the collective plasma oscillation of a
nearly free electron gas in a metal around the charged metal ions, called plasmon
surface polaritons.
In dielectrics the electrons are bound tightly to the nuclei resulting in a small, positive
and real dielectric constant. In metals, however, the electrons are quasi-free and may
be moved easily by an external force. The classical Drude model, which considers the
electrons to be free, already derives at a highly negative, complex dielectric constant:
14
ε (ω ) = 1 −
ωp2
(2.13)
ω2
The plasma frequency ω p usually lies in the UV range for metals. The above
equation is valid for frequencies ω from 0 up to a maximum frequency ω max , which is
given by
ωp
ω max =
(2.14)
1+ εd
For metals the dielectric function, ε m , is in general complex with a negative real part
and a small positive imaginary part.
Continuing the above deduction of the very distinct wavevector of a surface plasmon,
the wavevectors in the direction of the z-axis can be calculated:
2
k zd
⎛ω ⎞
2
= ε d ⎜ ⎟ − kx
⎝c⎠
2
k zm
and
⎛ω ⎞
2
= ε m ⎜ ⎟ − kx
⎝c⎠
(2.15)
Finally, with equation (2.12) this leads to the dispersion equation for surface plasmons
at a metal/dielectric interface:
k x = k x '+ik x " =
ω
c
εm ⋅εd
εm + εd
(2.16)
In conclusion, the complex nature of the wavevectors in x- and z- direction leads to an
exponentially decaying wave in z and an attenuated wave along the x-axis. A finite
propagatin length Lx
Lx =
1
kx"
(2.17)
can be defined, which extremely influences the lateral resolution and is especially
important in surface plasmon microscopy applications. For a gold/air interface with
15
ε m = −12 + i ⋅ 1.3 and λ = 632.8 nm the propagation length is in the range of Lx
=10µm.
2.1.4
Excitation of Surface Plasmons
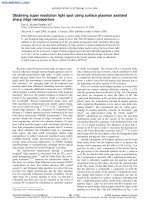
Another aspect of the dispersion relation of surface plasmons is summarized in the
following equation:
k x , SP =
ω
c
εm ⋅εd
εm + εd
≥
ω
c
ε d = k x (max), ph
(2.18)
Clearly, one result of this equation is, as already stated above, that the z-component of
the surface plasmon wavevector is purely imaginary. Thus, the surface plasmon is a
nonradiative evanescent wave with maximum field amplitude at the interface. It
ωmax
ωL
ω = cp k
ω = cd k
b
a
1
2
p
3
Wavevector
Figure 2.2: Dispersion relation of free photons in a dielectric (a) and in a coupling prism (b) with
np>nd, compared to the dispersion relation of surface plasmons at the interface between metal
and dielectric. At a given laser wavelength ωL the energy and momentum match of the photons
impinging from a dielectric with the surface plasmon is not achieved whereas for the photons
incident through a prism, which is increasing the pohotons momentum, it is attained.
decays exponentially into the dielectric and the metal. Another consequence is that a
light beam incident from the dielectric with the maximum wavevectorv k x (max), ph at the
interface cannot excite a surface plasmon with the wavevector k x , ph since its
momentum is not sufficiently large.
16
Figure 2.2 presents these details graphically. Although the light line of free photons (a)
approaches asymptotically the dispersion curve of surface plasmons (p) there is no
intersection of both curves and the x-component of the waevector of incident light is
always smaller than the one for surface plasmons. Among the developed methods to
increase the momentum of the light in order to couple to surface plasmons there are
for example nonlinear coupling or coupling by means of a rough surface. By far the
most predominant coupling techniques, however, are the prism coupling and the
grating coupling, but only the prism coupling will be discussed in the following.
Prism coupling represents one way of increasing the wavevector of the incident light
and hereby the x-component of the wavevector, which only couples to the surface
excitation. Figure 2.2 also shows the corresponding dispersion relation if the
refractive index of the prism np is larger than the one of the dielectric nd. The
momentum is increased, the curve more tilted and therefore at a given laser
wavelength ω l , coupling to surface plasmons (2) can be obtained. However, since at
point (3) the momentum of the light beam is too large it has to be tuned to the one of
the surface plasmon by varying the angle of incidence (k x , ph = k ph ⋅ sin θ i ) .
There exist two different configurations with which to excite surface plasmons by use
of a high refractive index prism. The one that was proposed first is the so-called Otto
configuration. Here, the laser beam is reflected off the base of a prism (common
geometries are half-sphere, half-cylinder or 90° prisms). A gap of low refractive index,
less than a few radiation wavelengths thick (for visible light < 2µm) provides for a
tunnel barrier across which the evanescent radiation couples from the totally
internally reflecting base of the prism to the bound surface field of the surface
plasmon. Experimentally, the resonant coupling is observed by monitoring the
17