Machine learning based classification system for overlapping data and irregular repetititve signals
Bạn đang xem bản rút gọn của tài liệu. Xem và tải ngay bản đầy đủ của tài liệu tại đây (407.33 KB, 90 trang )
MACHINE LEARNING BASED
CLASSIFICATION SYSTEM
FOR OVERLAPPING DATA AND
IRREGULAR REPETITIVE SIGNALS
SIT WING YEE
(B.Sc. (Hons) NUS)
A THESIS SUBMITTED
FOR THE DEGREE OF MASTER OF SCIENCE
DEPARTMENT OF MATHEMATICS
NATIONAL UNIVERSITY OF SINGAPORE
Acknowledgements
I would like to thank my supervisor, Dr Mak Lee Onn of DSO, for the opportunity to
work on this project, for his generosity, patient guidance and all the time and attention he
had been giving me despite his busy schedule.
I am also most grateful to Dr Ng Gee Wah for making it possible for me to embark on
this journey. None of this would have been possible without support from him and DSO.
It has been a pleasure to work at CCSE under the watch of Prof Chen Yuzong, who has
given much valuable advice to better prepare me for the road ahead. My heartfelt
gratitude also goes to A/P Bao Weizhu for his support, guidance and assistance in so
many ways. I would also like to thank Daniel Ng of DSO, who went through much
trouble to allow me to enter this project.
My appreciation goes to my friends and colleagues at CCSE and Mathematics department,
who made my experience at NUS a very enjoyable and special one.
i
This project is sponsored by the NUS-DSO Collaboration under
contract No. DSOCL06147.
ii
Table of Contents
Chapter 1.
Introduction................................................................................................. 1
1.1.
Classification....................................................................................................... 1
1.2.
The Problem........................................................................................................ 2
1.3.
Main Results ....................................................................................................... 3
1.4.
Contributions....................................................................................................... 3
1.5.
Sequence of content ............................................................................................ 4
Chapter 2.
Fuzzy ARTMAP Classification .................................................................. 5
2.1.
Fuzzy ARTMAP Architecture ............................................................................ 5
2.2.
Problem of Overlapping Classes....................................................................... 12
2.2.1.
Category Proliferation............................................................................... 12
2.2.2.
Difficulty of Classification ....................................................................... 14
2.3.
Methodology ..................................................................................................... 16
2.3.1.
Classification and Accuracy Measure....................................................... 16
2.3.2.
Measures to Reduce Category Proliferation ............................................. 24
2.4.
Results............................................................................................................... 29
2.4.1.
Results for UCI Datasets........................................................................... 31
2.4.2.
Results for Synthetic Data ........................................................................ 34
2.5.
Discussion ......................................................................................................... 36
Chapter 3.
3.1.
Signal Sorting by TOA ............................................................................. 40
Existing Method................................................................................................ 41
3.1.1.
Sequence Search ....................................................................................... 41
3.1.2.
Difference Histogram Method .................................................................. 42
3.2.
Implementation of Sequence Search and Histogram Methods ......................... 48
3.2.1.
Implementation Issues .............................................................................. 49
3.2.2.
Algorithm for Sequence Search using Bin Interval .................................. 50
3.2.3.
Problems Encountered .............................................................................. 53
3.3.
Use of Prior Knowledge.................................................................................... 55
iii
3.3.1.
Selecting the Tolerance Parameter............................................................ 57
3.3.2.
Selecting the Threshold Parameters.......................................................... 57
3.3.3.
Trial Train Construction in Sequence Search ........................................... 63
3.4.
Results............................................................................................................... 64
3.4.1.
Results for Sample with 2 classes............................................................. 66
3.4.2.
Results for Sample with 3 Classes ............................................................ 67
3.4.3.
Results for Sample with 4 Classes ............................................................ 69
3.5.
Discussion ......................................................................................................... 70
Chapter 4.
Conclusion ................................................................................................ 74
iv
Summary
Two classification modules in an overall system are looked into – one that does
classification for data from overlapping classes using the fuzzy adaptive resonance theory
map (fuzzy ARTMAP), and another which sorts repetitive signals, separating them into
their respective sources. When faced with overlapping data, fuzzy ARTMAP suffers from
the category proliferation problem on top of a difficulty in classification. These are
overcome by a combination of modifications which allows multiple class predictions for
certain data, and prevents the excessive creation of categories. Signal sorting methods
such as sequence search and histogram methods can sort the signals into their respective
sequences with a regular interval between signals, but effectiveness of the methods is
affected when the intervals between signals in the source are highly deviating. Using
available expert knowledge, the signals are effectively and accurately separated into their
respective sources.
v
List of Tables
Table 1: Results from class by class single-epoch training of 2-D data from Figure 5.... 27
Table 2: Accuracy of UCI data using different classification methods ............................ 30
Table 3: Combinations of modifications........................................................................... 30
Table 4: Comparisons between modifications on results for yeast data........................... 32
Table 5: Comparisons between modifications on results for contraceptive method choice
data ............................................................................................................................ 33
Table 6: Comparisons between modifications on results for synthetic data without noise
................................................................................................................................... 34
Table 7: Comparisons between modifications on results for synthetic data with noise ... 35
Table 8: Summary of results using fuzzy ARTMAP with and without modifications..... 36
Table 9: Results for ordered incremental learning using UCI data .................................. 37
Table 10: Improvements in performance from using merging ......................................... 38
Table 11: Example of information used in adaptation of x and k..................................... 62
Table 12: Values of x and k before and after adaptation .................................................. 62
Table 13: Class and PRI knowledge of data used............................................................. 65
Table 14: Classes C and I with deviation 2.5% and 5% ................................................... 66
Table 15: Classes D and E with deviations 14% and 14% ............................................... 67
Table 16: Classes K, C and H with deviations 0%, 2.5% and 2%.................................... 67
Table 17: Classes D, E and H with deviations 14%, 14% and 2% ................................... 68
Table 18: Classes C, I, D and E with deviations 2.5%, 5%, 14% and 14%...................... 69
vi
Table 19: Classes E, F, L and M with deviations 14%, 10%, 7% and 7% ....................... 69
vii
List of Figures
Figure 1: Basic architecture of fuzzy ARTMAP ................................................................ 6
Figure 2: Basic architecture for simplified fuzzy ARTMAP.............................................. 6
Figure 3: Flowchart for simplified fuzzy ARTMAP training process................................ 8
Figure 4: Flowchart for simplified fuzzy ARTMAP classification process ..................... 11
Figure 5: Class distribution and hyperbox weight distribution after learning with ρ=0.75.
(a) Class distribution of the data from 2 classes (b) Position of hyperboxes after 1
training epoch (c) Position of hyperboxes after training until convergence of training
data, which required 9 epochs................................................................................... 13
Figure 6: 2D view of hyperplane separating the hyperbox into two halves. (i) The input
pattern lies on side P of the hyperplane (ii) The input pattern lies on the side Q of the
hyperplane................................................................................................................. 18
Figure 7: Shortest distance from the input pattern to the hyperbox when position of input
pattern a on side P coincides with u^a ...................................................................... 19
Figure 8: Shortest distance from the input pattern to the hyperbox when the position of
input pattern a on side P does not coincide with u^a ................................................ 20
Figure 9: Hyperboxes of different sizes............................................................................ 21
Figure 10: Patterns with more than one predicted class ................................................... 23
Figure 11: CDIF histograms up to difference level 4 ....................................................... 45
Figure 12: SDIF histograms up to difference level 2........................................................ 46
Figure 13: Example of sequence search using bin interval – Search for first signal ........ 51
viii
Figure 14: Example of sequence search using bin interval – Search for signal within
tolerance allowance................................................................................................... 51
Figure 15: Example of sequence search using bin interval – No signal found within
tolerance allowance................................................................................................... 52
Figure 16: Example for sequence search using bin interval – Search for next signal after a
missing signal is encountered ................................................................................... 52
Figure 17: Example for sequence search using bin interval – Selection of next signal
based on supposed PRI ............................................................................................. 53
Figure 18: Difference histogram of sample with higher deviation ................................... 55
Figure 19: Graphical view of information drawn from database...................................... 56
Figure 20: Position of threshold function if chosen bin is taller than those before it ....... 58
Figure 21: Position of threshold function if chosen bin is shorter than one before it....... 59
Figure 22: Simplified view of original and desired threshold function ............................ 60
Figure 23: Thresholds before and after adaptation ........................................................... 63
Figure 24: Histogram peaks at values less than smallest PRI........................................... 72
ix
Chapter 1.
Introduction
1.1. Classification
Classification methods have found their way into various applications because of their
many uses. They can learn rules and classify new data based on previously learnt
examples, speed up processes (especially for large amounts of data), or decision making
and diagnosis, where human error and biasness can be avoided by using a classification
system [1]. Various methods are available, and they have been utilized in different
applications, such as fuzzy adaptive resonance theory map (fuzzy ARTMAP) in
handwriting recognition [2], support vector machines in computer-aided diagnosis [3],
multi-layer perceptrons in speech recognition [4], etc.
Different classification methods will have their own limitations, which may become more
apparent or pronounced with certain types of data or under particular situations. Effective
application of these methods will inevitably involve some extent of adaptation. However,
many modifications made to the methods tend to introduce drastic changes to the original
architecture, or impose much additional computational costs. This may result in some of
the initial benefits and strengths of the method to be lost. As such, we are interested in
finding ways to overcome the limitations with minimal changes. This can be done by
considering a particular given situation, or by considering the characteristics and
knowledge of the data involved.
1
1.2. The Problem
This project looks into part of an overall classification system. The entire system consists
of different modules, each with a certain objective to attain. Our focus is on two of these
modules – the fuzzy ARTMAP classification module and signal sorting module.
The fuzzy ARTMAP module classifies data according to their attribute values. However,
some class distributions in the attribute space are overlapping, such that data lying in the
overlapping region may belong to either class. Yet during classification, only one class is
predicted by the system, leading to a difficulty in classification. In addition, the
overlapping classes also lead to the category proliferation problem. There are various
existing methods that aim to reduce this problem, but they tend to involve major changes
to the fuzzy ARTMAP architecture or introduce considerable computational costs. It is
therefore in the interest of this project to find ways to reduce the category proliferation
problem and also deal with the classification of data in overlapping classes without
significantly changing the architecture, and using minimal additional computational costs.
The signal sorting module deals with repetitive data. Signals from the same source occur
at regularly spaced intervals, and the sample consists of signals from various sources.
Signal separation methods such as sequence search and difference histograms can be used
to sort the signals into their respective sources, but they face limitations when the regular
intervals between signals from the same source deviate from the average value. As expert
knowledge on the sources is available in the system, it becomes desirable to find a way to
incorporate this knowledge into the existing process to improve it without introducing
major changes to the original method.
2
1.3. Main Results
To deal with the problem of overlapping classes in fuzzy ARTMAP, we modify the
classification process so that more than one class can be predicted for certain data. The
decision control of which classes to predict is built into the system and there is no need
for a separate parameter to be selected by the user. The extent of category proliferation is
eased significantly with the introduction of some modifications, used in conjunction with
an existing proposed variation called match tracking - (abbreviated as MT-, where the
dash is read as ‘minus’). These modifications work well even for large datasets with
higher amounts of noise.
Expert knowledge on the signals and their sources is available for the signal sorting
module in the form of a database. The information in the database is not exclusive and
consists of irrelevant information as well, but can still improve the performance of the
existing methods on our data. The selection of parameters for the difference histogram
method is automated and appropriately chosen, while the sequence search process is
completed with greater certainty and accuracy by referring to the database. Although the
time taken by the signal sorting method is longer than before, the overall process is
actually faster due to the elimination of the need to scan for the right parameter values.
1.4. Contributions
The contribution of the work on the fuzzy ARTMAP problem of overlapping classes is to
offer a simple way that is straightforward to implement, which can overcome the
difficulty in classifying data from overlapping classes, as well as the problem of category
proliferation. It does not introduce much additional computational costs and the whole
training and classification process is completed much faster than before for such
overlapping data. A paper containing this work has been submitted [5].
3
In signal sorting, expert knowledge is successfully incorporated into the existing methods
without making drastic changes. It enables signals to be separated effectively and
accurately. There is a reduced need to scan values for user-selected parameters, which are
difficult to determine since they vary with different data. This effectively reduces the
total time needed for the complete process.
1.5. Sequence of content
The thesis is arranged as follows. Chapter 2 describes the work done for the fuzzy
ARTMAP module. It will first introduce the classification process and the problem of
overlapping classes. With an understanding of how the method works and how the
problems arise, modifications can be made. The results and discussions following the
testing of the modifications are then shown.
Chapter 3 focuses on the signal sorting module. It illustrates the existing methods and
elaborates on the problems that are encountered upon implementation of the methods on
actual data. Expert knowledge that is available will be used in overcoming the problem,
so the format of the knowledge used is first described, followed by the way it can be used
to improve on the existing methods. Results and discussions are then presented, as well as
the potential concerns with incorporating expert knowledge into the method.
Finally, Chapter 4 concludes the work done in the project and the possible future
directions to further the investigations conducted and results obtained here.
4
Chapter 2.
Fuzzy ARTMAP Classification
Fuzzy adaptive resonance theory map (fuzzy ARTMAP) is a supervised clustering
algorithm that can be used for classification tasks. It has many strengths that make it very
appealing, such as incremental learning as new data becomes available [6], fast learning
dynamic neuron commitment , and the use of few training epochs to achieve reasonably
good performance accuracy [7]. Together with various modifications, fuzzy ARTMAP
has performed well when applied to areas such as radar range profiles [8], online
handwriting recognition [9], classification of natural textures [10], genetic abnormality
diagnosis [11], wetland classification [12], etc. However, fuzzy ARTMAP suffers from
the category proliferation problem [13], which is a drawback that is of concern to us. This
will be further investigated in the following sections.
2.1. Fuzzy ARTMAP Architecture
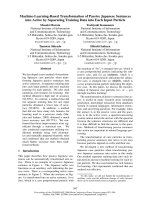
The overall structure of fuzzy ARTMAP consists of two adaptive resonance theory (ART)
modules – ARTa and ARTb, and a mapping field called the MAP module (see Figure 1).
ARTa and ARTb cluster patterns in the input space and output space respectively. Clusters
from ARTa are mapped to ARTb through the mapping field.
5
MAP
ARTa
ARTb
Figure 1: Basic architecture of fuzzy ARTMAP
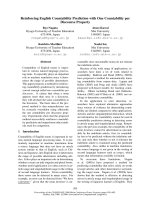
For classification problems, each input pattern is mapped to an output class, so ARTb
becomes redundant. We can remove the ARTb module and map categories from ARTa
directly to their respective classes in the MAP field (Figure 2). This simplified fuzzy
ARTMAP was introduced by Kasuba in [14] will be used in this project. More details of
the algorithm can be found in [15] and [16].
MAP
ARTa
Figure 2: Basic architecture for simplified fuzzy ARTMAP
Input data consists of vectors representing the attribute values of each sample. The values
are scaled such that they are in the range [0,1]. Before being presented to the network, the
input data undergo complement coding, such that an input
a = (a1 ,..., aM )
with M attributes will be represented as a vector
I = (a,1 − a )
= (a1 ,..., aM ,1 − a1 ,...,1 − aM ).
The length of the vector will then be doubled.
6
The ART module consists of nodes which can cluster similar input patterns together, and
all the patterns clustered by the same node will be mapped to the same class, although
there may be more than one node mapped to the same class. These nodes are commonly
referred to as categories, and they are represented by their own weight vectors. The
weights of a category is given by
W = (u,1 − v)
= (u1 ,..., uM ,1 − v1 ,...,1 − vM ),
where u = (u1 ,..., uM ) and v = (v1 ,..., vM ) , where ui , vi ∈ [ 0,1] . Geometrically, the category
can be represented as a hyperbox in M-dimensional hyperspace, with u and v
representing the lower and upper endpoints of the hyperbox respectively. Therefore the
categories are also often simply referred to as hyperboxes.
A simple basic idea of fuzzy ARTMAP classification is as follows: during training, when
an input pattern in presented, the hyperbox nearest to the input point in hyperspace will
code (or cluster) that point if it is mapped to the same class as the rest of the points coded
by the same hyperbox. In order to code that input point, the hyperbox grows just enough
to contain it. Then when an unknown input pattern is presented during classification, the
hyperbox nearest to it in hyperspace will code it, so the output class will be the same as
all the other points coded by that same hyperbox.
With a brief overall idea in mind, we shall now take a closer look at the algorithm of
training and classification of the fuzzy ARTMAP. The following operators will be used
in the algorithm.
The fuzzy min ∧ and max ∨ operators are defined as follows:
For vectors A = (a1 ,..., an ) and B = (b1 ,..., bn ) ,
A ∧ B = (min(a1 , b1 ),..., min(an , bn )) ,
A ∨ B = (max(a1 , b1 ),..., max(an , bn )) .
The size i of any weight or input vectors is defined as A =| a1 | + | a2 | +...+ | an | .
7
Training
Input patterns are presented to the network one at a time and the full presentation of the
whole set of training input is known as one epoch. For every input pattern that is
presented after complement coding has been carried out, the network learns by following
the process given in the flowchart in Figure 3.
Present input
Activation value competition of
nodes
Pass vigilance
test?
No
Disqualify
node
Yes
Pass match
test?
No
Match
tracking
Yes
Update weights for
winning node
Figure 3: Flowchart for simplified fuzzy ARTMAP training process
When the rth input pattern I r is presented, all the categories undergo competition based
on their activation values. The activation value for category j with weights W j is defined
as
8
Tj =
Ir ∧ Wj
α + | Wj |
,
where α is a small positive value called the choice parameter. The activation value is a
measure of how close the input data is to each of the existing hyperboxes. The choice
parameter biases the measure towards smaller hyperboxes in case of a tie in value
between two hyperboxes of equal distance from the input data. The use of activation
value for competition among the nodes can be understood as clustering together the input
patterns which are most similar in terms of their attribute values. The node with highest
activation value will be the one which clusters input patterns with highest similarity to the
given input pattern.
Based on the competition of activation values, the node or category with highest value
will be the winner. This winning category with weights Wmax will then undergo a
vigilance test
I r ∧ Wmax
≥ρ,
Ir
where ρ ∈ (0,1) is known as the vigilance parameter. This test is a measure of how much
the hyperbox has to grow in order to contain the input pattern. A hyperbox that is already
very large or one that is far from the input pattern will be more likely to fail the vigilance
test, and this vigilance parameter is a restriction on the size of the hyperbox. If the
hyperbox category fails the test, one with next highest activation value is considered,
until one which passes the vigilance test is found.
The match test is a check performed on the class of the winning category against the
corresponding output class of the input pattern I r . A class-mismatch triggers off a match
tracking process, whereby the current category is disqualified and the remaining
categories compete based on activation value again. The procedure is repeated but the
vigilance parameter is temporarily raised for this input-output pair to
Ir ∧ Wj
| Ir |
+ε ,
9
where ε is usually a small positive value.
But if the category passes the vigilance test and the match test, it will code the input
pattern I r and its weights are updated according to
Wj ← Wj ∧ Ir .
The new weights are given as
W jnew = W j ∧ I
= ( u,1 − v ) ∧ ( a,1 − a )
= ( u ∧ a, (1 − v ) ∧ (1 − a ) )
= ( u ∧ a,1 − ( v ∨ a ) ) .
Geometrically, the new hyperbox after growing just enough to contain the input point
will have the lower and upper end points ( u ∧ a ) and ( v ∨ a ) respectively.
Fuzzy ARTMAP adopts the winner-take-all strategy, so only this winning category has
its weights updated to include the input pattern. The training process is stopped when a
maximum number of epochs are reached, or when there are no more changes to the
weights of the categories within a single epoch.
Over the training process, new categories may need to be created at certain times. In the
beginning when training first started and there are no nodes, a new node is created to start
coding the first input pattern. The weights of a new category are given by
(W )i = 1 ,
i = 1,..., 2 M .
If all categories fail the vigilance test, or if match tracking fails to return a winning
category, a new one will be created.
10
Classification
The classification process of the fuzzy ARTMAP is similar to the training process. The
flowchart in Figure 4 depicts the classification process.
Present input
Activation value competition of
nodes
Pass vigilance
test?
No
Disqualify
node
Yes
Output class of
winning node
Figure 4: Flowchart for simplified fuzzy ARTMAP classification process
For a given input pattern, the activation values of the categories are computed and the
one with highest value undergoes the vigilance test as it did in the training process. If the
category passes the vigilance test, it will be the winner and its class is predicted as the
output class of that input pattern. Otherwise, the test is repeated for the next category
with highest activation value until one is found. In the event that none of the categories
pass the vigilance test, the input pattern is treated as unclassified.
11
2.2. Problem of Overlapping Classes
The fuzzy ARTMAP module has to deal with data from overlapping classes, but certain
problems arise from the use of such kind of data. Data from overlapping classes is
difficult to classify in itself since it can belong to either class. In addition, training the
network with such data also leads to category proliferation.
2.2.1. Category Proliferation
Category proliferation is a well known drawback of fuzzy ARTMAP. It refers to the
excessive creation of categories during training which does not necessarily improve the
performance of the network [17]. More resources will be required, in terms of storage for
the large number of categories, as well as the amount of time needed to carry out training
and testing. Moreover, the generalization capability of the network may be adversely
affected [18].
Different factors may lead to category proliferation, such as noisy data [7] or simply
training with a large data set [18]. However, the problem is most severe when training
with data from overlapping classes [19].
When the distribution of two (or more) classes overlap, input patterns lying in the
overlapping region cannot be accurately nor reliably classified. Fuzzy ARTMAP training
terminates when there are no more changes to the weights of categories in a single epoch,
which means the network will try to correctly classify all of the training input data. As a
result, in the overlapping region between classes, a large number of granular categories
will be created. This will allow all the training input to be correctly classified so there are
no changes to the weights, but these categories may not contribute to overall predictive
accuracy when other data is presented. With more training epochs, more categories are
created to map out the overlapping region, which is illustrated in Figure 5c.
12
(a)
(b)
(c)
Figure 5: Class distribution and hyperbox weight distribution after learning with ρ=0.75. (a) Class
distribution of the data from 2 classes (b) Position of hyperboxes after 1 training epoch (c) Position of
hyperboxes after training until convergence of training data, which required 9 epochs
13
Over the training process, new categories are created under certain circumstances, such as
when there are input data from classes that have not been encountered yet, or when all the
existing nodes fail the vigilance test. However, it is the match tracking process that is the
largest contributor to major increases in the number of categories.
As input patterns lying in the overlapping region may belong to either class, many
hyperbox categories will be created in that region, and they can also be mapped to either
class. Class mismatches are more likely to occur for these data and match tracking will be
triggered off more frequently, and the vigilance parameter is raised. For an input pattern
presented, many class mismatches may occur due to the large number of categories
present in that overlapping region, leading to a magnified temporary increment in the
vigilance parameter brought about by match tracking. A higher value of the vigilance
parameter translates to increased difficulty for existing categories to pass the test, and
hence a new category is more likely to be created to code the input pattern.
Various methods have been proposed to cope with the problem of overlapping classes
and they can be widely classified into two types – post-processing methods that operate
on the network after training has been completed, or modifications to the learning method
to reduce the creation of categories in the first place [13]. The former includes methods
such as rule pruning [20] which removes excess categories based on their usage
frequency and accuracy. The latter includes modifications in the learning method [21]
and weight updating schemes [22], as well as fuzzy ARTMAP variants such as
distributed ARTMAP [23], Gaussian ARTMAP [24] and boosted ARTMAP [25].
2.2.2. Difficulty of Classification
Classification of input patterns are done based on the attribute values of the patterns.
However, when the class distributions of two classes overlap with each other, it is
difficult to classify an input pattern that lies in the overlapping region. Fuzzy ARTMAP
only makes one prediction for the input pattern though it can belong to either class. Even
14
if the activation values for two categories are the same and both pass the vigilance test,
only one will be the winner. This choice is usually made by selecting the category with
smaller index, or simply selecting one at random.
As a result, it would be unfair to expect the network to assign a class prediction
accurately to such an input pattern. Rather than predicting only one class which has a
high chance of being the incorrect one, we seek to modify the network such that it can
predict more than one class, particularly for input patterns that lie in the overlapping
region between classes. Based on the predicted output classes, users can make better
decisions. Other information besides the given attributes can be used, or expert
knowledge can be combined to determine the class from the predicted list.
Certain variants of fuzzy ARTMAP such as probabilistic fuzzy ARTMAP [15] compute
the probability with which a test pattern can belong to each class and predict the output as
the class with highest probability. Fuzzy ARTMAP with relevance factor [26] also gives
a value of confidence in the classification. The distributed ARTMAP [23] uses
distributed learning instead of winner-take-all, and the output class prediction is
implemented using a voting strategy. It is possible to make slight modifications to these
variants so that they can return more than one output class, but implementing these
networks already require major changes to the learning method or architecture and
introduce additional computational costs. The dynamics of the system are also no longer
as straightforward or intuitive as the original fuzzy ARTMAP. This project thus aims to
retain as much of the original architecture as possible and minimize the additional
computational effort introduced by the modifications, yet still enable the network to
output the possible classes in which the pattern lies, and at the same time reduce the
extent of category proliferation.
15