Alpha Stable Human Visual System Models for Digital Halftoning
Bạn đang xem bản rút gọn của tài liệu. Xem và tải ngay bản đầy đủ của tài liệu tại đây (500.71 KB, 12 trang )
Alpha Stable Human Visual System Models for Digital
Halftoning
A. J. Gonz´aleza , J. Baccaa , G. R. Arcea and D. L. Laub
a Department
of Electrical and Computer Engineering
University of Delaware, Newark, DE 19716
b Department of Electrical and Computer Engineering
University of Kentucky, Lexington, KY 40506
ABSTRACT
Human visual system (HVS) modeling has become a critical component in the design of digital halftoning algorithms. Methods that exploit the characteristics of the HVS include the direct binary search (DBS) and optimized
tone-dependent halftoning approaches. The spatial sensitivity of the HVS is lowpass in nature, reflecting the
physiological characteristics of the eye. Several HVS models have been proposed in the literature, among them,
as¨anen’s
the broadly used N¨
as¨anen’s exponential model. As shown experimentally by Kim and Allebach,1 N¨
model is constrained in shape and richer models are needed in order to attain better halftone attributes and to
control the appearance of undesired patterns. As an alternative, they proposed a class of HVS models based on
mixtures of bivariate Gaussian density functions. The mathematical characteristics of the HVS model thus play
a key role in the synthesis of model-based halftoning. In this work, alpha stable functions, an elegant class of
models richer than mixed Gaussians, are exploited. These are more efficient than Gaussian mixtures as they use
less parameters to characterize the tails and bandwidth of the model. It is shown that a decrease in the model’s
bandwidth leads to homogeneous halftone patterns and conversely, models with heavier tails yield smoother
textures. These characteristics, added to their simplicity, make alpha stable models a powerful tool for HVS
characterization.
Keywords: Digital Halftoning, Direct Binary Search, HVS models, Blue noise theory
1. INTRODUCTION
Digital halftoning focuses on the quantization of continuous tone images that minimizes the visibility of artifacts.
In order to apply this concept in practice there is the need for specifying a computational model of the human
visual system (HVS), and to calculate visual error, which can be used to automatically rank halftone images
in increasing order of quality. Relatively simple models for the HVS have proved to be quite successful when
applied to algorithms that search for the best possible halftones. Digital halftoning techniques including screening
algorithms, error diffusion algorithms and iterative halftone methods all use either implicitly or explicitly a model
for the human visual system. In fact, even those methods which cannot be classified as model based, because
they do not include an explicit HVS block within their block diagram (like for example Bayer’s screen2 and Void
and Cluster3 ), nevertheless agree with a model that treats the HVS as a low-pass filter. Kim and Allebach not
only discovered that a HVS model has been crucial for the design of almost every halftoning technique, but also
showed that the shape of any HVS model can be tuned to yield better texture quality in the obtained dither
patterns. Thus the performance of a halftoning algorithm can be maximized by properly designing improved
HVS models.
HVS models have been proposed based on the experimental response of the eye to stimuli in both, frequency
and spatial domains. When the frequency domain is chosen, the model is called the “Modulation Transfer
Function (MTF)” or the “Contrast Sensitivity Function (CSF)” of the human eye. Associated experiments
consist of a square wave grating of dark and light bars where the modulation or contrast of the grating can be
measured as the ratio between the difference of the maximum and minimum amount of light reflected by the
grating to the sum of the two. The width of each bar defines the spatial frequency of the grating, which is varied
from lower to higher frequencies in each experiment. For equally spaced particular frequencies, a subjective
measure of the contrast appreciated by the human viewer is taken, and the ratio between the real contrast of
the image and the contrast resolved by the viewer is used as the contrast sensitivity of the eye for that exact
frequency. The sensitivity of the eye is high (near unity) for low frequencies, but as the frequency is increased,
the eye starts to fail in detecting the real contrast of the grating, and the sensitivity decays to zero.
On the other hand, when a model for the HVS is proposed based on the eye’s response to stimuli in the
spatial domain, the function obtained is called the “Point Spread Function (PSF)”. The PSF and the CSF form
a Fourier pair. Whesteimer4 states that under no circumstances are point objects ever actually imaged as points;
several physical and geometrical optical factors prevent this. As a result, a point object gives rise to a retinal
light distribution that is bell-shaped in cross-section. This distribution is precisely the PSF of the eye and has
significance not only when the object is a point but whenever it is necessary to know the light distribution for a
target more complex than a point source of light, since any visual object can be thought of as made of points.
In applying a HVS model to halftoning, Kim and Allebach1 studied the patterns obtained with the Direct
Binary Search (DBS) algorithm5 using four different models generated in the frequency domain, namely the
models proposed by Campbell,6 Mannos,7 N¨as¨anen8 and Daly.9 Campbell and Mannos’ models are band-pass,
with peak sensitivity around 7 cycles/degree. Mullen10 demonstrated that their measurements had not extended
to very low spatial frequencies correctly since very few bars had been displayed to the viewers at the lowest
frequencies, and a number of bars below four or five is known to reduce sensitivity to this kind of gratings. It is
expected that these models are inadequate in representing the HVS.
Until recently, N¨
as¨anen’s model was the most extensively used model in the context of digital halftoning.
This model is an exponential function of the radial frequency ρ,8 as shown in Table 1, where L is the average
luminance and c, d are constants that make the model fit the experimental data. Although N¨
as¨anen’s model
has proven to be an adequate approximation to the HVS model, Kim and Allebach1 proposed a new and richer
class of HVS models that offer better halftoning results than that produced by the N¨
as¨anen’s model. These
models are based on mixed Gaussian functions whose functional form is shown in Table 1. The advantage of
these models is that their frequency response in terms of bandwidth and tail weight can be optimized by varying
a set of parameters. Such flexibility is not available in N¨
as¨anen’s exponential model. The diversity attained with
mixed Gaussians however, comes at a penalty: overparametrization. A total of four parameters characterize the
mixed Gaussian model, making the tuning process a rather delicate task.
This paper focuses on developing HVS models having flexibility in the design of the tails and bandwidth
of the model without overparametrization. The proposed approach is based on the functions describing alpha
stable random variables.11 These models are richer than mixed Gaussian models (Gaussian random variables
are a sub-family of alpha stable random variables) and they are also simple and succinct with few parameters
needed for their characterization. Notably, empirical approximations to the PSF (obtained by measuring the
response of the eye to spatial stimuli) were found to have the analytical form of the characteristic function of
alpha stable random variables.4 Thus, stable models fit well empirical measurements and at the same time,
they offer unique mathematical characteristics that ultimately render visually pleasant halftones.
2. PRELIMINARIES
2.1. HVS model and the Scale Parameter S
A HVS model is a linear shift invariant filter based on the PSF or the CSF of the human eye. It is denoted
as h(x, y) (x, y in inches) in the spatial domain and as H(u, v) (u, v in cycles/degree) in the frequency domain.
¯ x, y¯) with x
The inverse Fourier transform of H(u, v) yields h(¯
¯, y¯ in degrees. To convert these angular units to
the units on the printed page, notice that a length x inches when viewed at a distance D inches will subtend
an angle of x
¯ degrees satisfying x
¯ = (180/π)(arctan(x/D)) ≈ (180x)/(πD) for x
D. Therefore, assuming a
printer with resolution R (in dpi), the discrete filter characterizing the HVS model in the spatial domain will be
given by
h [m, n] =
1802 ¯
h
π 2 D2
180m 180n
,
πRD πRD
.
(1)
The term S ≡ RD in (1) is called the Scale Parameter. Kim and Allebach1 experimented with different
values of S in HVS models that are used in DBS and demonstrated why this parameter, which in theory should
be determined precisely by the intended viewing distance and printer resolution, in reality serves more as a
free parameter that can be adjusted to yield halftone textures of the desired quality. When the distance (or
the resolution) is increased, the viewer’s eye will reduce its sensitivity at a fixed amount of cycles per degree,
therefore the bandwidth of the HVS filter in the frequency domain is decreased by an amount proportional to the
distance (or resolution) increase. In this scenario, if the viewer observes a printed page from a greater distance
(or if the resolution is larger), it is expected that the eye will perceive a better overall impression of the image
(at the expense of loosing the ability to discern the details of the printed page), i.e. the image will appear in
the viewer’s mind more homogeneous than it was from the original distance. The effect is the contrary if the
distance (or the resolution) is decreased: the bandwidth of the HVS grows, and the textures lose consistency.
2.2. Direct Binary Search (DBS)
The goal of halftoning algorithms is to produce a distribution of printed dots that, when viewed by a human
subject, creates an apparent image indiscernable from the continuous tone original. As a means of generating
visually optimal dot distributions, Allebach and Analoui5 introduced DBS as an iterative halftoning method
which minimizes the error between the perceived continuous tone image and the perceived halftone image by
changing the state of the halftone pixels. In DBS, an initial halftone image g0 [m, n] is provided. The algorithm
evaluates the difference between the original continuous tone image f [m, n] and the initial halftone g0 [m, n] to
produce the error image e[m, n], which is filtered by the HVS model. The filtered error image e˜[m, n] is used
to calculate the metrics (cost) of the algorithm, given by C = m n | e˜[m, n] |2 . Once the cost C has been
calculated, the algorithm starts to evaluate changes in the initial halftone g0 [m, n] that could lead to a decrease
in C. Specifically, for each pixel of g0 [m, n] the algorithm determines if a toggle (change the status of the current
pixel) or a swap (swap the values of the current pixel and one of its 8 nearest neighbor pixels that has a different
value) causes an improvement in the error. The toggle or swap that results in the greatest decrease in the squared
error is accepted. When the first iteration is complete (every pixel in the image has been visited), the process
is repeated over the newly obtained halftone. When no changes are accepted during an iteration, the algorithm
has converged to a local minimum of the error metrics. Notice the strong dependance of this algorithm on the
HVS model. The HVS filter determines what should be understood as a good image and what not. When a
toggle or a swap is being considered, the cost function of the algorithm is determined by the HVS model. It is
not surprising that different models for the HVS produce considerably different DBS halftone results.
2.3. Blue noise model
Blue noise is the statistical model describing the ideal spatial
and spectral characteristics of dispersed-dot dither patterns,12
and in essence, the ideal blue noise halftoning scheme produces
stochastic dither patterns of dots distributed as homogeneously
as possible. Specifically, the blue noise model states that the ideal
spatial distribution of minority pixels representing a constant
gray level g ∈ [0, 1] is one that is aperiodic, isotropic (radially
symmetric) and contains only high frequency spectral energy.13
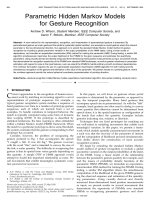
Given the low-pass nature of the HVS, blue noise characterizes Figure 1. The RAPSD measure for an ideal blue
patterns that are visually appealing simply because the spectral noise dither pattern.
components of the pattern lie in the regions least visible to the
human viewer; furthermore, the stochastic distribution of dots
creates a grid-defiance illusion where the structure of the underlying grid on which the pixels are aligned is no
longer apparent to the viewer.14
The blue noise principal frequency fb is defined as15 :
⎧
⎨
√
g
1/2
fb =
⎩ √
1−g
, for 0 < g ≤ 1/4
, for 1/4 < g ≤ 3/4
, for 3/4 < g ≤ 1.
(2)
0
10
0.12
0.1
Mixed Gaussian 1
−1
10
Mixed Gaussian 1
H(ρ)
H(ρ)
0.08
0.06
α-SG, α = 0.95
α-SG, α = 1.05
N¨as¨anen
0.04
−2
10
α-SG, α = 0.95
Mixed Gaussian 2
0.02
N¨as¨anen
0
Mixed Gaussian 2
1/3
α-SG, α = 1.05
1/2
ρ
√
1/ 2
−3
10
0
ρ
1/2
√
1/ 2
Figure 2. Frequency response of N¨
as¨
anen, mixed Gaussian and α-SG filters (left) and their logarithmic view (right).
Figure 1 depicts the radially averaged power spectral density (RAPSD) of an ideal blue noise pattern as
defined by Ulichney. The RAPSD is calculated by taking the average value of the power spectrum of the
patterns within an annular ring and plotting this average versus the radial frequency.13 The blue noise model
places an increased emphasis on the need for maintaining radial symmetry and avoiding periodic textures by
allowing certain amount of clustering for gray levels between 1/4 and 1/2 so that the frequency response of the
patches of gray within this range remains constant. In this way, the spectral energy of the halftones is not packed
into the corners of the baseband, preventing the occurrence of checkerboard patterns. In this paper, the metrics
for the design of visually pleasing halftones will be based on a subjective qualification of pleasantness and also on
the blue noise model, i.e. the RAPSD of the obtained patterns will be compared to the ideal RAPSD in Figure
1.
3. HUMAN VISUAL SYSTEM MODELS
Figure 2 shows the tails of the frequency response of the five models to be studied in this paper. These are radially
symmetric and thus only two dimensional plots of their CSF are presented.
√ A cross-section of the 2-D CSF was
taken along the diagonal so that the radial frequency goes from 0 to 1/ 2. The five filters were generated using
a scale factor S = RD = 300dpi × 9.5in.
3.1. N¨
as¨
anen’s (exponential) model
N¨
as¨anen’s model in Table 1 is a radially symmetric exponential function8 which has been used extensively in
the context of digital halftoning. The logarithmic view of this function
shows the tails decaying linearly down to
√
approximately 10−3 at the maximum radial frequency of ρ = 1/ 2. This is a filter with a bandwidth∗ of 0.078.
3.2. Mixed Gaussian models
Kim and Allebach,1 in an attempt to reduce the computational cost of DBS, proposed the use of two-component
Gaussian functions as models for the HVS. Since the Gaussian filters are radially symmetric, separable, unimodal,
smooth and have a simple closed form Fourier Transform, they are well suited for models of the HVS. Their
initial approach was to find a Gaussian model with parameters optimized to minimize the difference between
this model and N¨
as¨anen’s model, but it was found that a single Gaussian function could not yield a sufficiently
accurate approximation, so they chose a two-component alternative. The functional form of these two-component
Gaussian filters is shown in Table 1.
∗
The bandwidth is defined as the frequency at which the filter has decayed to 50% of its maximum amplitude.
Table 1. Contrast Sensitivity Function and Point Spread Function of HVS models.
Contrast Sensitivity Function
Point Spread Function
Constants
k = c·log1L+d
k
1
N¨
as¨
anen
H (ρ) = exp (−kρ)
h (r) = (2π)2 k 2 3/2
L = 11cd/m2
( 2π +r )
c = 0.525, d = 3.91
(κ1 , κ2 , σ1 , σ2 )I =
”
“
´
`
2
2
2 2 2
r2
Mixed Gaussian
H (ρ) = 2πκ1 σ1 exp −2π σ1 ρ
(h ∗ h) (r) = κ1 exp − 2σ2
(43.2, 38.7, 0.02, 0.06)
” 1
“
´
`
2
2 2 2
r2
+2πκ2 σ2 exp −2π σ2 ρ
+κ2 exp − 2σ2
(κ1 , κ2 , σ1 , σ2 )II =
Model
2
(∗ means convolution)
α-stable
No closed form
h (r) = K exp (γ rα )
(19.1, 42.7, 0.03, 0.06)
I
(α, γ ) = (0.95, 27)
II
(α, γ ) = (1.05, 27)
K is a normalization constant
Kim and Allebach could not find one single filter which works best for every level of gray, so they used two
different filters. The constants that characterize the first (I) and the second (II) mixed Gaussian models are
shown in Table 1. The cross section of these filters along the diagonal is presented in Figure 2. It can be seen
that the second model has wider bandwidth than the first, and both present exponential order tails, which means
that, as the radial frequency is increased, the CSF of the mixed Gaussian filters decays faster than the CSF of
the exponential model.
3.3. Alpha Stable models
HVS models used in DBS are commonly derived from empirical approximations to the CSF. That is the case in
the N¨
as¨anen and the mixed Gaussian models described before. However, modeling of the PSF from experimental
observations is a full fledged discipline within the area of the physiological optics. The experimental determination
of the eye’s PSF is carried out with the use of instruments designed to measure the entire refractive error of the
eye that causes the effect of blurred vision. These instruments are called “wavefront sensors” or “aberrometers”.
A wavefront sensor measures the shape of the wavefronts of light (surfaces of constant phase) that exit the eye’s
pupil. If the eye were a perfect optical system, these wavefronts would be perfectly flat, and the eye’s PSF would
be infinitely narrow. Since the eye is not perfect, the wavefronts are not flat and have irregular curved shapes,
and its PSF has a bandwidth greater than zero.
Interestingly enough, the work of Whesteimer4 models the shape of the PSF with
h(r) = 0.952 exp −2.59 |r|
1.36
+ 0.048 exp −2.43 |r|
1.74
(3)
which is close in form to the characteristic function of the α-stable distributions. If the PSF of the HVS model
has the form of (3), its CSF will have algebraic tails,11 hence it might be a good idea to use models whose tails
are heavier than that obtained with exponential and mixed Gaussian models. This fact provides the physiological
foundation to the use of α-stable models to characterize the HVS.
Stable distributions describe a rich class of processes that allow heavy tails and skewness in their functions.11
The class was characterized by L´evy in 1925.16 Stable distributions are described by four parameters: an index
of stability α ∈ (0, 2], a dispersion parameter γ > 0, a skewness parameter δ ∈ [−1, 1], and a location parameter
β ∈ R. The stability parameter α measures the thickness of the tails of the distribution and provides this model
with the flexibility needed to characterize a wide range of impulsive processes. The dispersion γ is similar to
the variance of the Gaussian distribution. When the skewness parameter is set to δ = 0, the stable distribution
is symmetric about the location parameter β. Symmetric stable processes are also referred to as symmetric
α-stable or simply SαS.
In HVS modelinig, bivariate SαS distributions will be used for the characterization. In particular, the focus
will be on a subclass of them, the so-called α-sub-Gaussian (α-SG(R)) random vectors,17 whose characteristic
function is of the form
φ(t) = exp −
1 T
t Rt
2
α/2
where t = [x, y]T is a two dimensional column vector and the
matrix R is positive definite. This characteristic function will be
used to model the PSF of the HVS. In order to guarantee radial
symmetry for the filters, the matrix R will be of the form
γ
0
0
γ
(5)
where γ > 0 is the dispersion parameter for the model. With this
form of the matrix R and expanding the index of the exponential,
the PSF in (4) becomes
1
φ(x, y) = exp − γ α/2 x2 + y 2
2
α/2
(6)
r≥0
−1
10
α = 0.95
α = 1.05
α = 1.15
−2
10
α = 1.25
It is possible to simplify (6) one step further by transforming
the rectangular coordinates into polar coordinates, resulting in
1
φ(r) = exp − γ α/2 rα ,
2
10
H(ρ)
R=
(4)
(7)
√
−1/ 2
−1/2
ρ
1/2
√
1/ 2
Figure 3. Logarithmic view of the frequency response of α-SG filters.
with r2 = x2 + y 2 and where α ∈ (0, 2] is the index of stability that determines the heaviness of the model’s tails.
For simplicity in the notation the term 12 γ α/2 in (7) is replaced by one only term that is called γ . Figure 3 shows
the CSF of α-SG HVS models with different values of α. The CSF of these models is obtained by sampling the
PSF in (7), truncating it and finding its inverse Discrete Fourier Transform (IDFT), a procedure that carries no
computational burden. Notice that this approximation based on the IDFT could not be applied if an α-stable
probability density function were being sought.
4. ANALYSIS OF DBS HALFTONE PATTERNS WITH DIFFERENT HVS MODELS
4.1. N¨
as¨
anen’s (exponential) model
The first row in Figure 4 shows the DBS halftone results obtained using the N¨
as¨anen’s model over the image
“Barbara” and two different patches of gray: g = 22% and g = 50%. A frequency analysis of these signals
sheds light on the capacity of these filters to generate halftones that are visually pleasant. The first spectral
measure evaluated is the two dimensional power spectral density (PSD) for each of these patterns, depicted in
the right center column of Figure 4. The superimposed black circles mark the location of the principal frequency.
Dark regions of the spectra are maxima, and light regions are minima. These spectra suggest that the halftones
generated with the N¨
as¨anen’s model satisfy the radial symmetry imposed by the blue noise model. If this holds,
one can analyze the RAPSD which gives a more quantitative notion of the frequency response of the halftones.
As mentioned before, the RAPSD is simply a radial average of the PSD. It is important to note that if the power
spectral densities are not radially symmetric, the RAPSD will not be accurate.
The right column of Figure 4 displays the corresponding RAPSD of the dither patterns obtained with the
N¨
as¨anen’s model. The vertical axis in each plot is normalized to σg2 = g(1 − g), the variance of a single pixel, as
defined by Ulichney.12 The principal frequency according to the blue noise model is indicated with a vertical line.
This model’s RAPSD fits well the blue noise model for gray level g = 22%, with little or no low frequency spectral
components; a flat, high frequency spectral region of amplitude σg2 and a spectral peak at cutoff frequency fb , the
blue noise principal frequency. At gray level g = 50%, the high frequencies exhibit a normalized amplitude bigger
than unity (an excess of high frequency energy). For this level of gray, the highest value of the RAPSD is clearly
above f = 1/2, which means that the energy has been packed into the corners of the baseband. In the spatial
3
2.5
22%
N
a
¨
s
a
¨
n
e
n
M.
G
a
u
s
s
i
a
n
1
M.
G
a
u
s
s
i
a
n
2
2
1.5
1
0.5
50%
0
0
ρ
1/2
√
1/ 2
ρ
1/2
√
1/ 2
ρ
1/2
√
1/ 2
ρ
1/2
√
1/ 2
ρ
1/2
√
1/ 2
3
2.5
22%
2
1.5
1
0.5
50%
0
0
3
2.5
22%
2
1.5
1
0.5
50%
0
0
3
2.5
22%
2
1.5
α
S
G
1
1
0.5
50%
0
0
3
2.5
22%
2
1.5
α
S
G
2
1
0.5
50%
0
0
Figure 4. Spectral analysis of DBS halftones. A portion of the “Barbara” image (left), halftone patches for g = 22% and
g = 50% using different HVS models (left center), PSD (right center) and RAPSD (right) of corresponding gray patches.
In the RAPSD, the dashed line corresponds to g = 22%, fb = 0.47, and the solid line corresponds to g = 50%, fb = 0.5;
the vertical line indicates the position of the principal frequency.
domain, this packing of energy is achieved by adding correlation between minority pixels along the diagonal,
creating an unpleasant checkerboard pattern that can be observed in the patch of the left center column for the
corresponding gray level (g = 50%). These checkerboard patterns can also be seen in the gray ramp obtained
with this model (top of Figure 5) in the zone of the middle gray tones.
4.2. Mixed Gaussian models
The halftones generated with the two mixed Gaussian models are shown in the second and third rows of Figure
4, and their gray ramps are also the second and the third of Figure 5. They show that the first model produces a
very smooth halftone result overall, but generates patchy textures with checkerboard artifacts in midtone areas.
The second model, in contrast, generates acceptable results in midtone areas and in areas of extreme tone, but
around the quarter tones, especially at g = 75%, the arrangement of dots is granular, giving the texture an
undesirable rough aspect. The first model presents clipping at extreme tone levels (see how the minority pixels
do not migrate far away in the extremes of the second ramp in Figure 5) while, on the other hand, the second
filter does a better job in this regards, producing a more homogeneous halftone gray ramp (third ramp of Figure
5). This phenomenon has to do with the bandwidth of the filter. The second mixed Gaussian filter, having a
narrower bandwidth than the first, presents a more homogeneous response, as was explained in section 2.
The right center column of Figure 4 verifies the condition of radial symmetry in the PSD of the gray patches
obtained with these models. The two filters exhibit a RAPSD that complies with the blue noise model for low
levels of gray (not shown). The interesting (and revealing) phenomena start to happen at g = 22%. The first
mixed Gaussian model shows an acceptable response using this filter for gray level g = 22%, with cutoff frequency
accurately located. However, exactly the same phenomenon that was observed with the N¨as¨anen’s model occurs
here for gray level g = 50%: the cutoff frequency of the pattern goes beyond f = 1/2 and the peak goes past
the limits of the plot. This high amount of energy is concentrated in the corners of the baseband, implying that
checkerboard patterns must have appeared in the spatial pattern for g = 50%. The right side of the second ramp
of Figure 5 shows that this is exactly the case: checkerboard patterns give this region of the ramp a disturbing
appearance as a consequence of the discontinuities in texture that they cause. The phenomenon observed with
the second mixed Gaussian model is the opposite: for gray levels g = 22% and g = 50% the RAPSD remains
unchanged —which is desirable— but the cutoff frequency falls below f = 1/2. This excess of low spectral energy
inside the radial frequency f = 1/2 is introduced by a disproportionate clustering of minority pixels that gives
the patterns the coarse look that Kim and Allebach had observed. Although Lau et.al.18, 19 demonstrate why the
existence of some spectral energy inside the principal frequency ring achieves radial symmetry, it is clear that
the clustering of minority pixels will have desirable properties for halftoning only if it is not done to an extreme.
These phenomena are discernable also in the halftones of the image “Barbara” in Figure 4.
The two filters are identical within the region between DC to radial frequency f = 0.12, at which point the
tails of the filters start to deviate from one another; the first filter being the one that exhibits heavier tails (see the
logarithmic view of the cross-sections, Figure 2). It is not surprising that the two filters expose similar halftone
results for gray levels below g = 25%. Beyond gray level g = 25%, the energy in the second mixed Gaussian
filter decreases (lower tails) causing the pattern to feel less force moving energy to higher radial frequencies and
hence, preventing it from achieving a cutoff frequency higher than fb = 1/2. In the spatial domain this low cutoff
frequency is achieved by allowing certain amount of clustering. On the other hand, the first mixed Gaussian
model, which has heavier tails —and hence is capable of pushing spectral energy to the high frequency bands—
produces generally smooth results (does not allow clustering), but generates periodic textures in midtone areas,
as a consequence of energy packed into the corners of the baseband. An ideal HVS model must lay somewhere
in the middle of these two mixed Gaussian models. First, this ideal model needs to have a sufficiently narrow
bandwidth to guarantee the homogeneity of the halftones. Second, the model must be versatile enough so that
the designer can easily play with the heaviness of its tails without varying its bandwidth, making possible an
optimization to achieve smoothness without compromising homogeneity. N¨
as¨anen’s (exponential) model will not
satisfy the first condition since in order to change the heaviness of its tails, the bandwidth must be varied. The
mixed Gaussian models can allow this tradeoff, but the fact that four constants need to be specified in order to
completely define the model makes it a rather intricate filter to design. A simpler approach is given by an alpha
stable HVS filter, as described next.
Figure 5. DBS gray ramps using the the N¨
as¨
anen’s model (first), the first mixed Gaussian model (second), the second
mixed Gaussian model (third), the α-SG model with α = 0.95 (fourth) and the α-SG model with α = 1.05 (fifth).
4.3. Alpha Stable models
In α-stable models, the parameter γ in (7) (as well as the
scale parameter S = RD) determines the bandwidth of the filter
and consequently the homogeneity of the halftones. The parameter α controls the heaviness of the tails of the filter hence the
smoothness/coarseness of the dither patterns. This relationship Figure 6. Relationship between the parameter
between α and the characteristics of the halftones is illustrated α and the quality of the halftones.
in Figure 6. It was found experimentally that a model with a
bandwidth around 0.08 produces the homogeneity that is being
sought. It was also found that a good point to start in terms of heaviness of tails is to have an initial model that
satisfies H(ρ)|ρ= √1 ≈ 10−2 . The proposed starting model is labeled in Figure 2 as “α-SG, α = 0.95”. It was
2
generated with constants α = 0.95, γ = 27, D = 9.5in, R = 300dpi. The initial size of the model was N = 101,
although it was possible to truncate it further to obtain a final N = 31. Notice how the shape of the α-SG model
being proposed dramatically differs from the other three models, especially in the logarithmic view (Figure 2).
The fourth ramp of Figure 5 corresponds to the gray ramp obtained with this model; notice that the extreme
tones of the ramp were effectively improved with respect to the mixed Gaussian models. However, the RAPSD
for gray level g = 50% (fourth row of Figure 4) demonstrates that the cutoff frequency is going beyond its ideal
position, hence and improvement of the model is due. The procedure to follow at this point is to start generating
models where the heaviness of the tails is slowly decreased, i.e. the α value is slightly increased, so that the
spectral energy in the RAPSD starts to be pulled to lower frequencies. The value of α is not increased anymore
when gray patterns with a RAPSD that satisfies the blue noise model are found, and their subjective appearance
is highly qualified. It was found that a model with α = 1.05 would yield the spectral response that is being
sought. This new model is shown in Figure 3. Notice that the second filter has lower tails than the initial filter.
This function must be normalized, but it cannot be multiplied by the inverse of its maximum value because
that would affect the heaviness of its tails and consequently the quality in the halftone patterns that is being
pursued. What is proposed is to pass this filter through a rectifying block that can be easily implemented with
the hyperbolic tangent function tanh(x) = (exp(x) − exp(−x))/(exp(x) + exp(−x)).
The final rectified filter is plotted in Figure 2, labeled as “α-SG, α = 1.05”. This filter provides all the
characteristics of an ideal dither pattern for all tones of gray in both the frequency and the spatial domains.
The fifth ramp of Figure 5 is the one generated with this model. The halftone shows that the extreme zones
maintain the good characteristics of the initial α-SG model, and the quarter tones are smooth and pleasant.
Moreover, the middle tones are free from periodic artifacts. These same characteristics can be verified in the
gray patches of the fifth row of Figure 4, and in their radially averaged frequency responses. These RAPSDs
show no accumulation of energy below f = 1/2 (no exaggerated clustering) nor beyond (no packing of energy
into the corners of the baseband). This model generates dither arrays that comply, from all points of view, with
the blue noise model proposed by Lau and Ulichney.
5. HVS MODELS FOR DBS SCREENS DESIGN
In order to obtain halftone images with quality similar to that yielded by DBS but without its computational
burden, it is possible to use the DBS algorithm to design a dither matrix. The halftoning process using screens
reduces to a thresholding operation at each pixel. Allebach and Lin20 have shown that these screens in fact are
able to maintain halftone image quality while significantly reducing the required computation.
To design a dither matrix, a halftone pattern for each gray level must be generated subject to the stacking
constraint. Initially a pattern for an intermediate gray level is generated, and then lighter patterns are produced
by gradually removing dots; and darker patterns by gradually adding dots.
The initial intermediate pattern is generated with the DBS algorithm described in section 2, with the difference
that only swaps are considered; toggles are discarded since using them would alter the average gray level of the
initial pattern. After the initial pattern has been designed, the lighter and darker patterns are generated using
a similar process. Suppose a lighter pattern is to be designed. A given number of dots corresponding to the
Figure 7. Gray ramps obtained with DBS screens of size 128 × 128 generated using the α-SG model with α = 0.95 (first)
and the α-SG model with α = 1.05 (second).
difference in adjacent gray levels are deleted randomly from the initial pattern. In order to satisfy the stacking
property of the dither matrix patterns, only the positions of the newly deleted dots are allowed to be moved.
The metrics of DBS is again minimized using the swap and toggle operations. It is important to realize that if
it is needed to keep the exact dot number in the refined pattern, the toggling should be disabled. To generate
the darker patterns, a similar process is performed starting with the addition of dots to the previously designed
pattern. The final dither matrices can be obtained by summing the binary patterns for all gray levels. Different
DBS screens can be obtained if different HVS models are used in the process. As expected, the same appreciations
described in the sections on the results obtained by DBS with the different HVS models also hold for the results
produced using the screens. Figure 7 shows the gray ramps generated with the DBS screens of size 128 × 128
corresponding to the α-SG HVS models. The similarity with the ramps of Figure 5 is easily verified.
6. CONCLUSIONS
The characteristics of the HVS model in a digital halftoning algorithm play a dramatic role in the performance
of the algorithm. In the particular case of DBS, the frequency response of the filter determines the quality of
the output in terms of homogeneity, coarseness, smoothness and appearance of artifacts. Blue noise theory,
which gives strong importance to the radial symmetry of the frequency response of the dither patterns, provides
a quantitative approach to qualify the characteristics of the halftones. The characteristic function and the
probability density function of bivariate α-SG random variables provide a powerful tool for modeling the PSF
and the CSF of the HVS, respectively. These functions can be easily tuned to yield a HVS model which, when
used in DBS, produces results that comply with the blue noise model for all levels of gray. When these filters
are used to generate DBS masks, the characteristics of the screening outputs agree with the characteristics of
the halftone results yielded by DBS using each corresponding HVS model.
7. ACKNOWLEDGEMENT
In completing this paper, we would like to acknowledge the financial support of Agere Systems and the assistance
and professional guidance received from Natalya Lyubashevskaya, Dr. Steven Pinault and Dr. Anatoly Moskalev.
We would also like to thank Dr. Sang Ho Kim at Samsung Electronics and Dr. Jan P. Allebach at Purdue
University for their valuable contributions during the first stages of this research work. Finally, a great deal of
thanks is also directed to Cory Budischak at University of Delaware for his contributions in the development of
part of the software used in this project.
REFERENCES
1. S. H. Kim and J. P. Allebach, “Impact of HVS models on model-based halftoning,” IEEE Transactions on
Image Processing 11, pp. 258–269, March 1995.
2. B. E. Bayer, “An optimum method for two-level rendition of cotinuous-tone pictures,” Proceedings of the
IEEE International Conference on Communications 26, pp. 2611–2615, June 1973.
3. R. A. Ulichney, “The void-and-cluster method for dither array generation,” Proceedings SPIE, Human
Vision, Visual Processing, Digital Displays IV 1913, pp. 332–343, 1993.
4. G. Whesteimer, “The eye as an optical instrument,” Handbook of Human Perception and Performance ,
pp. 325–345, 1986.
5. M. Analoui and J. P. Allebach, “Model-based halftoning using direct binary search,” Proceedings IS&T/SPIE
International Symposium on Electronic Imaging Science and Technology 1666, pp. 96–108, February 1992.
6. F. W. Campbell, R. H. S. Carpenter, and J. Z. Levinson, “Visibility of aperiodic patterns compared with
that of sinusiodal gratings,” Journal of Physiology 204, pp. 283–292, 1969.
7. J. L. Mannos and D. J. Sakrison, “The effects of a visual fidelity criterion on the encoding of images,” IEEE
Transactions on Information Theory IT-20, pp. 525–536, July 1974.
8. R. N¨
as¨anen, “Visibility of halftone dot textures,” IEEE Transactions on Systems, Man and Cybernetics 14,
pp. 920–924, November 1984.
9. S. Daly, “Subroutine for the generation of a two dimensional human visual contrast sensitivity function,”
Eastman Kodak, Tech. Rep. 233203y , 1987.
10. K. T. Mullen, “The contrast sensitivity of human colour vision to red-green and blue-yellow chromatic
gratings,” Journal of Physiology 359, pp. 381–400, March 1985.
11. G. R. Arce, Nonlinear Signal Processing, Wiley and Sons, Hoboken, NJ, 2004.
12. R. A. Ulichney, “Dithering with blue noise,” Proceedings of the IEEE 76, pp. 56–79, January 1988.
13. D. L. Lau and G. R. Arce, Modern Digital Halftoning, Marcel Dekker, New York, NY, 2001.
14. D. L. Lau, R. Ulichney, and G. R. Arce, “Blue- and green-noise halftoning models,” IEEE Signal Processing
Magazine , pp. 28–38, July 2003.
15. D. L. Lau and R. A. Ulichney, “Blue-noise halftoning for hexagonal grids,” IEEE Transactions on Image
Processing , To appear.
16. P. L´evy, Calcul des probabilit´es, Gauthier-Villars, Paris, FR, 1925.
17. S. Cambanis and G. Miller, “Linear problems in pth order and stable processes,” Journal of Applied Math 41,
pp. 43–69, August 1981.
18. D. L. Lau, G. R. Arce, and N. C. Gallagher, “Green-noise digital halftoning,” Proceedings of the IEEE 86,
pp. 2424–2444, December 1998.
19. D. L. Lau, G. R. Arce, and N. C. Gallagher, “Digital halftoning by means of gree-noise masks,” Journal of
the Optical Society of America 16, pp. 1575–1586, July 1999.
20. J. P. Allebach and Q. Lin, “Fm screen design using dbs algorithm,” Proceedings of the IEEE International
Conference on Image Processing 1, pp. 549–552, September 1996.