Effects of space relevant radiation on pre osteoblasts
Bạn đang xem bản rút gọn của tài liệu. Xem và tải ngay bản đầy đủ của tài liệu tại đây (3.76 MB, 135 trang )
Effects of space-relevant radiation on pre-osteoblasts
Dissertation
zur
Erlangung des Doktorgrades (Dr. rer. nat.)
der
Mathematisch-Naturwissenschaftlichen Fakultät
der
Rheinischen Friedrich-Wilhelms-Universität Bonn
vorgelegt von
Yueyuan Hu
aus
Xiangtan, Hunan, China
Bonn 2014
Angefertigt mit Genehmigung der Mathematisch-Naturwissenschaftlichen Fakultät der
Rheinischen Friedrich-Wilhelms-Universität Bonn
1. Gutachter:
Prof. Dr. Waldemar Kolanus
2. Gutachter:
PD Dr. Ruth Hemmersbach
Tag der Promotion: February 12, 2014
Erscheinungsjahr: 2014
Table of Contents
Table of Contents
Table of Contents ............................................................................................................. I
List of figures .................................................................................................................. IV
List of tables ................................................................................................................... VI
1.
Introduction .............................................................................................................. 1
1.1
Space radiation .................................................................................................. 1
1.2
Effects of ionizing radiation on humans.............................................................. 5
1.3
Effects of ionizing radiation on cells ................................................................... 7
1.3.1
Radiation induces DNA damage.................................................................. 7
1.3.2
Repair of DNA damage................................................................................ 9
1.3.3
Radiation induces cell cycle arrest ............................................................ 10
1.3.4
p21 in cell cycle regulation......................................................................... 12
1.3.5
p53 and Mdm2 regulation .......................................................................... 13
1.3.6
Radiation induces cellular senescence ...................................................... 14
1.4
Radiation effects on osteoblast differentiation .................................................. 15
1.4.1
Bone remodeling ....................................................................................... 15
1.4.2
Radiation induces bone loss ...................................................................... 17
1.4.3
Osteoblasts and bone formation ................................................................ 17
1.4.4
Effect
of
radiation
exposure
on
osteoblastic
differentiation
and
mineralization ......................................................................................................... 19
1.4.5
1.5
2.
p53 and osteoblast differentiation .............................................................. 20
Aim of the thesis............................................................................................... 21
Materials and Methods ........................................................................................... 22
2.1
Materials .......................................................................................................... 22
2.1.1
Laboratory equipments .............................................................................. 22
I
Table of Contents
3.
2.1.2
Consumable materials, reagents and kits .................................................. 23
2.1.3
Buffers, solutions and culture medium ....................................................... 25
2.1.4
Softwares................................................................................................... 27
2.1.5
Cell lines .................................................................................................... 27
2.1.6
Cell culture................................................................................................. 28
2.1.7
Inhibitor experiments ................................................................................. 28
2.1.8
Osteogenic induction ................................................................................. 28
2.1.9
Radiation exposure .................................................................................... 28
2.1.10
Senescence-associated β-galactosidase assay ..................................... 35
2.1.11
Proliferation analysis .............................................................................. 35
2.1.12
Cell cycle analysis .................................................................................. 36
2.1.13
Gene expression analysis ...................................................................... 38
2.1.14
Assessment of extracellular matrix mineralization .................................. 45
2.1.15
Immunofluorescence staining ................................................................. 46
2.1.16
Statistical analyses ................................................................................. 47
Results ................................................................................................................... 48
3.1
Effects of ionizing radiation on the cellular survival of pre-osteoblasts............. 49
3.1.1
Cellular survival of OCT-1 cells after exposure to different radiation qualities
.................................................................................................................. 49
3.1.2
Relative efficiency of OCT-1 cell killing by different radiation qualities ...... 51
3.1.3
Cellular survival of C3H10T1/2 cells after exposure to different radiation
qualities .................................................................................................................. 53
3.1.4
Relative efficiency of C3H10T1/2 cell killing by different radiation qualities ...
.................................................................................................................. 54
3.1.5
3.2
Comparison of relative killing efficiency in C3H10T1/2 and OCT-1 cells ... 55
Cell cycle progression after irradiation with X-rays and heavy ions.................. 56
II
Table of Contents
3.2.1
Cell cycle progression after X-ray and heavy charged particle exposure .. 56
3.2.2
Comparison of cell cycle progression at 1% cellular survival level ............ 58
3.2.3
CDKN1A expression at mRNA level .......................................................... 62
3.2.4
Role of p53 in X-ray-induced cell cycle arrest............................................ 64
3.2.5
Effects of radiation on p53 and Mdm2 expression ..................................... 70
3.3
4.
Effects of ionizing radiation on cellular differentiation of pre-osteoblasts ......... 73
3.3.1
Cell morphology after radiation exposure .................................................. 74
3.3.2
Senescence of OCT-1 cells after X-ray exposure ...................................... 76
3.3.3
Effects of irradiation on production of mineralized matrix by OCT-1 cells .. 77
3.3.4
Effects of osteogenic differentiation medium on radiation effects in OCT-1
cells
.................................................................................................................. 79
3.3.5
Effects of radiation on pre-osteoblast differentiation .................................. 83
Discussion .............................................................................................................. 88
4.1
Cellular survival after exposure to ionizing radiation ........................................ 89
4.2
Radiation and p53 in cell cycle progression of OCT-1 cells ............................. 94
4.3
Radiation and p53 in the osteoblast differentiation and mineralization............. 99
4.4
Outlook ........................................................................................................... 103
5.
Summary.............................................................................................................. 105
6.
Reference list ....................................................................................................... 106
7.
Abbreviations ....................................................................................................... 122
Acknowledgements ..................................................................................................... 126
Curriculum Vitae .......................................................................................................... 128
III
List of figures
List of figures
Figure 1-1
Space radiation environment in our solar system ..................................... 2
Figure 1-2
Depth distribution of radiation dose in water ............................................ 6
Figure 1-3
Comparison of particle tracks in human cells and nuclear emulsions ...... 8
Figure 1-4
Radiation tracks produced by an X-ray photon and by a heavy charged
particle in the DNA double helix ...................................................................................... 9
Figure 1-5
Molecular organization of cell cycle checkpoints that might result in cell
cycle arrest in response to DNA DSBs .......................................................................... 11
Figure 1-6
Negative regulation of G1, S and G2 transition by p21 .......................... 13
Figure 1-7
Bone remodeling cycle ........................................................................... 15
Figure 1-8
Genes involved in osteoblast differentiation ........................................... 18
Figure 1-9
The relationship between osteoblast proliferation and differentiation
during their development ............................................................................................... 19
Figure 2-1
Experiment setup for heavy ion irradiation at GSI in Darmstadt (A) and
GANIL in Caen, France (B) ........................................................................................... 30
Figure 2-2
Single hit multi target model of a survival curve for mammalian cells
exposed to ionizing radiation ......................................................................................... 33
Figure 2-3
AFIGE
Example of a dose effect curve for DNA DSB induction determined by
............................................................................................................... 35
Figure 2-4
Cell cycle flow cytometry data analysis .................................................. 38
Figure 2-5
Electropherogram analysis ..................................................................... 40
Figure 2-6
Real time qPCR amplification plots ........................................................ 42
Figure 2-7
Melting curves of real time PCR ............................................................. 43
Figure 2-8
Real time PCR standard curve ............................................................... 44
Figure 3-1
Survival curves of OCT-1 cells exposed to low-LET X-rays or high-LET
accelerated charged particles ....................................................................................... 50
Figure 3-2
Relative efficiency of OCT-1 cell killing by different radiation qualities ... 53
Figure 3-3
Survival curves of C3H10T1/2 cells........................................................ 54
Figure 3-4
Comparison of the LET dependence of the RBE for reduction in colony
forming ability calculated from D0, for OCT-1 and C3H10T1/2 cells .............................. 55
Figure 3-5
Accumulation of OCT-1 cells in the G2/M phase after irradiation ........... 57
Figure 3-6
RBE categories for cell cycle analysis .................................................... 58
Figure 3-7
Calculated 1% cellular survival dose ...................................................... 59
IV
List of figures
Figure 3-8
Cell cycle progression in OCT-1 cells after exposure to radiation doses
resulting in 1% cellular survival and to 4 Gy .................................................................. 61
Figure 3-9
Effects of radiation exposure on CDKN1A mRNA levels ........................ 63
Figure 3-10
The effects of X-rays and/or cyclic pifithrin-α on cell cycle progression.. 65
Figure 3-11
OCT-1 cells accumulated in G2/M phase ............................................... 66
Figure 3-12
Gene expression kinetics of CDKN1A, TP53, and Mdm2 ...................... 67
Figure 3-13
Gene expression kinetics of CDKN1A, TP53, and Mdm2 ...................... 69
Figure 3-14
Immunostaining of p53 in OCT-1 cells after X-irradiation ....................... 70
Figure 3-15 Immunostaining of p53 in OCT-1 cells after X-irradiation in presence of
cyclic pifithrin-α.............................................................................................................. 71
Figure 3-16
Immunostaining of Mdm2 in OCT-1 cells after X-irradiation ................... 72
Figure 3-17 Immunostaining of Mdm2 in OCT-1 cells after X-irradiation in presence of
cyclic pifithrin-α.............................................................................................................. 73
Figure 3-18
Morphology of OCT-1 cells after X-ray exposure ................................... 75
Figure 3-19
Senescence staining of OCT-1 cells after X-ray exposure ..................... 76
Figure 3-20
irradiation
Deposition of mineralized extracellular matrix by OCT-1 cells after X............................................................................................................... 77
Figure 3-21
Calcium deposition by OCT-1 cells after X-ray exposure ....................... 78
Figure 3-22
Survival after X-irradiation without or with osteogenic induction ............. 79
Figure 3-23
irradiation
DNA double strand break (DSB) repair kinetics of OCT-1 cells after X............................................................................................................... 80
Figure 3-24 Proliferation of OCT-1 in absence or presence of OI medium after
exposure to different radiation qualities ......................................................................... 82
Figure 3-25
TGF-β1 expression in OCT-1 cells after X-ray exposure........................ 84
Figure 3-26 TGF-β1 expression in OCT-1 cells after X-ray exposure in presence of
cyclic pifithrin-α.............................................................................................................. 85
Figure 3-27
Runx2 expression in OCT-1 cells after X-irradiation............................... 86
Figure 3-28 Runx2 expression in OCT-1 cells after X-ray exposure in presence of
cyclic pifithrin-α.............................................................................................................. 87
Figure 4-1
Cellular radiation effects in pre-osteoblasts............................................ 88
Figure 4-2
The effect of radiation and cyclic pifithrin-α on Runx2 and TGF-β1 during
OCT-1 osteogenic differentiation ................................................................................. 103
V
List of tables
List of tables
Table 2-1
Laboratory equipments .............................................................................. 22
Table 2-2
Consumables............................................................................................. 23
Table 2-3
Reagents and kits ...................................................................................... 24
Table 2-4
Buffers and solutions ................................................................................. 25
Table 2-5
Culture medium ......................................................................................... 26
Table 2-6
Software .................................................................................................... 27
Table 2-7
Characteristics of heavy ion irradiation ...................................................... 30
Table 2-8
genes
Primer sequences for PCR of cell cycle regulating genes and reference
.................................................................................................................. 41
Table 2-9
Primary antibodies ..................................................................................... 46
Table 2-10 Secondary antibodies ................................................................................. 47
Table 3-1 Parameters of the survival curves (n, Dq, D0, D1%) and RBE of different ion
species in OCT-1 cells (sorted from smallest to largest LET)........................................ 52
Table 3-2 Parameters of the survival curves (n, Dq, D0, D1%) resulting from exposure
of C3H10T1/2 cells to different radiation qualities and RBE .......................................... 54
Table 4-1
curve)
Cell survival parameters after X-ray exposure (single fraction survival
.................................................................................................................. 91
VI
Introduction
1. Introduction
Space programs are now shifting towards long-term exploration missions, particularly to
the Moon and Mars. However, space exploration is an adventure for humankind
because of the extreme environment including microgravity and ionizing radiation. This
environment causes a number of health problems. For example, the immune system
response is weakened (Sonnenfeld, 2005), the muscular system experiences atrophy
(Ruegg et al., 2003), bone loss can be recognized during and after space travel
(Nagaraja and Risin, 2013), and there is a substantial increase in the risk of
carcinogenesis and of the development of degenerative diseases (Durante and
Cucinotta, 2008). In space, heavy ions as a component of space radiation present
substantial but poorly understood risks during and after space missions. Extended
exposure to microgravity results in significant bone loss; coupled with space radiation
exposure, this phenomenon may place astronauts at a greater risk for fracture due to a
critical decrease in bone mineral density.
Until now, the biological effects of space relevant radiation on bone cells especially the
bone forming osteoblasts are poorly understood. Therefore, it is crucial to understand
the
effects
of
ionizing
radiation
on
osteoblasts
and
to
develop
effective
countermeasures to reduce the bone fracture risk and to ensure the safety of space
travelers during the mission and after return to Earth.
1.1
Space radiation
The radiation field in space is very complex and has a different quantity and quality
compared to the conditions on Earth. The interplanetary radiation field contains primary
galactic cosmic rays (GCR) and solar energetic particles (SEP). Charged particles
traveling through materials such as shielding, spacecraft walls, space suits and human
tissue produce secondary radiation via nuclear reactions (Figure 1-1).
1
Introduction
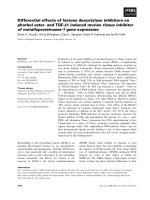
Figure 1-1
Space radiation environment in our solar system
Space radiation consists of galactic cosmic rays originating outside of our solar system
(containing heavy charged particles), and solar energetic particles originating from solar flares or
coronal mass ejections (mainly protons, electrons, ions, X-rays) (Figure from Hellweg and
Baumstark-Khan 2007).
Solar particle events (SPEs) consist primarily of protons and helium ions and occur
sporadically, depending on the solar activity which follows an 11-year cycle. During the
solar minimum phase, few events occur, whereas during each solar maximum phase,
large events may occur even several times and they may last for several days to weeks,
with temporary increases of the radiation dose.
GCR originates from outside the solar system and consists mainly of charged particles
(98% baryons and 2% electrons). These charged particles include about 1% heavy ions
(HZE particles) which have high charge (Z) and energy (E) (Bucker and Facius, 1986;
2
Introduction
Hellweg and Baumstark-Khan, 2007). The energy spectrum of GCR peaks near 1000
MeV per nucleon (MeV/n) (Wilson et al., 1995). Recent measurements with the
Radiation Assessment Detector on the Mars Science Laboratory (MSL) showed that,
with current propulsion systems during the shortest exploratory round trip to Mars of 253
days, the accumulated equivalent dose 1 was found to be 0.66 ± 0.12 Sievert (Sv) inside
MSL spacecraft (Zeitlin et al., 2013).
During a trip to Mars, there is a good chance for at least one solar flare to occur which
could drastically increase astronauts’ exposure to 5 Sv if it happened in a phase of
insufficient shielding such as an extravehicular activity (Thirsk et al., 2009). Early
warning systems for SPEs are necessary to prevent such exposures.
In low Earth orbit at an altitude of 350 - 420 km, the International Space Station (ISS) is
still partly protected by the Earth’s magnetosphere. The Van Allen radiation belts
surround the Earth as tori with the thickest region at the equator plane. In these belts,
particles from GCR and SPEs are trapped by the Earth’s magnetic field. In the inner
radiation belt at an altitude 2,000 - 10,000 km from Earth’s surface, protons and
electrons predominate which are formed by ionization of air components by cosmic
radiation. In the outer radiation belt, 14,000 - 46,000 km from Earth’s surface, ionized
particles from the Earth’s atmosphere and the solar wind are trapped.
On the ISS, an astronaut will receive a dose equivalent of about 0.3 Sv per year,
compared to a person on Earth receiving an average dose of less than 0.005 Sv per
year (Townsend and Fry, 2002).
Energy deposition is a measure for the qualitative differences of space radiation
components. Energy deposition in matter by ionizing radiation 2 of different qualities is
1
The equivalent dose is defined as the product of absorbed dose and the radiation quality factor
Q. The biological effects of ionizing radiation are influenced amongst others by the absorbed
dose, the dose rate and the quality of the radiation. For radiological protection purposes, the
organ or tissue weighting factors are also taken into consideration.
2
Ionizing radiation is defined as when the particles (including charged electrons or protons and
uncharged photons or neutrons) can produce ionization in a medium or can initiate nuclear or
elementary-particle transformations that then result in ionization or the production of radiation
excitation.
3
Introduction
described by the linear energy transfer (LET). The LET is the linear density of energy
loss by transfer from the ionizing particles to the irradiated matter and can be described
as energy loss per unit distance, dE/dx (keV/µm). LET depends on the nature of the
radiation as well as on the material traversed. Charged particles lose energy as they
traverse matter, and as they approach the end of their range, there is an enhanced
energy loss rate called Bragg peak, where the maximum LET occurs. For many
biological endpoints, the relative biological effectiveness (RBE)
3
peaks at an LET of
about 100 - 200 keV/µm and decreases sharply at very high LET (Cucinotta and
Durante, 2006).
Shielding is necessary to protect humans on space explorations. Thick shielding is
effective in absorbing protons of SPEs and can reduce the dose the astronauts are
exposed to. It is much more difficult to shield GCR because of its high energy, strong
penetrating ability and probability in inducing secondary radiation and increasing the
absorbed dose. The absorbed dose or cancer induction rates resulting from annual
GCR exposure is higher behind up to of 30 g/cm2 of aluminum shielding (Wilson et al.,
1995) or 5 g/cm2 of polyethylene compared to unshielded conditions (Wilson et al.,
1999). Present shielding approaches cannot sufficiently reduce the detrimental
exposure to space radiation firstly because of high launch costs for thick shielding, and
secondly because of the production of even more harmful secondary radiation during
traversal of the shielding.
Furthermore, large uncertainties exist in the projection of health risks of space radiation,
especially for energetic heavy ions with very high biological effectiveness (George et al.,
2003; Hall et al., 2006). In recent years, worldwide efforts are focusing on
understanding of the detrimental effects of space relevant radiation on cellular, tissue
and whole body level.
3
The RBE is defined as the ratio of the doses required by two different radiation qualities to
cause the same level of effect and depends on dose, dose rate, fractionation, radiation quality,
the irradiated tissue and the biological endpoint under consideration. The degree of biological
effectiveness of different radiation types is mainly influenced by the way of energy transfer to
the tissue (different LETs) (Barendsen 1994; Nikjoo et al. 1999).
4
Introduction
1.2
Effects of ionizing radiation on humans
Depending on dose and dose rate, the whole body radiation exposure during space
missions can result in acute, chronic or late effects.
High radiation doses and dose rates might be reached during SPE. The acute exposure
to high doses can induce early health effects such as nausea, vomiting, coma or may
be lethal depending on the dose, which will degrade crew survival and performance and
thus can severely interfere with mission success.
Low dose rate but long-term radiation exposure to total radiation doses of 2-4 Sv/year
which exceeds the permissible occupational dose would result in the chronic radiation
syndrome (Reeves and Ainsworth, 1995). This syndrome may include sleep and/or
appetite disturbances, generalized weakness and easy fatigability, headaches, bone
pain and hot flashes, which is not negligible for human health and successful missions
(Hellweg and Baumstark-Khan, 2007).
After astronauts return to Earth, an increased lifetime risk for late effects such as
cataracts and cancer persists from exposure to GCR and SPE. Quantitative estimates
of cancer risk from exposure to ionizing radiation are available from the studies of
cancer incidence in the atomic bomb survivors from Nagasaki and Hiroshima in Japan.
Within these studies, an increase in the risks of breast cancer in women, and of
leukemia, non-melanoma skin cancer, and lung cancer in both genders was found
(Land et al., 1994; Little, 2009; Little and Charles, 1997; Schneider and Walsh, 2008).
Some epidemiological studies with atomic bomb survivors also have shown that
exposure to moderate to high doses of ionizing radiation increases the risk of cancer in
most organs: breast, thyroid, esophagus, colon, bladder, ovary and lung (Bogart et al.,
2005; Laird, 1987; Preston et al., 2012; Shay et al., 2011).
Cancer radiotherapy relies on killing cancer cells by the physical energy transfer of
ionizing radiation. When given at high doses, it can slow or stop tumor growth. Because
of their exceptional properties, exhibiting a strong increase in dose at the end of the
particle range called Bragg peak (Figure 1-2) when travelling through matter, charged
particles are applied as therapeutic agents against cancer. Due to the larger mass
5
Introduction
comparing to protons or even helium ions, heavy ions offer an improved dose
conformation with better sparing of normal tissue structures close to the target. This
advantage is lost for very heavy ions (above oxygen) because the RBE is already very
high in the entrance region and does not increase much in the Bragg peak. Accelerated
particles applied for cancer therapy such as protons and carbon ions can concentrate
the effect of radiation on the tumor being treated, while at the same time the effect on
the surrounding healthy tissue is minimized (Trikalinos et al., 2009).
As for radiotherapy with photons, a risk for secondary cancer exists also after proton
and carbon ion therapy. A final assessment of this risk is not yet possible (Shioyama et
al., 2003).
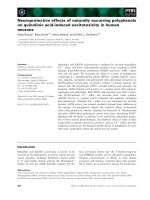
Figure 1-2
Depth distribution of radiation dose in water
Depth dose distribution with Bragg peak for carbon ions (270 MeV/n) and protons (148 MeV/n) in
comparison to photons (Fokas et al., 2009).
6
Introduction
The risk for space radiation induced tumorigenesis is believed to be very high because
of the high biological effectiveness of HZE particles. For both astronauts traveling in
space and radiotherapy patients, understanding of the tissue reactions and cellular
stress responses to heavy ion exposure will be necessary for an accurate assessment
of cancer risk and may provide targets for prevention.
1.3
Effects of ionizing radiation on cells
The biological effects of ionizing radiation on human beings are a consequence of
physical and chemical reactions initiated by energy deposition in cells and tissues. DNA
is a critical cellular target of ionizing radiation. The immediate response to DNA
damages induced by ionizing radiation is the stimulation of the repair machinery and
activation of cell cycle 4 checkpoints, followed by down-stream cellular responses such
as apoptosis and other forms of cell death, differentiation or senescence.
Agents designed to protect irradiated cells from dysfunction of cellular differentiation
and cell-cell communication, or those that can reverse the irradiated phenotype could
provide a mean of impeding its downstream carcinogenic potential (Park et al., 2003).
More basic studies on tissue, cellular and molecular level using ground based facilities
are necessary to identify targets for such agents.
1.3.1 Radiation induces DNA damage
Charged particles, γ- and X-rays penetrating tissue or cells initiate ionization of water
and biomolecules along the movement track and induce DNA damage (Figure 1-3).
These damages include a variety of structural lesions in DNA: oxidative base damage,
single-strand breaks (SSB) and double-strand breaks (DSB) (Lau, 2005) as well as local
multiple damages sites through direct and indirect interactions (Eccles et al., 2010;
Hada and Georgakilas, 2008). The complexity of radiation induced DNA damages
depends on the radiation quality described by the LET. Substantial evidence indicates
4
The cell cycle also called cell-division cycle is a series events taking place in a cell leading to
its division and duplication. It consists of distinct phases, interphase and mitosis. The interphase
is composed of G1 (cells are active and growing), S (cells are actively replicating DNA) and G2
phase (during this phase, cells are actively preparing for mitosis).
7
Introduction
that high LET radiation induces a greater number of DNA damages and more complex
clustered DNA lesions than low LET photons (Figure 1-4) (Bishay et al., 2001; Fournier
et al., 2012; Gaziev, 1999). Those high-LET induced damages are thought to be much
more difficult for cells to repair accurately (Fakir et al., 2006; Kozubek and Krasavin,
1984).
Figure 1-3
Comparison of particle tracks in human cells and nuclear emulsions
Immunostaining of γ-H2AX in human fibroblasts visualizing the cellular response to DNA double
strand breaks after cells were exposed to sparsely ionizing radiation (γ-rays) (A) or to heavy
charged particles such as silicon (B) and iron (C) ions. Tracks of different ions in nuclear
emulsions show increasing ionization density as the ion’s charge, Z, increases (D). Figures from:
(Cucinotta and Durante, 2006)
8
Introduction
Figure 1-4 Radiation tracks produced by an X-ray photon and by a heavy
charged particle in the DNA double helix
In this example, the heavy charged particle produces a highly complex DNA strand break, while
the photon induces base damage. (Image credit by National Aeronautics and Space
Administration (NASA))
Differences in damage-response pathways induced by low and high-LET radiation result
in distinct gene expression and mutation profiles (Liu et al., 2013). They might be
associated with cancer initiation or progression including genomic instability
(Baverstock, 2000; Eidemuller et al., 2011; Eidemuller et al., 2012), extra-cellular matrix
remodeling, persistent inflammation (Multhoff and Radons, 2012), or with cataract
formation (Muranov et al., 2010), and damages to the central nervous system (Coderre
et al., 2006) and oxidative damage (Kvam and Tyrrell, 1997; Mishra, 2004).
1.3.2 Repair of DNA damage
Genotoxic stresses result in activation of a complex network of DNA damage
checkpoints and repair pathways. To maintain integrity of DNA molecule after ionizing
radiation induced DNA damage, three enzymes from the phosphatidylinositol-3-kinaserelated (PIKK) family are activated by phosphorylation: ATM (ataxia telangiectasia
9
Introduction
mutant), ATR (ataxia telangiectasia and Rad3-related protein) and DNA-PK (DNAdependent protein kinase) (Cimprich and Cortez, 2008; Lovejoy and Cortez, 2009;
Shrivastav et al., 2008; Tichy et al., 2010).
ATM is a serine/threonine protein kinase recruited and activated by DNA DSB. After its
activation, it phosphorylates several key proteins including p53 and Chk2 which will
initiate activation of the DNA damage checkpoint, leading to cell cycle arrest, DNA
repair or apoptosis (Warmerdam and Kanaar, 2010). ATM is involved in the nonhomologous end joining (NHEJ) repair pathway and is also crucial for homologous
recombination (HR).
NHEJ is the only DSB repair process in mammalian cells in G1- and early S-phase.
DSB repair in late S- to G2-phase can be performed by HR. HR uses the homologue
DNA sequence of the sister chromatid as an undamaged matrix and enables correct
repair of DNA DSBs. In comparison to HR, NHEJ process is more error-prone but a fast
and easy way to seal a two-ended break arising from the damages after treatment with
ionizing radiation.
ATR, also known as FRAP-related protein 1 (FRP1), is a serine/threonine-specific
protein kinase and is involved in sensing DNA damage (single-stranded DNA and
stalled replication forks) and activating the DNA damage checkpoint, whereas ATM
responds mainly to DNA double strand breaks. ATR and ATM respond to distinct stimuli
and therefore have non-redundant functions. Thus, combined and complementary
actions of ATM and ATR ensure the sensing of DNA damage and cell cycle checkpoint
activation in response to damaging agents or stimuli.
DNA-PK is another protein kinase that is specifically required for NHEJ. During NHEJ,
DNA-PK initially recognizes and binds to the damaged DNA and then targets the other
repair activities to the site of DNA damage.
1.3.3 Radiation induces cell cycle arrest
After the initial sensing of DNA damage, the subsequent transmission is through
ATM/ATR associated with activation of p53-dependent and -independent pathways to
the cell-cycle machinery check-points.
10
Introduction
Cyclin-dependent kinases (CDKs) are a family of protein kinases known as key
regulators of cell cycle progression. Binding of cyclins to CDKs is required for cell cycle
transition, and repression of the cyclin gene also contributes to blocking the entry into
the next cycle phase (Wilson, 2004).
The activation of cell cycle checkpoints provides for cells a controlled temporary arrest
in G1, S or G2/M phase (Figure 1-5). This allows cells to repair the ionizing radiation
induced DNA damage resulting from e.g. radiotherapy or space flight and mediate cell
fate, in order to survive and maintain the genomic integrity and stability. After radiation
exposure, cells transiently accumulate in G1, S or G2 in dose- and radiation qualitydependent manner (Fernet et al., 2010). Since many tumor cells are deficient in the
G1/S checkpoint due to a non-functional p53 pathway, they lack effective G1 or S phase
arrest induction. When cells are exposed to ionizing radiation in G2/M phase, two
distinct checkpoints are activated: the early G2 checkpoint and the G2/M accumulation
(Cucinotta et al., 2001; Gogineni et al., 2011; Metting and Little, 1995; Xu and Kastan,
2004; Xu et al., 2002).
Figure 1-5 Molecular organization of cell cycle checkpoints that might result in
cell cycle arrest in response to DNA DSBs
Multiple pathways lead to G1, S, G2/M arrest through p53/p21 dependent or independent pathways
(Iliakis et al., 2003; Pawlik and Keyomarsi, 2004).
11
Introduction
1.3.4 p21 in cell cycle regulation
The tumor suppressor p53 is capable to induce cell cycle arrest and cell death in
response to stress (Vousden, 2000). Many of its target genes, Cyclin-dependent kinase
inhibitor 1 (CDKN1A) for example, are modulated to control the biological outcomes: cell
cycle arrest, DNA repair, and reorganization of actin cytoskeleton and cell death (Avkin
et al., 2006; Li et al., 1994; Quaas et al., 2012; Suzuki et al., 2012; Wani et al., 2002;
Yadav et al., 2012; Yi et al., 2012). The protein product of CDKN1A, p21, was originally
identified as an inhibitor of CDKs. p21CDKN1A is also considered as a positive regulator of
the cell cycle. A certain level of p21 expression is required for normal cell cycle
progression, as p21 stabilizes and promotes active cyclin-CDKs complex formation
(Pan et al., 2002). Under non-stressed conditions, p21 is expressed at low levels and
promotes cell cycle progression; when cells are under various outer or/and inner
stresses, p21CDKN1A expression is increased through p53-dependent and independent
pathways. p21CDKN1A implicates in cell cycle checkpoints in G1 and S phases by
inhibiting activities of cyclin E-CDK2 complex (Harper et al., 1993) and in the G2 and M
phases by inhibiting cyclin B/A-CDK1 or CDK2 activities (Bates et al., 1998; Niculescu,
III et al., 1998) (Figure 1-6).
Studies show that depletion of p21 expression by anti-sense RNA promotes cell cycle
re-entry and DNA synthesis. The phosphorylation of retinoblastoma protein (pRb) is
found to be essential for G1/S transition, and at the same time, p21 can inhibit pRb
phosphorylation and induce cell cycle arrest in G1, or inactivate E2F1 which leads to
cell cycle arrest and cellular senescence. Furthermore, p21 induced G2 arrest appears
to be more prominent in pRb-null cells (Niculescu, III et al. 1998).
12
Introduction
Figure 1-6
Negative regulation of G1, S and G2 transition by p21
Black squares indicate phosphorylation sites on tyrosine (Tyr) or threonine (Thr) residues of
cyclin-dependent kinase 2 (CDK2). Graph created by (Romanov et al., 2012)
1.3.5 p53 and Mdm2 regulation
Tumor suppressor proteins like p53 are present at a low concentration in normal cells.
Mdm2 (Mouse double minute 2 homolog) is one of the p53 target genes and encodes
an E3 ubiquitin ligase which negatively controls p53 and its downstream signaling
pathways (Fry et al., 2005; Fu et al., 2009; Itahana et al., 2007). Both p53 and Mdm2
have a short half-life and their nuclear concentrations are kept at very low levels as a
result of proper functioning of the regulatory circuit described below (Deb, 2002;
Freedman and Levine, 1999; Freedman et al., 1999).
Under stress conditions such as hypoxia or DNA damage, p53 accumulates in the
nucleus where it is activated and causes cell cycle arrest or apoptosis. Once the nuclear
p53 levels increase, the transcription of the Mdm2 gene is activated, raising the level of
13
Introduction
Mdm2 protein. In turn, Mdm2 binds to p53, which blocks its N-terminal transactivation
domain and targets p53 for degradation via the ubiquitin-proteasome system following
ubiquitinylation through its E3 ligase activity. Thereafter, the ability of Mdm2 to bind to
p53 is blocked or altered in a fashion that prevents Mdm2-mediated degradation
because of overexpression of Mdm2. Then p53 levels can rise again and increase
Mdm2 protein expression. Oscillatory dynamics of p53 levels in the cell nucleus with
one or more p53 peaks result from the p53-Mdm2 negative feedback loop (Manfredi,
2010; Marine and Lozano, 2010; Yu et al., 2000).
1.3.6 Radiation induces cellular senescence
Senescence is a permanent cell cycle arrest controlled by two major pathways, the p16pRb pathway and p53-p21 pathway. Cellular senescence can be induced by telomere
dysfunction, DNA damage, and chromatin instability and oncogene activation. The
stress induced proliferation suppression is tightly associated with cell cycle arrest.
The cell cycle arrest in G1 phase is commonly following ATM and p53 dependent
temporary transcriptional activation of the CDKN1A gene encoding p21. Additionally, in
a p53 independent manner, p21 has been recognized as an over-expressed marker in
senescent cells and later found to be capable of inducing premature senescence in both
normal and tumor cells (Noda et al., 1994).
The other signaling pathway through the tumor suppressor protein p16 could also be
activated through the p38 mitogen-activated protein kinase (MAPK) mediated p16
expression when p53 is inactivated. It maintains cells in senescent state due to radiation
induced DNA damage.
14
Introduction
1.4
Radiation effects on osteoblast differentiation
Bone loss is one of the serious obstacles for long-term manned space missions.
Previous studies have demonstrated that astronauts on 4-6 months missions aboard the
ISS experience femoral and vertebral bone loss of about 0.9-1.6% per month (Lang et
al., 2004). Bone loss and the corresponding loss of strength could increase the risk of
fractures and pose a risk to mission safety. Exposure to GCR and solar particles
presents a significant but poorly understood risk for carcinogenesis and degenerative
diseases (Durante and Cucinotta, 2008). Together with microgravity, radiation might
have a synergistic effect on bone cells resulting in dysfunction.
1.4.1 Bone remodeling
Bone is a dynamic tissue that constantly undergoes modeling and remodeling
throughout lifespan. These modeling and remodeling processes are mainly executed by
osteoclastic bone resorption followed by osteoblastic bone formation to maintain and
renew its mineralized matrix (Figure 1-7).
Figure 1-7
Bone remodeling cycle
Downloaded from 2010.
15
Introduction
The remodeling process is regulated by systemic hormones including parathyroid
hormone, calcitriol, growth hormone and some other hormones and factors; and by local
factors such as growth factors, cytokines, and prostaglandins, which have been
identified and are synthesized by osteoblasts (Hadjidakis and Androulakis, 2006).
These hormones and factors affect both osteoblasts and osteoclasts in their replication,
differentiation and activity.
Osteoblasts produce TGF-β (transforming growth factor beta) and deposit a latent form
of TGF-β in bone tissue. The TGF-β superfamily comprises over forty members, such
as TGF-βs, Nodal, Activin, and bone morphogenetic proteins (BMPs) (Guo and Wang,
2009). TGF-βs and BMPs have widely recognized roles in bone formation during
mammalian development (Katagiri and Takahashi, 2002). Disruptions of TGF-β/BMP
signaling implicate bone diseases including tumor metastasis and osteoarthritis (Siegel
and Massague, 2003). TGF-β signaling promotes osteoprogenitor proliferation,
commitment to the osteoblastic lineage and early differentiation (Chen et al., 2012a). It
has been recognized that TGF-β is involved in the pathogenesis of late radiation
damage in the non-tumor bearing tissues of previously irradiated patients and thus its
activity may modulate late post-radiation changes (Canney and Dean, 1990).
TGF-β1 is one of the isoforms of the TGF-β superfamily. It plays an important role in
endochondral and intramembranous ossification. TGF-β1 deficient mice display reduced
bone growth and mineralization (Janssens et al., 2005). Ionizing radiation specifically
induces the expression of TGF-β1, which is required for DNA repair, progression
through cell cycle (Figure 1-6) (Mukherjee et al., 2010), inflammation in early stage, and
later development of radiation damage such as fibrosis (Martin et al. 1997; O'Malley et
al. 1999).
BMPs are multifunctional growth factors and play an important role in bone formation
(Wan and Cao, 2005; Weston et al., 2000). BMPs activate Smad proteins and those
Smads are phosphorylated and translocate into the nucleus where they regulate their
target genes such as Runx2 (Runt-related transcription factor 2) to control
mesenchymal precursor cell differentiation.
16
Introduction
Runx2 is an important transcription factor that regulates osteoblast and chondrocyte
differentiation and can be viewed as a marker gene for the BMP signaling pathway.
Differentiation along the osteoblast lineage has been shown to depend on Runx2 and
Osterix (Osx) regulation (Figure 1-8) (Nakashima et al., 2002). Runx2 or Osx knockout
mice show no bone formation (Nakashima et al., 2002; Tsuji et al., 2004), while Runx2
is a master regulator that acts upstream of Osterix (Nakashima et al. 2002). Osterix is
expressed as early as mesenchymal cells are committed to enter the osteoblast
lineage, and expression of Osterix becomes stronger as osteoblast differentiation
occurs.
1.4.2 Radiation induces bone loss
In in vivo studies with a mouse model, prolonged and profound loss of trabecular or/and
cortical bone has been found after acute radiation exposure to a dose of 2 Gy, which
represents both a typical dose fraction in cancer radiotherapy and the cumulated space
radiation exposure for an exploratory mission (Hamilton et al., 2006; Lloyd et al., 2008).
Studies also show that significant differences in the induction of bone loss in an animal
model were observed between radiation qualities of therapeutic and space-relevant
sources (Hamilton et al. 2006). There is evidence showing that therapeutic irradiation
can cause bone damage in cancer patients, which results in increased bone resorption
and decreased bone mineral density, and this damage has a good chance in increasing
the risk of bone fracture (Edwards et al., 2011; Guise, 2006).
1.4.3 Osteoblasts and bone formation
Osteoblasts are specialized cells of mesenchymal origin, responsible for bone formation
and support of osteoclast differentiation. Bone formation includes a complex process
that contains the proliferation of primitive mesenchymal cells, differentiation into
osteoblast precursor cells, maturation of osteoblasts, formation and mineralization of
extracellular matrix, and finally some cells gradually flatten and become quiescent lining
cells (Figure 1-8).
17