Pulsar searching and timing with the parkes telescope
Bạn đang xem bản rút gọn của tài liệu. Xem và tải ngay bản đầy đủ của tài liệu tại đây (20.64 MB, 171 trang )
Pulsar searching and timing with
the Parkes telescope
Dissertation
zur
Erlangung des Doktorgrades (Dr. rer. nat.)
der
Rheinischen Friedrich–Wilhelms–Universität, Bonn
vorgelegt von
Cherry Wing Yan Ng
aus
Hong Kong, China
Bonn 2014
Angefertigt mit Genehmigung der Mathematisch-Naturwissenschaftlichen Fakultät
der Rheinischen Friedrich–Wilhelms–Universität Bonn
1. Referent: Prof. Dr. Michael Kramer [Supervisor]
2. Referent: Prof. Dr. Norbert Langer [2nd referee]
Tag der Promotion: 19 - 11 - 2014
Erscheinungsjahr: 2014
Diese Dissertation ist auf dem Hochschulschriftenserver der ULB Bonn unter
elektronisch publiziert
RHEINISCHEN FRIEDRICH–WILHELMS–UNIVERSITÄT BONN
Abstract
by Cherry Wing Yan Ng
for the degree of
Doctor rerum naturalium
Pulsars are highly magnetised, rapidly rotating neutron stars that radiate a
beam of coherent radio emission from their magnetic poles. An introduction to
the pulsar phenomenology is presented in Chapter 1 of this thesis. The extreme
conditions found in and around such compact objects make pulsars fantastic
natural laboratories, as their strong gravitational fields provide exclusive insights
to a rich variety of fundamental physics and astronomy.
The discovery of pulsars is therefore a gateway to new science. An overview
of the standard pulsar searching technique is described in Chapter 2, as well as
a discussion on notable pulsar searching efforts undertaken thus far with various telescopes. The High Time Resolution Universe (HTRU) Pulsar Survey
conducted with the 64-m Parkes radio telescope in Australia forms the bulk of
this PhD. In particular, the author has led the search effort of the HTRU lowlatitude Galactic plane project part which is introduced in Chapter 3. We discuss
the computational challenges arising from the processing of the petabyte-sized
survey data. Two new radio interference mitigation techniques are introduced,
as well as a partially-coherent segmented acceleration search algorithm which
aims to increase our chances of discovering highly-relativistic short-orbit binary
systems, covering a parameter space including the potential pulsar-black hole
binaries. We show that under a linear acceleration approximation, a ratio of ≈
0.1 of data length over orbital period results in the highest effectiveness for this
search algorithm.
Chapter 4 presents the initial results from the HTRU low-latitude Galactic
plane survey. From the 37 per cent of data processed thus far, we have re-detected
348 previously known pulsars and discovered a further 47 pulsars. Two of which
are fast-spinning pulsars with periods less than 30 ms. PSR J1101−6424 is a
millisecond pulsar (MSP) with a heavy white dwarf companion while its short
spin period of 5 ms indicates contradictory full-recycling. PSR J1757−27 is likely
to be an isolated pulsar with an unexpectedly long spin period of 17 ms. In
addition, PSR J1847−0427 is likely to be an aligned rotator, and PSR J1759−24
exhibits transient emission property. We compare this newly-discovered pulsar
population to that previously known, and we suggest that our current pulsar
detection yield is as expected from population synthesis.
The discovery of pulsars is just a first step and, in fact, the most interesting
science can usually only be revealed when a follow-up timing campaign is carried
out. Chapter 5 focuses on the timing of 16 MSPs discovered by the HTRU. We
reveal new observational parameters such as five proper motion measurements
and significant temporal dispersion measure variations in PSR J1017−7156. We
discuss the case of PSR J1801−3210, which shows no significant period derivative (P˙ ) after four years of timing data. Our best-fit solution shows a P˙ of the
order of 10−23 , an extremely small number compared to that of a typical MSP.
However, it is likely that the pulsar lies beyond the Galactic Centre, and an
unremarkable intrinsic P˙ is reduced to close to zero by the Galactic potential acceleration. Furthermore, we highlight the potential to employ PSR J1801−3210
in the strong equivalence principle test due to its wide and circular orbit. In a
broader comparison with the known MSP population, we suggest a correlation
between higher mass functions and the presence of eclipses in ‘very low-mass
binary pulsars’, implying that eclipses are observed in systems with high orbital
inclinations. We also suggest that the distribution of the total mass of binary
systems is inversely-related to the Galactic height distribution. We report on the
first detection of PSRs J1543−5149 and J1811−2404 as gamma-ray pulsars.
Further discussion and conclusions arise from the pulsar searching and timing
efforts conducted with the HTRU survey can be found in Chapter 6. Finally, this
thesis is closed with a consideration of future work. We examine the prospects of
continuing data processing and follow-up timing of discoveries from the HTRU
Galactic plane survey. We also suggest potential improvements in the search
algorithms aiming at increasing pulsar detectability.
Contents
.
.
.
.
.
.
.
.
.
.
.
.
.
.
.
.
.
.
.
.
.
.
.
.
.
.
.
.
.
.
.
.
.
.
.
.
.
.
.
.
.
.
.
.
.
.
.
.
.
.
.
.
.
.
.
.
.
.
.
.
.
.
.
.
.
.
.
.
.
.
.
.
.
.
.
.
.
.
.
.
.
.
.
.
.
.
.
.
.
.
.
.
.
.
.
.
.
.
.
.
.
.
.
.
.
.
.
.
.
.
.
.
.
.
.
.
.
.
.
.
.
.
.
.
.
.
.
.
.
.
.
.
.
.
.
.
.
.
.
.
.
.
.
.
.
.
.
.
.
.
.
.
.
.
.
.
.
.
.
.
.
.
.
.
.
5
5
7
9
9
11
11
13
15
16
19
22
2 Pulsar Searching
2.1 Instrumentation and algorithms . . . . . . . . .
2.1.1 Data acquisition . . . . . . . . . . . . .
2.1.2 The standard periodicity search . . . . .
2.1.2.1 RFI removal . . . . . . . . . .
2.1.2.2 De-dispersion . . . . . . . . . .
2.1.2.3 The discrete Fourier transform
2.1.2.4 Spectral whitening . . . . . . .
2.1.2.5 Harmonic summing . . . . . .
2.1.2.6 False-alarm probability . . . .
2.1.3 Binary pulsar searches . . . . . . . . . .
2.1.3.1 Time domain resampling . . .
2.1.3.2 Other techniques . . . . . . . .
2.1.4 Candidate selection and optimisation . .
2.2 An overview of pulsar surveys . . . . . . . . . .
2.2.1 Previous generations . . . . . . . . . . .
2.2.2 Contemporary pulsar surveys . . . . . .
2.2.3 Next generations of pulsar surveys . . .
.
.
.
.
.
.
.
.
.
.
.
.
.
.
.
.
.
.
.
.
.
.
.
.
.
.
.
.
.
.
.
.
.
.
.
.
.
.
.
.
.
.
.
.
.
.
.
.
.
.
.
.
.
.
.
.
.
.
.
.
.
.
.
.
.
.
.
.
.
.
.
.
.
.
.
.
.
.
.
.
.
.
.
.
.
.
.
.
.
.
.
.
.
.
.
.
.
.
.
.
.
.
.
.
.
.
.
.
.
.
.
.
.
.
.
.
.
.
.
.
.
.
.
.
.
.
.
.
.
.
.
.
.
.
.
.
.
.
.
.
.
.
.
.
.
.
.
.
.
.
.
.
.
.
.
.
.
.
.
.
.
.
.
.
.
.
.
.
.
.
.
.
.
.
.
.
.
.
.
.
.
.
.
.
.
.
.
.
.
.
.
.
.
.
.
.
.
.
.
.
.
.
.
.
.
.
.
.
.
.
.
.
.
.
.
.
.
.
.
.
.
.
.
.
.
.
.
.
.
.
.
.
.
.
.
.
.
.
23
23
23
25
25
26
28
29
30
31
32
32
34
36
37
37
39
42
.
.
.
.
.
.
.
45
45
48
50
53
53
54
55
1 Pulsar Phenomenology
1.1 Neutron stars . . . . . . . . .
1.2 The lighthouse model . . . . .
1.3 Propagation effects . . . . . .
1.3.1 Pulse dispersion . . .
1.3.2 Interstellar scattering
1.4 Pulsar diversity . . . . . . . .
1.4.1 Binary systems . . . .
1.4.2 Magnetars . . . . . . .
1.5 Pulsar timing . . . . . . . . .
1.6 Pulsars as physical tools . . .
1.7 Thesis outline . . . . . . . . .
.
.
.
.
.
.
.
.
.
.
.
.
.
.
.
.
.
.
.
.
.
.
.
.
.
.
.
.
.
.
.
.
.
.
.
.
.
.
.
.
.
.
.
.
.
.
.
.
.
.
.
.
.
.
.
.
.
.
.
.
.
.
.
.
.
.
.
.
.
.
.
.
.
.
.
.
.
3 The HTRU Pulsar Survey
3.1 Introduction to the HTRU Pulsar Survey
3.1.1 Observing system . . . . . . . . . .
3.1.2 Survey sensitivity . . . . . . . . . .
3.2 Discovery highlights . . . . . . . . . . . .
3.2.1 ‘Planet-pulsar’ binaries . . . . . . .
3.2.2 Magnetar PSR J1622−4950 . . . .
3.2.3 Fast Radio Bursts . . . . . . . . .
.
.
.
.
.
.
.
.
.
.
.
.
.
.
.
.
.
.
.
.
.
.
.
.
.
.
.
.
.
.
.
.
.
.
.
.
.
.
.
.
.
.
.
.
.
.
.
.
.
.
.
.
.
.
.
.
.
.
.
.
.
.
.
.
.
.
.
.
.
.
.
.
.
.
.
.
.
.
.
.
.
.
.
.
.
.
.
.
.
.
.
.
.
.
.
.
.
.
.
.
.
.
.
.
.
.
.
.
.
.
.
.
.
.
.
.
.
.
.
.
.
.
.
.
.
.
.
.
.
.
.
.
.
.
ii
Contents
3.3
4 The
4.1
4.2
4.3
4.4
4.5
The low-latitude Galactic plane survey . . . . . . . . . . . . . . .
3.3.1 RFI mitigation . . . . . . . . . . . . . . . . . . . . . . . .
3.3.1.1 Time domain . . . . . . . . . . . . . . . . . . . .
3.3.1.2 Fourier domain . . . . . . . . . . . . . . . . . . .
3.3.2 Acceleration search . . . . . . . . . . . . . . . . . . . . . .
3.3.2.1 The ratio of data length over orbital period, rorb
3.3.2.2 Acceleration ranges . . . . . . . . . . . . . . . .
3.3.2.3 Partially-coherent segmentation . . . . . . . . .
3.3.3 Candidate confirmation and gridding strategy . . . . . . .
.
.
.
.
.
.
.
.
.
.
.
.
.
.
.
.
.
.
.
.
.
.
.
.
.
.
.
low-latitude Galactic plane survey discoveries
Re-detections of known pulsars . . . . . . . . . . . . . . . . . . . . . .
New pulsars . . . . . . . . . . . . . . . . . . . . . . . . . . . . . . . . .
Individual pulsars of interest . . . . . . . . . . . . . . . . . . . . . . . .
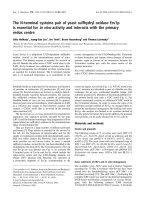
4.3.1 PSR J1101−6424, a Case A Roche lobe overflow cousin of
PSR J1614−2230 . . . . . . . . . . . . . . . . . . . . . . . . . .
4.3.2 PSR J1759−24, an intermittent pulsar? . . . . . . . . . . . . .
4.3.3 PSR J1757−27, likely to be a fast-spinning isolated pulsar? . .
4.3.4 PSR J1847−0427, a pulsar with an extremely wide pulse . . . .
Comparing with known pulsar population . . . . . . . . . . . . . . . .
4.4.1 Luminosity . . . . . . . . . . . . . . . . . . . . . . . . . . . . .
4.4.2 Characteristic ages . . . . . . . . . . . . . . . . . . . . . . . . .
4.4.3 Spin-down power and Fermi association . . . . . . . . . . . . .
A comparison with the estimated survey yield . . . . . . . . . . . . . .
.
.
.
.
.
.
.
.
.
57
60
60
61
63
63
66
68
71
73
. 73
. 78
. 84
.
.
.
.
.
.
.
.
.
84
85
87
87
88
88
89
94
94
5 Discovery of four millisecond pulsars and updated timing solutions of
a further 12
97
5.1 Observations and analysis . . . . . . . . . . . . . . . . . . . . . . . . . . 98
5.2 Discovery of four millisecond pulsars . . . . . . . . . . . . . . . . . . . . 100
5.2.1 On the nature of the binary companions . . . . . . . . . . . . . . 100
5.2.2 Polarisation Profiles . . . . . . . . . . . . . . . . . . . . . . . . . 101
5.3 Updated timing of 12 HTRU millisecond pulsars . . . . . . . . . . . . . 107
5.3.1 Dispersion measure variations . . . . . . . . . . . . . . . . . . . . 107
5.3.2 Proper motion and transverse velocities . . . . . . . . . . . . . . 108
5.3.3 Observed and inferred intrinsic period derivatives . . . . . . . . . 109
5.3.3.1 PSR J1017−7156 . . . . . . . . . . . . . . . . . . . . . . 110
5.3.3.2 PSR J1801−3210 . . . . . . . . . . . . . . . . . . . . . . 112
5.3.4 Binary companions and mass functions . . . . . . . . . . . . . . 116
5.3.5 Galactic height distribution . . . . . . . . . . . . . . . . . . . . . 118
5.3.6 Orbital eccentricity . . . . . . . . . . . . . . . . . . . . . . . . . . 121
5.3.7 Change in projected semi-major axis, x˙ . . . . . . . . . . . . . . 123
5.3.8 Orbital period variation, P˙orb . . . . . . . . . . . . . . . . . . . . 124
5.3.9 Variation in the longitude of periastron, ω˙ . . . . . . . . . . . . . 125
5.3.10 Gamma-ray pulsation searches . . . . . . . . . . . . . . . . . . . 125
Contents
6 Conclusion and future work
6.1 Conclusion . . . . . . . . . . . . . . . . . . . . . . . . . . . . . .
6.1.1 The HTRU Galactic plane survey . . . . . . . . . . . . .
6.1.2 Timing 16 MSPs from the medium latitude survey . . .
6.2 Future work . . . . . . . . . . . . . . . . . . . . . . . . . . . . .
6.2.1 Continued processing . . . . . . . . . . . . . . . . . . . .
6.2.2 Follow-up on discoveries from the Galactic plane survey
6.2.3 Further improvements in the search algorithms . . . . .
6.3 Closing remarks . . . . . . . . . . . . . . . . . . . . . . . . . . .
Bibliography
iii
.
.
.
.
.
.
.
.
.
.
.
.
.
.
.
.
.
.
.
.
.
.
.
.
.
.
.
.
.
.
.
.
129
. 129
. 129
. 132
. 133
. 133
. 134
. 134
. 135
137
Appendix A HTRU Galactic plane survey known pulsar re-detections 149
List of Figures
1.1
1.2
1.3
1.4
1.5
1.6
An illustration of the pulsar lighthouse ‘toy model’. . . . . . . . . . . . .
DM of all pulsars in the direction towards the Galactic centre. . . . . . .
Period-period derivative (P − P˙ ) diagram of all published pulsars. . . .
Two different binary evolutionary tracks leading to MSP-WDs and DNSs.
Illustration of the effects of incomplete timing models. . . . . . . . . . .
Definition of the Keplerian orbital parameters for a binary pulsar. . . . .
7
10
12
14
17
18
2.1
2.2
2.3
2.4
2.5
2.6
2.7
2.8
2.9
2.10
2.11
2.12
A block diagram of a receiver system and a pulsar ‘searching backend’. .
Schematic flowchart of a standard pipeline based on a periodicity search.
The effect of dispersion smearing as seen in a frequency versus phase plot.
The degradation of S/N versus DM offset. . . . . . . . . . . . . . . . . .
The red noise component as seen in a Fourier spectrum. . . . . . . . . .
Illustration of the Fourier spectrum harmonic summing technique. . . .
PDFs of the Fourier power and amplitude spectra. . . . . . . . . . . . .
Spectral smearing caused by the uncorrected orbital acceleration. . . . .
The characteristic modulation in Fourier spectrum due to orbital motion.
Two candidate plots as generated by the search pipeline. . . . . . . . . .
Sky coverage of Parkes blind pulsar surveys conducted in the 1990’s. . .
Sky coverage of all contemporary pulsar surveys. . . . . . . . . . . . . .
24
25
27
28
29
30
32
33
35
36
38
40
3.1
3.2
3.3
3.4
3.5
3.6
3.7
3.8
3.9
3.10
3.11
3.12
3.13
3.14
3.15
The HTRU split into three regions of the sky. . . . . . . . . . . . . . . .
A schematic diagram of the Parkes telescope. . . . . . . . . . . . . . . .
Contours of constant pulse broadening time scale in ms. . . . . . . . . .
The minimum detectable flux density for the HTRU survey. . . . . . . .
All HTRU discoveries as of 15 June 2014. . . . . . . . . . . . . . . . . .
Various contributions to the observed band delay of the FRBs . . . . . .
Spatial distribution of the processed HTRU Galactic plane observations.
Histogram of the time samples removed per Galactic plane observation .
Comparison of the effectiveness in various RFI mitigation techniques. . .
Orbital acceleration and S/N of the double pulsar at various orbital phases.
Detected S/N versus rorb at selected orbital phases . . . . . . . . . . . .
Maximum orbital acceleration vs orbital period assuming circular orbits.
A schematic of the ‘partially-coherent segmented’ pipeline. . . . . . . . .
Relative processing time required for the parallel acceleration searches. .
Gridding configuration used in the HTRU Galactic plane survey. . . . .
46
48
50
51
53
56
59
61
62
64
65
67
69
70
71
4.1
4.2
4.3
4.4
The S/Ns of pulsars re-detected in the HTRU Galactic plane survey. . .
Average pulse profile of the 47 newly-discovered pulsars. . . . . . . . . .
Spin period vs minimum companion mass for all published binary pulsars.
Discovery plot of PSR J1759−24. . . . . . . . . . . . . . . . . . . . . . .
76
81
85
86
vi
List of Figures
4.5
4.6
4.7
4.8
5.1
5.2
5.3
5.4
5.5
5.6
5.7
5.8
5.9
5.10
Luminosity vs distance of the 20 newly-discovered pulsars. . . . . . . . .
Placing 16 newly-discovered pulsars on a P -P˙ diagram. . . . . . . . . . .
Characteristic age histograms for various period bins. . . . . . . . . . . .
Histograms and CDFs of characteristic ages of known and newly discovered pulsars. . . . . . . . . . . . . . . . . . . . . . . . . . . . . . . . . . .
Polarisation profiles of four newly-discovered MSPs. . . . . . . . . .
Temporal DM variations for PSR J1017−7156. . . . . . . . . . . .
Placing the 16 MSPs on a P -P˙ diagram. . . . . . . . . . . . . . . .
Different M3 and the respective orbital period and semi-major axis.
Various P˙ contributions for PSR J1801−3210. . . . . . . . . . . . .
Mass function vs orbital period for all binary pulsars. . . . . . . . .
Mass function vs absolute Galactic height from the Galactic plane.
Eccentricity vs. orbital period (Porb ). . . . . . . . . . . . . . . . . .
∆T0 as a function of time for PSR J1731−1847. . . . . . . . . . . .
Radio and gamma-ray light curves for four MSPs. . . . . . . . . . .
.
.
.
.
.
.
.
.
.
.
.
.
.
.
.
.
.
.
.
.
.
.
.
.
.
.
.
.
.
.
88
91
92
93
102
108
111
114
115
117
119
122
125
126
List of Tables
2.1
Specifications of pulsar surveys conducted with contemporary technology. 41
3.1
3.2
3.3
3.4
Specifications of the HTRU-North and HTRU-South surveys. .
Specifications of the Parkes 20-cm multibeam receiver. . . . . .
Minimum detectable flux for the HTRU Galactic plane survey.
Comparison between the two ‘Planet-pulsar’ binaries. . . . . . .
.
.
.
.
.
.
.
.
.
.
.
.
47
49
52
54
4.1
4.2
4.3
4.4
4.5
4.6
Previously-known binary pulsars re-detected thus far. . . . . . . . .
Previously known pulsars with an S/Nexp > 9 that have been missed.
The S/N, S1400 , L1400 , W50 and W10 of the 47 pulsar discoveries. . .
Parameters of 22 newly-discovered pulsars without timing solution. .
tempo2 best-fitting parameters of the 25 newly-discovered pulsars. .
Binary parameters for PSR J1101−6424. . . . . . . . . . . . . . . . .
.
.
.
.
.
.
.
.
.
.
.
.
75
77
80
82
83
84
5.1
5.2
5.3
5.4
5.5
5.6
5.7
5.8
Observing systems employed for the timing observations in Chapter 5
tempo2 best-fit parameters for the four newly-discovered MSPs. . . .
tempo2 best-fit parameters using the ELL1 timing model. . . . . . . .
tempo2 best-fit parameters using the ELL1 timing model. . . . . . . .
tempo2 best-fit parameters using the DD and BTX timing model. . .
The derived P˙shk and P˙gal for 12 MSPs. . . . . . . . . . . . . . . . . .
Statistical distribution of Galactic height for each binary pulsar group.
Gamma-Ray emission properties of four MSPs with Fermi associations.
.
.
.
.
.
.
.
.
99
103
104
105
106
109
120
127
A1
The 348 previously known pulsars re-detected. . . . . . . . . . . . . . . . 149
.
.
.
.
.
.
.
.
Nomenclature
Frequently Used Symbols
a / aorb
a˙
ap
B
Bsurf
b
c
d
E˙
e
f
fc
G
i
L
l
mc
mp
nchan
ne
nFFT
np
nsamp
P
P˙
Porb
Pthres
rorb
Smin
T0
Tasc
Trec
Tsky
Tsys
tint
tsamp
VT
W50
Orbital acceleration
First derivative of orbital acceleration (jerk)
Semi-major axis
Bandwidth
Characteristic dipole surface magnetic field strength
Galactic latitude
Speed of light
Distance
Spin-down energy
Orbital eccentricity
Mass function
Central observing frequency
Gravitational constant or antenna gain
Orbital inclination
Luminosity
Galactic longitude
Companion mass
Pulsar mass
Number of channels
Electron number density
Number of samples in FFT
Number of polarisations
Number of samples
Spin period
First derivative of spin period
Orbital period
False-alarm power threshold
Ratio of data length over orbital period
Characteristic minimum detectable flux density
Epoch of periastron
Epoch of ascending node passage
Temperature of receiver
Temperature of sky background
Temperature of observing system (Trec + Tsky )
Integration time
Time sampling rate
Transverse velocity
Pulse width at 50 per cent of the highest peak
2
Weff
Wint
x
α
β
δ
µ
ν
π
φ
Ω
ω
τc
τs /τsc
List of Tables
Effective pulse width
Intrinsic pulse width
Projected semi-major axis
Right ascension (R.A.) or the angle between the magnetic rotational axis
Digitisation degradation factor
Declination (Dec.) or pulsar duty cycle
Proper motion
Spin frequency
Parallax
Orbital phase
Longitude of ascending node
Longitude of periastron
Characteristic age
Scattering time scale
Numerical Constants
π
1 rad
e
= 3.14156
= 57.296◦
= 2.7183
Physical Constants
Speed of light
Gravitational constant
c = 2.9979 × 10⁸ m s−1
G = 6.670 × 10⁻¹¹ m3 kg−1 s−2
Astronomical Constants
Astronomical unit (1 AU)
Parsec (1 pc)
Julian light year (1 ly)
Julian year (1 yr)
Solar mass (1 M⊙ )
Earth mass
Jupiter mass (1 MJ )
T⊙
Jansky (1 Jy)
= 1.496 × 10¹¹ m
= 3.086 × 10¹⁶ m
= 9.460730472 × 10¹⁵ m
= 3.15576 × 10⁷ s
= 1.989 × 1030 kg
= 5.974 × 1024 kg
= 1.899 × 1027 kg
= 4.925490947 µs
= 10×26 W m−2 Hz−1
Frequently used acronyms
APSR
BH
BPSR
BW
The ATNF Parkes Swinburne Recorder
Black hole
The Berkeley-Parkes-Swinburne Recorder
Black widow pulsar
List of Tables
CASPSR
CO-WD
DFB
DM
DNS
EoS
FFT
FPGA
FRB
FWHM
GC
GR
GBT
He-WD
HTRU
ISM
IMXB
LAT
LMXB
MS
MSP
NS
ONeMg-WD
P.A.
PK
PMPS
PSR
PSRCAT
PTA
RFI
RLO
RM
RMS
RRAT
SEP
SKA
S/Nthres
SNR
SSB
TOA
UL binaries
VLMBP
WD
3
The CASPER Parkes Swinburne Recorder
Carbon-oxygen white dwarf
Digital Filter bank system
Dispersion measure
Double neutron star
Equation of state
The fast Fourier Transform
Field Programmable Gate Array
Fast Radio Transient Burst
Full width at half-maximum
Globular Cluster
General relativity
The 100-m Robert C. Byrd Green Bank telescope
Helium white dwarf
The High Time Resolution Universe Pulsar Survey
Interstellar medium
Intermediate mass X-ray binary pulsar
Fermi Large Area Telescope
Low mass X-ray binaries
Main sequence star
Millisecond pulsar
Neutron star
Oxygen-neon-magnesium white dwarf
Position angle
Post-Keplerian
The Parkes multibeam pulsar survey
Pulsar
The ATNF Pulsar Catalogue
Pulsar timing array
Radio frequency interference
Roche-lobe overflow
Rotation measure
Root mean square
Rotating RAdio Transients
The strong equivalence principle
The Square Kilometre Array
False-alarm signal-to-noise threshold
Supernova remnant
The Solar system’s barycentre
Time of arrival
Ultra-light binaries
Very low-mass binary pulsars
White dwarf
Chapter 1
Pulsar Phenomenology
The first pulsar discovery was made by chance in 1967, from the data charts of Anthony
Hewish and his research student Jocelyn Bell (Hewish et al., 1968). The periodic signal
was originally thought to come from a new population of pulsating radio sources hence
the portmanteau ‘pulsar’. The discoveries of the Vela (Large et al., 1968) and the Crab
pulsars (Staelin & Reifenstein, 1968), both with spin periods less than 100 ms, indicated
that these objects must be very compact compared to normal stellar objects. In fact,
only a star composed entirely of neutrons could potentially vibrate or rotate that fast.
Neutron stars had already been predicted theoretically by Baade & Zwicky (1934) more
than 30 years before these discoveries. The observed slow down in the periodicity of
the Crab pulsar (Richards & Comella, 1969) further ruled out the possibility of radial
pulsations or binary-motion induced period changes. Pre- and post-discovery work
respectively by Pacini (1967) and Gold (1968); Hewish et al. (1968) established the
identity of the sources of these pulsed emission to be rotating neutron stars. Then
it was soon recognised that pulsars, with extremely high density and gravitational
field impossible to be re-created on Earth, would become fantastic natural laboratories
providing exclusive insights to a rich variety of fundamental physics and astronomy.
Contents
1.1
Neutron stars . . . . . . . . . . . . . . . . . . . . . . . . . . . . . .
5
1.2
The lighthouse model . . . . . . . . . . . . . . . . . . . . . . . . .
7
1.3
Propagation effects . . . . . . . . . . . . . . . . . . . . . . . . . .
9
1.4
1.1
1.3.1
Pulse dispersion . . . . . . . . . . . . . . . . . . . . . . . . . . .
1.3.2
Interstellar scattering . . . . . . . . . . . . . . . . . . . . . . . .
Pulsar diversity
9
11
. . . . . . . . . . . . . . . . . . . . . . . . . . . .
11
1.4.1
Binary systems . . . . . . . . . . . . . . . . . . . . . . . . . . . .
13
1.4.2
Magnetars . . . . . . . . . . . . . . . . . . . . . . . . . . . . . . .
15
1.5
Pulsar timing . . . . . . . . . . . . . . . . . . . . . . . . . . . . . .
16
1.6
Pulsars as physical tools . . . . . . . . . . . . . . . . . . . . . . .
19
1.7
Thesis outline . . . . . . . . . . . . . . . . . . . . . . . . . . . . . .
22
Neutron stars
Once a main-sequence star consumes all its nuclear fuel and exhausts its sources of
energy, the star undergoes gravitational collapse as its nuclear reaction can no longer
6
Chapter 1. Pulsar Phenomenology
act against its own force of gravity. Depending on the mass of the progenitor star, there
are three possible endpoints of stellar evolution. The least massive stars contract to
form white dwarfs, while the most massive stars collapse to become black holes. The
intermediate mass stars (between 8 and 25 M⊙ ) result in what is known as neutron
stars.
Initially the gravitational collapse leads to the formation of a growing core within
an expanding shell, and a total collapse is prevented by electron degeneracy pressure of
the core. If the progenitor star is massive enough, the mass of the iron core eventually
exceeds the Chandrasekhar limit of 1.4 M⊙ . At this point, even the electron degeneracy
pressure of the core is insufficient to balance the increasing gravitational self-attraction,
leading to a second stage of rapid collapse much more violent than the first. A large
amount of gravitational potential energy of the star is released within a few seconds,
and such a catastrophic event is observed as a supernova explosion.
Most of the original mass of the progenitor star, which lies outside of the collapsing
core, is lost during the supernova explosion, while the remaining core has a mass of the
order of the Chandrasekhar limit and theoretical models based on current constraints
predict a maximum neutron star mass of about 2.4−2.5 M⊙ (Steiner et al., 2013). The
radius of the remaining core is predicted to be around 10 to 12 km (Lattimer & Prakash,
2001), which is only about 3 times larger than the Schwarzschild radius, showing that
neutron stars are highly compact objects almost like black holes. Recall that a typical
main-sequence progenitor star has a radius of the order of 106 km, therefore much larger
in size with respective to the neutron star. Conservation of angular momentum during
their formation thus leads to the rapid rotation of neutron stars, while conservation
of magnetic flux means the magnetic field lines of the progenitor star are pulled close
together during the gravitational collapse and intensifying the magnetic fields of neutron stars to 1010−12 G. The rotation and the dipolar magnetic field lead to the basis
of pulsar phenomenon, as discussed below in Section 1.2.
A back-of-the-envelope calculation using the above mass and radius shows that a
neutron star has an extremely high density exceeding 1017 kg m−3 , which is similar
to nuclear matter. At such a density, free electrons can interact with the nuclei and
combine with protons to form neutrons. As the nuclei become more and more neutronrich, they release free neutrons and eventually all, but a small percentage of the interior
matter, exists in the form of a neutron superfluid. The first model of a neutron star
comes from Oppenheimer & Volkoff (1939). They postulated that under such conditions the neutrons form a degenerate Fermi gas, with large neutron degeneracy pressure
that prevents further collapse. In fact for such a degenerate star, the only important
characteristics are its density and pressure. The relationship of density and pressure
is described by the equation-of-state (EoS). The EoS of a neutron star is, however,
uncertain as such highly compressed matter cannot be recreated and studied on Earth.
1.2. The lighthouse model
7
Figure 1.1: An illustration of the lighthouse ‘toy model’ as applied to the rotating
neutron star and its magnetosphere. Image taken from Lorimer & Kramer (2005).
Figure not to scale.
1.2
The lighthouse model
The most used analogy for the pulsar mechanism is the ‘lighthouse’ model as illustrated
in Fig. 1.1. Instead of seeing a continuous light from a lamp, we receive a radiation that
appears to be flashing. This lighthouse characteristic is a result of the misalignment
between the rotation axis and the emission axis. As the neutron star spins around
its rotation axis, charged particles are accelerated along the magnetic field lines which
forms a conical beam of electromagnetic radiation. Should this emission beam cross
our line of sight, it can be observed most readily in radio wavelengths. However, given
that the rotation and the emission axes are misaligned, we will only catch the emission
beam at some particular phases per rotation as it swings by our line of sight. Hence,
the apparent pulsed emission naturally has the same periodicity as the spin period of
the neutron star.
As predicted by the neutron star model (Pacini, 1967; Gold, 1968), the spin period
of a pulsar is observed to increase with time, i.e. P˙ = dP/dt > 0, as a result of the
outgoing radiation carrying away the rotational kinetic energy of the pulsar. All radio
pulsars are rotation-powered objects hence their respective spin period, P , and period
derivative, P˙ , are fundamental to their identities. As we shall see in the following, we
can derive a number of pulsar properties from these two parameters.
Given that the rotational energy is E = 1/2IΩ2 , where I is the moment of inertia and for a canonical pulsar it is 1038 kg m2 . The angular velocity of the pulsar is
represented by Ω = 2π/P , where P is the spin period. The maximum total output
8
Chapter 1. Pulsar Phenomenology
˙ We have
power of a pulsar can then be identified with the spin-down luminosity, E.
the following equation from Lorimer & Kramer (2005),
E˙ = IΩΩ˙ ≃ 3.95 × 1031 erg s−1
P˙
10−15
−3
P
s
(1.1)
.
Only a small portion of E˙ is converted to the radio emission that we will be studying
in this PhD thesis, whereas most of the rotational energy loss is converted to magnetic
dipole radiation, pulsar wind and high energy emission.
According to classical electrodynamics (see e.g., Jackson, 1962), a rotating magnetic
dipole radiates an electromagnetic wave at its rotation frequency. Since we can assume
that, this radiation power, E˙ dipole , is the main consumer of the rotational kinetic energy,
˙ and the rotational frequency ν = 1/P then can be
we can equate E˙ dipole with E,
expressed as a simple power law as shown for example in Lorimer & Kramer (2005),
ν˙ = −Kν n ,
(1.2)
where K is a constant and n is known as the braking index which quantifies the ‘efficiency of spin-down braking’. For a pure magnetic dipole n = 3, whereas in reality other
dissipation mechanisms may carry away some of the rotational kinetic energy hence the
observed n ranges between 0.9 to 2.9 (see e.g., Espinoza et al., 2011b; Kaspi & Helfand,
2002).
Integrating Equation (1.2) in terms of pulse period we can derive the age of the
pulsar. By assuming that the spin period at birth is much smaller than now (i.e.
P0 ≪ P ) and that the spin-down is entirely due to magnetic dipole radiation so n = 3,
Lorimer & Kramer (2005) expressed the characteristic age of a pulsar as,
P
≃ 15.8 Myr
τc ≡
2P˙
P
s
P˙
10−15
−1
(1.3)
.
Although a useful indicator of pulsar age, τc should be considered with care. As already
mention n = 3 is not always the case in reality, and when it comes to millisecond pulsars
(MSPs) which have undergone a different evolutionary track, the pulsar is ‘spun-up’
through a process known as recycling (see Section 1.4.1) leading to a decrease in the
spin period and thus often breaks the assumption of P0 ≪ P (Tauris et al., 2012).
Again by assuming that the spin-down process is dominated by dipole braking, we
can infer the strength of the pulsar surface magnetic field. Lorimer & Kramer (2005)
showed that for a canonical neutron star the characteristic surface magnetic field can
be expressed as,
19
Bsurf = 3.2 × 10 G
P P˙ ≃ 1012 G
P˙
10−15
1/2
P
s
1/2
.
(1.4)
This is a useful indication of the otherwise rarely measurable pulsar magnetic field.
Again due to the assumptions included, Bsurf should be considered only as an order of
1.3. Propagation effects
9
magnitude estimate. Nonetheless, as can be seen in the expression of Equation (1.4)
and as discussed in Section 1.1, pulsars have extremely high B-fields. In fact, outside
the pulsar the magnetic field completely dominates all physical processes, even by far
outweighing the effect of gravitation. This rotating B-field induces an external electric
field E outside the pulsar (Goldreich & Julian, 1969; Deutsch, 1955). The E-field
subsequently results in the extraction of plasma from the neutron star surface, and
the plasma fills the surrounding dominated by the magnetic field which forms what
known as the pulsar magnetosphere. This plasma experiences the same E × B force as
the neutron star interior, hence it is forced to co-rotate rigidly with the pulsar. The
co-rotating field lines can only be maintained out to a certain distance, rlc , where the
plasma reaches the speed of light, which marks an imaginary surface known as the light
cylinder (Fig. 1.1), where Ω = c/rlc . The light cylinder divides the dipolar magnetic
field lines into two types: the ‘closed field lines’ in which particles move along the lines
and are confined within the light cylinder; and the ‘open field lines’ which are the only
places where particles can flow out from the magnetosphere.
The open field lines are thus closely related to pulsar emission regions. Two likely
emission regions have been identified in the literature, namely the polar cap region and
the outer gap region. The polar gap region is where charged particles are pulled from
the neutron star surface and are accelerated to relativistic energies. Here gamma-ray
photons are produced by curvature emission (see e.g., Ruderman & Sutherland, 1975)
or inverse Compton scattering (see e.g., Daugherty & Harding, 1986). It has been
suggested that these gamma-ray photons can split and result in electron-position pair
creation (Erber, 1966). This new generation of particles may lead to secondary (or
tertiary) pair cascade (Sturrock, 1971) and has been speculated to be the source of the
beamed radio emission observed. The outer gap region is located near the last open field
lines close to the light cylinder, and may be the explanation for high energy curvature
and synchrotron emission of the pulsar as a result of pair production (Cheng et al.,
1986; Romani, 1996).
1.3
Propagation effects
The pulsar emission has to travel through the interstellar medium (ISM) before reaching
us. The turbulent and inhomogeneous nature of the ISM lead to several propagation
effects. In addition to scintillation which is analogue to the ‘twinkling’ star appearance
in the optical wavelength, dispersion and scattering are two phenomenon relevant to
pulsar emission propagation, and are discussed in this section.
1.3.1
Pulse dispersion
If space was a vacuum the broadband emission of pulsar would all arrive simultaneously
at the observer. Instead, the ISM is a cold, ionised plasma. Just like any electromagnetic waves, the group velocity (vg ) of a pulsar signal propagating through the ISM
10
Chapter 1. Pulsar Phenomenology
20
15
2000
1500
DM (cm−3 pc)
25
Carina-Sagittarius
30
Crux-Scutum
Number of pulsars
35
Norma
40
|b| < 3.5
3.5 < |b| < 5
|b| > 5
Cruz-Scutum
45
1000
500
10
5
0
20
0
−20
−40
−60
Galactic longitude ( ◦ )
0
−80
Figure 1.2: DM of all published pulsars in the general direction towards the Galactic
centre, with Galactic longitude between 30◦ ≤ l ≤ −80◦ . The known spiral arm
structures coincide with the line of sights with the highest DMs.
can be expressed by
vg = c
1−
fplasma
fobs
2
,
(1.5)
where fplasma is the plasma frequency. It is a function of the electron number density ne along the line of sight and is typically taken to be ne ≈ 0.03 cm−3 (see .e.g.,
Ables & Manchester, 1976). The observing frequency is fobs and from Equation (1.5),
it can be seen that a higher frequency component would arrive earlier as compared to
that of a lower frequency.
We can quantify the amount of time delay between two frequencies, f1 and f2 both
in MHz, to be
∆t = D × f1 −2 − f2 −2 × DM ,
(1.6)
where D is the dispersion constant and is approximately 4.15 × 10⁶ ms
(Manchester & Taylor, 1972). The dispersion measure, DM, sums the electron number
density ne along the line of sight l over a distance d, and is expressed as
d
DM =
ne dl cm−3 pc .
(1.7)
0
In theory dispersion affects every broadband emission and in particular the long wavelength electromagnetic spectrum. However, most astrophysical sources produce continuum emission hence dispersion becomes really only relevant for the time varying pulsar
1.4. Pulsar diversity
11
emission. If dispersion is not well accounted for, the observed pulsed signal will be
smeared over the bandwidth which reduces our detectability. Fig. 1.2 gives an idea of
the DM distribution of pulsars towards the direction of the Galactic centre.
A useful implication of the dispersion delay is that, by observing ∆t between two
frequencies, we can calculate the corresponding DM by Equation (1.6). This, combined
with some knowledge of the Galactic electron distribution (e.g., Cordes & Lazio, 2002),
provides an estimate of the pulsar distance, d. The DM distribution of pulsars can also
provide insight of the free electron distribution in our Galaxy. As shown in Fig. 1.2,
the known spiral arm structures of our Galaxy coincide with the line of sights with the
largest DM distribution.
1.3.2
Interstellar scattering
As the spatially coherent pulsar emission travels through the ISM, this turbulent plasma
essentially acts as multiple scattering disks with different refractive indices, which bend
and distort the pulsar signal. Photons passed through scattering disks of different radii
will be phase shifted by the variable path lengths and will arrive at different times at
the observer. The overall result is an undesirable broadening of the observed pulse
profile. This scattered pulse profile has a characteristic one-sided ‘exponential tail’ (see
Fig. 4.4 for an example), with the photons with the longest time delays accounting for
the most extended part of the exponential tail.
This scattered pulse profile is often modelled as a convolution between the true
undistorted pulse shape with a one-sided exponential with 1/e time constant, which is
more commonly quantified as the scattering time scale τs . In other words, the pulse
emission which left the pulsar at the same time now arrives at the observer over a time
interval of τs . By empirically measuring τs of a number of pulsars, Bhat et al. (2004)
showed that τs is strongly correlated with DM, therefore a high DM pulsar tends to be
more affected by scattering and vice verse.
As predicted by the thin-screen model (Scheuer, 1968), the effect of interstellar
scattering decreases with higher observing frequencies ν, such that τs ∝ 1/∆ν ∝ ν −4 .
Hence, although the random nature of scattering means that it cannot be corrected for
like the case of dispersion, its effect can be minimised by going to higher observing frequency, as is illustrated by the example of Galactic centre search given in Section 2.2.2.
1.4
Pulsar diversity
As mentioned earlier, radio pulsars are rotation-powered objects and hence their respective spin periods and period derivatives (P˙ ) are fundamental to their identities.
A classical way to distinguish different pulsars is to populate them on a period-period
derivative diagram (P -P˙ diagram) as in Fig. 1.3. The bulk of the known pulsar population falls into two distinct groups on a P -P˙ diagram. The group of pulsars at the
bottom left corner of a P -P˙ diagram has rapid spin periods measured in milliseconds,
together with small P˙ and low magnetic field strengths of 108−9 G. Members of this
population are often referred to as the millisecond pulsars or MSPs. Lee et al. (2012)
Chapter 1. Pulsar Phenomenology
14
10
12
10
10
G
s−
1
˙
E
=
1
0
3
6
−10
10
s−
=
erg
Bs
1
12
s−
1
1
0
=
erg
0
G
=
−14
3
=
1
0
10
rs
By s
˙
4
E
6
10
yrs
˙
E
Log (Period derivatives)
3
3
erg
−12
−16
8
10
rs
By s
=
−18
10
yrs
lin
e
10
De
ath
−20
0.0
G
0.5
1.0
1.5
2.0
2.5
Log (Spin period in ms)
3.0
3.5
4.0
Figure 1.3: P -P˙ diagram of known pulsars. Known pulsars as listed in the ATNF
Pulsar Catalogue 1 (PSRCAT; Manchester et al., 2005) are plotted as black dots. In
addition, pulsars in binary systems are plotted with blue circles, magnetars as listed
in the McGill Online Magnetar Catalog 2 are plotted with magenta stars, and pulsars
with known SNR associations are plotted with orange squares. Lines of constant surface
˙ are drawn,
magnetic field (Bsurf ), characteristic age (τc ), and spin-down luminosity (E)
as introduced in Section 1.2. The pulsar death line as presented in Chen & Ruderman
(1993) is also shown.
1
2
/> />
1.4. Pulsar diversity
13
derived an empirical definition to classify MSP. For simplicity, we adopt a definition
of P ≤ 30 ms and P˙ < 10−17 for MSP throughout this thesis. The second group of
pulsars, also known as the normal or slow pulsars, typically have longer spin periods
between 0.1 and a few seconds, higher P˙ of ∼ 10−15 , and higher derived magnetic field
strengths of 1011−13 G.
The P -P˙ diagram is an analogue to the Hertzsprung-Russell diagram which shows
the stages of stellar evolution for ordinary stars. A possible starting point of the
‘evolutionary track’ for a normal pulsar would be birth with short spin period at the
upper left-hand region of the P -P˙ diagram. As can be seen in Fig. 1.3, a large number of
pulsars from this region have supernova remnant (SNR) associations, a direct evidence
for their relatively young ages (see e.g., Camilo et al., 2002a,b, 2009). Pulsars then
rapidly spin down into the ‘main pulsar island’ on a timescale of 105−6 yr, their surface
magnetic fields possibly getting weaker at the same time. After about 107 yr, pulsars
reach what known as the ‘pulsar death line’ (see e.g., Chen & Ruderman, 1993). At
this point, the electrostatic potentials across the pulsar polar cap regions become too
weak to maintain the radio emission and pulsars cease to be detectable.
Note that for the rest of this thesis we have set aside the eight bright pulsars in the
large and small Magellanic clouds (Crawford et al., 2001), as well as about 80 pulsars
found within globular clusters (GCs, see a review from e.g., Freire, 2013). Pulsars found
in GCs have more complicated evolutionary histories, due to the significant probability
of multiple exchange interactions with other cluster stars. In this thesis we focus our
discussion only on pulsars in the Galactic field.
1.4.1
Binary systems
The bimodal pulsar population of normal pulsars and MSPs can mainly be explained
by the typical binarity found in MSPs. As can be appreciated from Fig. 1.3, more than
70 per cent of MSPs are in binary systems whereas less than 2 per cent are of the normal
pulsars are found in binaries. In a binary system the evolution scenario begins with two
main-sequence stars (see e.g., Bhattacharya & van den Heuvel, 1991) as illustrated in
Fig. 1.4. The initially more massive star evolves first, undergoes a supernova explosion
and gradually spins down afterwards, as it radiates its rotational energy similar to
the case of a normal pulsar as mentioned earlier. At a later stage the secondary star
comes to the end of its life and turns into a red giant. If the system is not disrupted
and if the gravitational field of the first-formed pulsar is strong enough, it will attract
matter from the red giant companion, gaining mass and angular momentum during
the process (e.g., Alpar et al., 1982; Tauris & van den Heuvel, 2006). An accreting
disk is formed and the system is visible as an X-ray binary. The pulsar is thus spun
up to very short spin periods during this phase of mass transfer, a process known as
‘recycling’. At the same time the strength of its magnetic field is reduced, resulting in
the typically small observed period derivative (e.g., Bhattacharya, 2002). Convincing
evidence for this evolution scenario has been recently discovered from the ‘missing link’
pulsar PSR J1824−2452, which swings between being an X-ray binary and a radio MSP
(Papitto et al., 2013).