Transcriptome analysis using RNA seq on response of respiratory cells infected with porcine reproductive and respiratory syndrome virus (PRRSV)
Bạn đang xem bản rút gọn của tài liệu. Xem và tải ngay bản đầy đủ của tài liệu tại đây (6.84 MB, 165 trang )
Institut für Tierwissenschaften, Abteilung Tierzucht und Tierhaltung
der Rheinischen Friedrich-Wilhelms-Universität Bonn
Transcriptome analysis using RNA-Seq on response of respiratory cells
infected with porcine reproductive and respiratory syndrome virus (PRRSV)
Inaugural-Dissertation
zur
Erlangung des Grades
Doktor der Agrarwissenschaften
(Dr. agr.)
der
Landwirtschaftlichen Fakultät
der
Rheinischen Friedrich-Wilhelms-Universität Bonn
von
Maren Julia Pröll
aus Bonn
Referent:
Prof. Dr. Karl Schellander
Korreferent:
Prof. Dr. Heinz-Wilhelm Dehne
Tag der mündlichen Prüfung:
12. September 2014
Erscheinungsjahr:
2014
Dedicated to my family
Meiner Familie
Abstract
V
Transcriptome analysis using RNA-Seq on response of respiratory cells infected with porcine
reproductive and respiratory syndrome virus (PRRSV)
The porcine reproductive and respiratory syndrome (PRRS) is one of the most important viral
diseases of the swine industry worldwide (Balasuriya 2013). Its aetiological agent is the PRRS
virus (PRRSV) (Balasuriya 2013, Conzelmann et al. 1993). The understanding of the genetic
elements and functions, involved in the response to PRRSV and the comprehension of the changes
in the global transcriptome profile post infection, remain still unclear.
Main objectives of this thesis are to characterize the global transcriptome profile of PRRSV
infected lung DCs, by using the RNA-Sequencing (RNA-Seq), to improve the understanding of
genetic components in the response to PRRSV as well as to determine the changes in the
expression profile in different respiratory cells post PRRSV infection.
Six female 30 days old piglets of two different porcine breeds (Pietrain and Duroc) were selected,
PAMs, lung DCs and trachea epithelial cells were isolated and infected with the European
prototype PRRSV strain Lelystad virus (LV). Non-infected (0 h) and infected (3, 6, 9, 12, 24 hpi)
lung DCs, PAMs and trachea epithelial cells as well as cell culture supernatants were collected.
Non-infected and infected lung DCs of both breeds were used for RNA-Seq. The sequence
alignment was done with the reference genome build Suscrofa 10.2 and with the complete genome
of LV strain.
The transcriptome analysis of PRRSV infected lung DCs of Pietrain and Duroc resulted in an
amount of 20,396 porcine predicted gene transcripts. The virus sequence alignment exhibited that
the LV strain was able to infect lung DCs and to replicate there. Not only breed-differences post
PRRSV infection in the virus growth, also breed-differences in the cytokine concentrations as well
as in the detected mRNA expression profiles and in the differently expressed genes were identified.
Beside these breed-dependent differences, cell-type dependent differences in the response to
PRRSV were characterized. 37 clusters for Pietrain and 35 clusters for Duroc and important
pathways were identified.
This thesis is the first comprehensive study that described the transcriptome profile of two different
breeds post PRRSV infection, especially of infected lung DCs. The main findings of the
investigations showed that the virus-host interaction was different for the various respiratory celltypes and that the gene expression trends proceeded contrarily for both breeds during the first time
points after infection. Additionally, key clusters, key pathways and specific gene transcripts were
identified.
VI
Kurzfassung
Transkriptom-Analyse mittels RNA-Seq von respiratorischen Zellen nach deren Infektion
mit dem Porcinen Reproduktiven und Respiratorischen Syndrom Virus (PRRSV)
Das Porcine Reproduktive und Respiratorische Syndrom (PRRS) ist eine der wichtigsten viralen
Erkrankungen in der weltweiten Schweineindustrie (Balasuriya 2013). Das PRRS Virus (PRRSV)
ist der ätiologische Erreger (Balasuriya 2013, Conzelmann et al. 1993). Die Einflussnahme von
genetischen Elementen und Funktionen auf die Reaktion auf PRRSV sowie die Veränderungen im
Transkriptomprofil nach einer Infektion sind noch unklar.
Hauptziele dieser Dissertation sind, das globale Transkriptomprofil von PRRSV infizierten
Lungen-DCs mittels RNA-Sequenzierung (RNA-Seq) zu charakterisieren, das Verständnis über die
Einflüsse von genetischen Komponenten auf die Reaktion auf PRRSV zu verbessern und die
Veränderungen im Expressionsprofil von unterschiedlichen respiratorischen Zellen nach der
Virusinfektion zu ermitteln.
Sechs weibliche, 30 Tage alte Ferkel von zwei unterschiedlichen Schweinerassen (Piétrain und
Duroc) wurden ausgewählt. Aus deren Lungen wurden PAMs und DCs sowie Epithelzellen aus
deren Trachea isoliert. Anschließend wurden diese Zellen mit dem europäischen PRRSV Stamm
Lelystad Virus (LV) infiziert. Nicht-infizierte (0 h) und infizierte (3, 6, 9, 12, 24 hpi) Lungen-DCs,
PAMs und Trachea-Epithelzellen wie auch deren Zellkulturüberstände wurden gesammelt. Zur
RNA-Seq wurden nicht-infizierte und infizierte Lungen-DCs beider Schweinerassen eingesetzt.
Das Sequenzalignment erfolgte mit dem Referenzgenombild Suscrofa 10.2 und mit dem
kompletten Genom des LV Stammes. Die Transkriptom-Analyse von PRRSV infizierten Piétrain
und Duroc Lungen-DCs erkannte 20.396 porcine Gentranskripte. Das Virus Sequenzalignment
zeigte, dass der LV Stamm sowohl Lungen-DCs infizieren als auch sich dort replizieren kann.
Nach der PRRSV Infektion konnten Rassenunterschiede festgestellt werden, sowohl beim
Viruswachstum als auch in den Cytokinkonzentrationen sowie in identifizierten mRNA
Expressionsprofilen und bei den unterschiedlich exprimierten Genen. Zudem konnten
Reaktionsunterschiede auf PRRSV in den verschiedenen respiratorischen Zelltypen charakterisiert
werden. Es wurden 37 Cluster für Piétrain, 35 für Duroc sowie wichtige Pathways identifiziert.
Diese Dissertation ist die erste umfassende Studie, die das Transkriptomprofil von PRRSV
infizierten Lungen-DCs zweier unterschiedlicher Schweinerassen beschreibt. Als Hauptergebnisse
zeigten die Untersuchungen, dass die Virus-Wirts-Interaktionen für die verschiedenen
respiratorischen Zellen unterschiedlich verliefen und dass die Genexpressionstrends beider Rassen
während der ersten Zeitpunkte nach der Infektion verschieden waren. Zusätzlich konnten
Schlüssel-Cluster, Schlüssel-Pathways und spezifische Gentranskripte identifiziert werden.
Contents
VII
Contents
page
Abstract
V
Kurzfassung
VI
List of figures
X
List of tables
XIII
Appendix (List of tables)
XIV
Appendix (List of figures)
XIV
List of abbreviations
XVI
1 Introduction
1
2 Literature review
3
2.1 Characterization of porcine reproductive and respiratory syndrome
2.1.1 Porcine reproductive and respiratory syndrome
3
3
2.1.2 Porcine reproductive and respiratory syndrome virus genome
organization
4
2.1.3 Virus cell tropism and viral replication cycle
6
2.1.4 Virus transmission
7
2.2 Immunology
2.2.1 Innate immune system
8
9
2.2.2 Adaptive immune system
10
2.2.3 Immune cells, located in the respiratory system
11
2.2.4 Development of immune system cells
12
2.2.5 Dendritic cells
13
2.2.6 Macrophages
14
2.2.7 T cells and B cells
15
2.3 Porcine reproductive and respiratory syndrome virus and the immune system
2.3.1 Virus-host interplay
16
16
2.3.2 Breed differences and genetic components in host response to
virus infection
18
2.3.3 Genetic components of immune traits
19
2.3.4 Prevention and control strategies
20
2.4 Aims of the present study
3 Material and Methods
3.1 Materials
22
23
23
VIII
Contents
3.1.1 Materials for laboratory analysis
23
3.1.2 Buffer, reagents and media
25
3.1.3 Equipment and consumables
27
3.1.4 List of software programs and statistical packages
30
3.2 Methods
31
3.2.1 Experimental animals
31
3.2.2 Preparation of cells
32
3.2.3 Cell characterization
34
3.2.4 Porcine reproductive and respiratory virus propagation
36
3.2.5 Virus infection of experimental cells
37
3.2.6 Measurement of cell viability
38
3.2.7 Estimation of phagocytosis activity
39
3.2.8 Phenotype analysis with cytokine assays
40
3.2.9 RNA isolation
40
3.2.10 RNA-Sequencing
44
3.2.11 Validation of selected candidate genes by quantitative
real-time polymerase chain reaction
46
3.2.12 Cytokine expression profile by quantitative real-time polymerase
chain reaction
3.2.13 Statistical analyses
48
49
3.2.13.1 Next generation sequencing analysis
49
3.2.13.2 Real-time PCR analyses
52
4 Results
4.1 Cell characterization
53
53
4.1.1 Cell characterization by flow cytometry analyses
53
4.1.2 Cell characterization by immunofluorescence assay
55
4.1.3 Cell viability and phagocytosis activity
56
4.2 Cytokines secretions in relation to the cytokine gene expression profiles
58
4.3 Transcriptome analysis
63
4.3.1 RNA-Sequencing processing and alignment
63
4.3.2 Virus sequence alignment
63
4.4 Clustering gene expression profiles and network analysis
65
Contents
IX
4.4.1 Pathway enrichment analysis after RNA-Sequencing
66
4.4.2 Analysis of gene transcripts frequency
69
4.4.2.1 Gene transcripts frequency for Duroc
69
4.4.2.2 Gene transcripts frequency for Pietrain
70
4.4.2.3 Comparison of Duroc and Pietrain gene transcript
frequency analysis
70
4.5 Differentially expressed gene transcripts after RNA-Sequencing
72
4.6 Validation of RNA-Sequencing data
74
4.6.1 Interleukin-6
74
4.6.2 Chemokine (C-C motif) ligand 4
76
4.6.3 Chemokine (C-X-C motif) ligand 2
78
4.6.4 SLA-DRA MHC class II DR-alpha
80
4.6.5 Janus kinase 2
82
4.6.6 MHC class I antigen 1, CD86 and IFNβ1
84
4.6.7 Cell-type dependent expression trends
85
5 Discussion
87
5.1 Respiratory cells and their phenotypic characterization
88
5.2 Cytokine profiling
89
5.3 Transcriptome profiling post virus infection
91
5.3.1 Virus replication
5.4 Cluster analyses of RNA-Sequencing data
5.4.1 Functional analyses of clustered gene transcripts
5.5 Differentially expressed gene transcripts post infection
5.5.1 Virus-host interaction
5.5.2 Gene signaling post infection
93
94
94
97
98
100
5.6 Conclusion
103
5.7 Perspective
105
6
Summary
107
7
References
109
8
Appendix
127
Danksagung
143
Publications
144
X
Contents
List of figures
Figure 1:
page
PRRSV genome organization from 5´ to 3´, schema modified and
simplified, compare the reviews of Fang and Snijder (2010), Snijder
and Meulenberg (1998)
Figure 2:
Schematic representation of arterivirus genome organization
(King et al. 2011)
Figure 3:
5
Recognition of pathogens by dendritic cells and stimulation of naïve
T cells, picture modified, compare the review of Akira et al. (2001)
Figure 4:
4
10
Location of macrophages in the lung, alveolar macrophages (AM)
and interstitial macrophages (IM), modified and simplified, compare
the review of Laskin et al. (2001)
Figure 5:
11
Pathway of immune cell development, modified and simplified,
compare the reviews of Geissmann et al. (2010), Okwan-Duodu et
al. (2013), as well as Tsunetsugu-Yokota and Muhsen (2013)
Figure 6:
12
Experimental design I for PRRSV infection: Pietrain (n=3, animal A1,
A2, A3) and Duroc (n=3, animal A1, A2, A3) lung DCs, PAMs and
trachea epithelial infected with LV; sample collection: non-infected cells
(green circle) at 0 h and infected cells (blue circle) at 3, 6, 9, 12, 24 hpi
Figure 7:
38
Experimental design II for total RNA isolation: RNA isolation for
RNA-Seq of pooled Pietrain and Duroc lung DCs (I); RNA isolation
for real-time PCR of pooled Pietrain and Duroc lung DCs and pooled
Pietrain and Duroc PAMs (II) as well as of non-pooled lung DCs and
non-pooled trachea epithelial cells (III) of Pietrain animals (A 1, 2, 3)
and Duroc animals (A 1, 2, 3); non-infected cells (green circle) at 0 h
and infected cells (blue circle) at 3, 6, 9, 12, 24 hpi
41
Figure 8:
Workflow out of the LT TruSeq RNA Sample Preparation protocol
45
Figure 9:
Workflow of statistical analyses
49
Figure 10: Staining of cell surface molecules on lung DCs and PAMs for flow
cytometric analyses. The cell numbers are listed at the y-axis and the
fluorescence on the x-axis. The first row (A) includes cells without
staining and the second row (B) includes cells which were stained with
the above mentioned cell surface markers. The last row (C) includes the
measured fluorescence of both detections, first of cells without
Contents
XI
antibodies (blue-line histogram) and second of cells, stained with
antibody (red-line histogram)
54
Figure 11: IF staining of trachea epithelial cells with zonula occludens protein
(ZO-1), cytokeratin (CK) and DAPI. First the cell markers are merged
together, next each marker is presented separately, the last pictures
show the stained nucleus
55
Figure 12: Relative cell viability of infected lung DCs (A), PAMs (B) and trachea
epithelial cells (C) at 6 hpi and 12 hpi
56
Figure 13: Relative phagocytosis effect (%) of LPS (dose: 5 µg/ml) infected Pietrain
(Pi) and Duroc (Du) lung DCs and PAMs
57
Figure 14: Levels of cytokines in cell culture supernatant at 9 hpi in lung DCs,
PAMs and trachea epithelial cells of Pi and Du. The concentrations
(pg/ml) of IFN-γ (A), TNF-α (B), IL-1β (C) and IL-8 (D) were
measured with commercial porcine ELISA kits
59
Figure 15: Gene expression levels of IL-1ß in non-infected (0 h) and infected (3, 6,
9, 12, 24 hpi) lung DCs (A) and PAMs (B) of Pietrain and Duroc
60
Figure 16: Gene expression levels of IL-8 non-infected (0 h) and infected (3, 6, 9,
12, 24 hpi) lung DCs, PAMs (B) and trachea epithelial cells (C) of
Pietrain and Duroc
61
Figure 17: Virus sequence alignment of Pietrain and Duroc lung DCs before and
post PRRSV infection
Figure 18: Pietrain network with 37 clusters (A), Duroc network with 35 clusters (B)
64
65
Figure 19: Mean expression curve for cluster 26 of Pietrain (A) and cluster 25 of
Duroc (B)
66
Figure 20: Number of gene transcripts per pathway. Gene transcripts are listed at
the y-axis, according to the “Top 10 List” (compare Table 5)
68
Figure 21: Number of down-regulated Duroc and Pietrain lung DCs gene
transcripts during the course of infection with PRRSV (3, 6, 9, 12, 24 hpi)
72
Figure 22: Number of up-regulated Duroc and Pietrain lung DCs gene transcripts
during the course of infection with PRRSV (3, 6, 9, 12, 24 hpi)
Figure 23: Gene expression profile of IL-6 in infected and non-infected lung DCs,
detected by RNA-Seq (A) and by real-time PCR (B), gene expression
profile of IL-6 in infected and non-infected PAMs, detected by real-time
PCR (C) and gene expression profile of IL-6 in infected and non-infected
73
XII
Contents
trachea epithelial cells, detected by real-time PCR (D) of Pietrain (black
line) and of Duroc (red line). All measurements were done at 0 h and at
3, 6, 9, 12, 24 hpi
75
Figure 24: Gene expression profile of CCL4 in infected and non-infected lung
DCs, detected by RNA-Seq (A) and by real-time PCR (B), gene
expression profile of CCL4 in infected and non-infected PAMs, detected
by real-time PCR (C) and gene expression profile of CCL4 in infected
and non-infected trachea epithelial cells, detected by real-time PCR (D)
of Pietrain (black line) and of Duroc (red line). All measurements were
done at 0 h and at 3, 6, 9, 12, 24 hpi
77
Figure 25: Gene expression profile of CXCL2 in infected and non-infected lung
DCs, detected by RNA-Seq (A) and by real-time PCR (B), gene
expression profile of CXCL2 in infected and non-infected PAMs,
detected by real-time PCR (C) and gene expression profile of CXCL2
in infected and non-infected trachea epithelial cells, detected by real-time
PCR (D) of Pietrain (black line) and of Duroc (red line). All measurements
were done at 0 h and at 3, 6, 9, 12, 24 hpi
79
Figure 26: Gene expression profile of SLA-DRA in infected and non-infected lung
DCs, detected by RNA-Seq (A) and by real-time PCR (B), gene
expression profile of SLA-DRA in infected and non-infected PAMs,
detected by real-time PCR (C) and gene expression profile of SLA-DRA
in infected and non-infected trachea epithelial cells, detected by real-time
PCR (D) of Pietrain (black line) and of Duroc (red line). All measurements
were done at 0 h and at 3, 6, 9, 12, 24 hpi
81
Figure 27: Gene expression profile of JAK2 in infected and non-infected lung
DCs, detected by RNA-Seq (A) and by real-time PCR (B), gene
expression profile of JAK2 in infected and non-infected PAMs,
detected by real-time PCR (C) and gene expression profile of JAK2 in
infected and non-infected trachea epithelial cells, detected by real-time
PCR (D) of Pietrain (black line) and of Duroc (red line). All measurements
were done at 0 h and at 3, 6, 9, 12, 24 hpi
83
Figure 28: Virus-host interaction. Schema modified, compare Zhou et al. (2011a),
* genes and gene families which were identified by RNA-Seq, + genes
which were validated through real-time PCR
98
Contents
XIII
List of tables
Table 1:
page
Features of innate and adaptive immune response, table modified
and simplified, compare Abbas et al. (2012)
8
Table 2:
Antibodies, used for flow cytometry analyses
34
Table 3:
Primers and their sequences of ten selected candidate genes
47
Table 4:
Primers and their sequences for cytokine expression profiling
48
Table 5:
“Top 10 List” of pathways and the associated clusters
67
Table 6:
Microarray and sequencing approaches post PRRSV infection
92
XIV
Contents
Appendix (List of tables)
Table A1: Abbreviations of gene transcripts and proteins
page
127
Table A2: Read counts of Pietrain lung DCs before and after filtration as well as
mapping statistics, detected by RNA-Seq
134
Table A3: Read counts of Duroc lung DCs before and after filtration as well as
mapping statistics, detected by RNA-Seq
134
Table A4: Cluster description of Pietrain lung DCs after RNA-Seq
135
Table A5: Cluster description of Duroc lung DCs after RNA-Seq
136
Appendix (List of figures)
Figure A1: PAMs, after staining with REASTAIN® Quick-Diff Kit (Nikon, 40 x)
page
131
Figure A2: lung DCs, after staining with REASTAIN® Quick-Diff Kit (Nikon, 20 x) 131
Figure A3: Relative phagocytosis effect (%) of LPS (dose: 1 µg/ml) infected
trachea epithelial cells
131
Figure A4: Gene expression levels of TNF-α in non-infected (0 h) and infected
(3, 6, 9, 12, 24 hpi) lung DCs (A), PAMs (B) and trachea epithelial
cells (C) of Pietrain and Duroc, detected by real-time PCR
132
Figure A5: Gene expression levels of IL-12p40 in non-infected (0 h) and infected
(3, 6, 9, 12, 24 hpi) lung DCs (A), PAMs (B) and trachea epithelial
cells (C) of Pietrain and Duroc, detected by real-time PCR
133
Figure A6: Gene expression profile of SLA-1 in infected and non-infected lung
DCs, detected by RNA-Seq (A) and by real-time PCR (B), gene
Expression profile of SLA-1 in infected and non-infected PAMs,
detected by real-time PCR (C) and gene expression profile of
SLA-1 in infected and non-infected trachea epithelial cells, detected
by real-time PCR (D) of Pietrain (black line) and of Duroc (red line).
All measurements were done at 0 h and at 3, 6, 9, 12, 24 hpi
137
Figure A7: Gene expression profile of CD86 in infected and non-infected lung DCs,
detected by RNA-Seq (A) and by real-time PCR (B), gene expression
profile of CD86 in infected and non-infected PAMs, detected by realtime PCR (C) and gene expression profile of CD86 in infected and noninfected trachea epithelial cells, detected by real-time PCR (D) of
Pietrain (black line) and of Duroc (red line). All measurements were
done at 0 h and at 3, 6, 9, 12, 24 hpi
138
Contents
XV
Figure A8: Gene expression profile of IFN1ß in infected and non-infected lung DCs,
detected by RNA-Seq (A) and by real-time PCR (B), gene expression
profile of IFN1ß in infected and non-infected PAMs, detected by real-time
PCR (C) and gene expression profile of IFN1ß in infected and noninfected trachea epithelial cells, detected by real-time PCR (D) of Pietrain
(black line) and of Duroc (red line). All measurements were done at 0 h
and at 3, 6, 9, 12, 24 hpi
140
XVI
List of abbreviations
List of abbreviations
Acc no
Accession number
AM
Alveolar macrophages
APC
Allophycocyanin
APCs
Antigen-presenting cells
BAM
Binary Alignment/Map
BIC
Bayesian information criterion
bp
Base pair
CD
Cluster of differentiation
cDCs
Conventional DCs
CDPs
Common DC precursors
cDNA
Complementary DNA
CK
Cytokeratin
CT
Comparative threshold cycle
CPE
Cytophathic effect
CTLs
Cytotoxic T cells
DAPI
4’, 6’- diamidino-2-phenylindole
DCs
Dendritic cells
ddH2O
Double-distilled water
DMEM
Dulbecco's Modified Eagle Medium
DMSO
Dimethyl sulfoxide
DNA
Deoxynucleic acid
dNTPs
Deoxyribonucleoside triphosphate
DPBS
Dulbecco's Phosphate-Buffered Saline
dpi
Days post infection
DTCS
Dye Terminator Cycle Sequencing
DTT
Dithiothreitol
Du
Duroc
E
Envelope glycoprotein
EDTA
Ethylenediaminetetraacetic acid
e.g.
For example
List of abbreviations
ELISA
Enzyme-linked immunosorbent assay
ER
Endoplasmic reticulum
F
Forward
FBS
Fetal Bovine Serum
FDR
False discovery rate
FITC
Fluorescein isothiocyanate
GM-CSF
Granulocyte macrophage-colony-stimulating factor
GP
Glycoproteins
H2O
Water
HCl
Hydrochloric acid
hpi
Hours post infection
HSD
Honest Significant Difference
HSCs
Hematopoietic stem cells
IF
Immunofluorescence
IFA
Immunofluorescence assay
IgG
Immunoglobulin G
ISGs
IFN-stimulated genes
IM
Interstitial macrophages
kb
Kilobases
KCl
Potassium Chloride
KEGG
Kyoto Encyclopedia of Genes and Genomes
LPS
Lipopolysaccharides
LT
Low-Thoughput
LV
Lelystad virus
M
Matrix protein
MDDCs
Monocyte-derived DCs
MDPs
Macrophage and DC precursors
mg
Milligram
MHC
Major histocompatibility complex
min
Minute
MLV
Modified-live virus vaccines
ml
Millilitres
XVII
XVIII
List of abbreviations
MOI
Multiplicity of infection
mRNA
Messenger RNA
MTT
Thiazolyl Blue Tetrazolium Bromide
N
Nucleocapsid protein
NaCl
Sodium chloride
NaOH
Sodium hydroxide
NCBI
National center for biotechnology information
NEAA
Non-Essential Amino Acids
ng
Nanogram
NGS
Next generation sequencing
no
Number
NSPs
Non-structural proteins
µg
Microgram
µl
Microliter
°C
Degree celsius
OD
Optical density
ORFs
Open reading frames
P
Primer
PAM
Pulmonary alveolar macrophages
PAMPs
Pathogen-associated molecular patterns
PCR
Polymerase chain reaction
pDCs
Plasmacytoid DCs
PE-Cy7
Phycoerythrin and a cyanine dye 7
PFU
Plaque-forming units
Pg
Picogram
pH
pH value
Pi
Pietrain
pp
Polyproteins
preDCs
Precursor DCs
PRRs
Pattern-recognition receptors
PRRS
Porcine reproductive and respiratory syndrome
PRRSV
Porcine reproductive and respiratory syndrome virus
List of abbreviations
XIX
qRT-PCR
Quantitative real-time reverse transcriptase polymerase chain reaction
QTL
Quantitative trait loci
R
Reverse
RBC
Red Blood Cell
RdRp
RNA-dependent RNA polymerase
RLRs
RIG-I like receptors
RNA
Ribonucleic acid
RNA-Seq
RNA-Sequencing
rpm
Rounds per minute
RT
Room temperature
RTC
Replication and Transcription Complex
SAGE
Serial Analysis of Gene Expression
SAM
Sequence Alignment/Map
sec
Second
Seq
Sequencing
Sn
Sialoadhesin
SNP
Single nucleotide polymorphisms
ss
Single-stranded
SSC
swine chromosome
TAE
Tris-acetate buffer
TCRs
T cell receptors
TH1
Type 1 helper
TH2
Type 2 helper
TIR
Toll/IL-1 receptor
TLRs
Toll-like receptors
UTR
Untranslated region
ZO-1
Zonula occludens protein
4PL
4 Parameters Logistic
A list of abbreviations of gene transcript and protein names are listed in the appendix
(Table A1).
Introduction
1
1
Introduction
In November 2013 the federal statistical office of Germany published a report about
livestock status for Germany and listed 27,900 pig farms which keep in total 28,1 million
animals, this is a growth of approximately 10 % in relation to the situation of 2001
(Statistisches-Bundesamt 2010, 2014). In parallel, the application of medications in animal
production let to an increasing criticism because of the possible formations of multiresistant germs (BMEL 2011, Niggemeyer 2012).
In 2006 growth promoters were legally prohibited in Europe. Nationwide vaccination of
mycoplasma, of circovirus and partially of porcine reproductive and respiratory syndrome
(PRRS) helped to improve the health status in fattening pigs. These processes reduced the
risks of animal losses and allowed smaller applications of medications (Niggemeyer 2012).
Higher densities in closed environments and the increasing herd sizes improved the
possibility of transmission for airborne pathogens. Consequently in the modern swine
production, respiratory diseases are the most serious disease problem (Brockmeier et al.
2002, reviewed by Sørensen et al. 2006).
One of the most important viral diseases of the swine industry worldwide is PRRS
(Balasuriya 2013). Its aetiological agent is the PRRS virus (PRRSV) (Balasuriya 2013,
Conzelmann et al. 1993). This syndrome costs the global swine industry significant
production losses, leads to poor financial circumstances annually (Neumann et al. 2005,
Pejsak and Markowska-Daniel 1997, reviewed by Zimmerman et al. 2012) and can become
endemic in the major swine producing areas of Europe (Mateu et al. 2003, Zimmerman et
al. 2012), Asia (Li et al. 2012, Tian et al. 2007), North and South America (Dewey et al.
2000, reviewed by Zimmerman et al. 2012). The massive outbreaks of PRRS in autumn
and winter of 2009/2010 were reported in the paper “top agrar 10/2010” (Pabst 2010).
The development of these respiratory diseases is a multifactorial complex, including
infectious agents, the host as well as environmental and management considerations and
genetic factors (Brockmeier et al. 2002, reviewed by Sørensen et al. 2006). PRRSV
infected pigs are ineffective in eliminating the virus and PRRSV can induce a prolonged
viremia and a persistent infection (reviewed by Murtaugh et al. 2002). Unfortunately, the
PRRSV genome changes and heterologous strains quickly arise, due to the high degree of
genetic variability of PRRSV. Generally, the control remains problematic as the efficacy
and universality of PRRS vaccination has not been established and no effective treatments
against a largely uncontrolled disease are available (reviewed by Huang and Meng 2010,
2
Introduction
reviewed by Kimman et al. 2009, reviewed by Mateu and Diaz 2008, Modrow et al. 2010,
Palzer 2013).
PRRSV has a complex interaction with the immune system by replication and by strong
modulations of the host immune responses in innate tissue cells such as macrophages,
monocytes and dendritic cells (Genini et al. 2008, Loving et al. 2007, Miller et al. 2010,
Xiao et al. 2010b). Researches have indicated that there are breed differences and genetic
components, involved in the response to PRRSV infection. Variations in the host
susceptibility of animals and in host resistance have been mentioned (Halbur et al. 1998,
Petry et al. 2005). In their review Lunney and Chen (2010) summarized the influence
factors on research of resistance/susceptibility to viral pathogens, including the route of
infection, transmission, replication and the response of the innate and adaptive immune
system. The development of breeding programmes, including host genetic improvement
for disease resistance and tolerance may have an impact on the control and the reduction of
PRRS (Flori et al. 2011b, Lewis et al. 2007, Lewis et al. 2009).
The above mentioned facts lead to the still important necessities: to improve pigs' health, to
reduce economic losses, medical costs and treatments, to enhance breeding strategies for
pigs with good parameters of immunity and production traits, to develop higher control and
prevention strategies as well as more effective vaccines and to select disease resistant pigs.
There are genetic components involved in determining how effective each pig will
response to PRRSV infection. But a transcriptonal overview, related to understand the
genetic influence on the immunological reaction to PRRSV infection, is needed. The
knowledge about these factors is extremely important in order to increase the
understanding of the immune response to PRRSV and to develop control and therapy
strategies for this type of viral infection.
Accordingly, the main objective of this thesis was to investigate the transcriptome profile
of respiratory cells of two different genetic breeds after PRRSV infection and to
characterize gene expression changes of these cells. The aims in detail and the hypotheses
of this thesis follow in chapter 2.4.
Literature review
2
2.1
3
Literature review
Characterization of porcine reproductive and respiratory syndrome
2.1.1 Porcine reproductive and respiratory syndrome
In the late 1980s in the United States the first clinical outbreaks of porcine reproductive
and respiratory syndrome (PRRS) have been reported and recognized as a mystery swine
disease or swine infertility and respiratory syndrome (Benfield et al. 1992, López 2001,
Wensvoort et al. 1991). In 1991 in the Netherlands the virus was subsequently isolated and
named Lelystad virus (LV) (López 2001, Wensvoort et al. 1991). Fundamentally PRRS is
characterized by high mortality of nursery piglets (Pejsak and Markowska-Daniel 1997)
and leads to massive reproductive failures, including abortions, stillbirth (López 2001,
Tizard 2013) and premature farrowings as well as to weak or mummified piglets
(Balasuriya 2013, Modrow et al. 2010, reviewed by Zimmerman et al. 2012). In pigs of all
ages, PRRS is associated with respiratory distress (López 2001, Tizard 2013), interstitial
pneumonia in growing and finishing swines and it can cause decreased growth
performance (Collins et al. 1992, Xiao et al. 2010b). The aetiological agent of PRRS,
porcine reproductive and respiratory syndrome virus (PRRSV), is a single-stranded (ss) 15
kb positive-sense RNA virus with morphological and morphogenetic similarities to
members of the arterivirus group (Conzelmann et al. 1993, Meulenberg et al. 1993).
Arteriviridae are grouped together with the Coronaviridae and the Roniviridae in the order
of the Nidovirales. All Nidovirales members are enveloped viruses like the equine arteritis
virus and the lactate dehydrogenase-elevating virus (Balasuriya 2013, Modrow et al. 2010).
The consequences of an infection can range from a persistent infection to an acute disease
(reviewed by Snijder et al. 2013). Two distinct viral genotypes of PRRSV have been
isolated and characterized recently, the European strain (LV) and the Norh American strain
VR-2332 (Benfield et al. 1992, Collins et al. 1992, Modrow et al. 2010, Wensvoort et al.
1991). These two genotypes share morphological and structural similarities as well as
about 55 - 70 % identity at the nucleotide level (Balasuriya 2013, Modrow et al. 2010).
4
Literature review
2.1.2 Porcine reproductive and respiratory syndrome virus genome organization
The PRRSV ss positive-sense RNA genome consists of eight open reading frames (ORFs)
(Conzelmann et al. 1993, Meulenberg et al. 1993). These ORFs encode the viral replicase
and form six or seven 3´-coterminal nested subgenomic viral messenger RNA (mRNA)
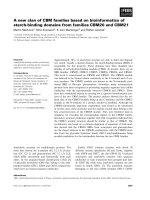
transcripts (mRNA1 - mRNA7) (Figure 1) (Meulenberg et al. 1993).
Figure 1:
PRRSV genome organization from 5´ to 3´, schema modified and
simplified, compare the reviews of Fang and Snijder (2010), Snijder and
Meulenberg (1998)
ORF 1a and ORF 1b are located just downstream of the 5-untranslated region (UTR) and
substantiate more than tow-third (approximately 80 %) of the viral genome (Meulenberg et
al. 1993, Modrow et al. 2010). ORF 1a and ORF 1b encode two viral replicase
polyproteins (pp) 1a and pp1ab (Figure 1). This synthesis and cleavage are the first steps of
virus infection (Modrow et al. 2010, reviewed by Zimmerman et al. 2012). ORF 1a is
translated by the genomic RNA, ORF 1b is expressed by a ribosomal frameshifting,
engaging a large ORF 1ab polyprotein and resulting in products which are involved in the
Literature review
5
virus transcription and replication. The viral pp1a and pp1ab are proteolytically processed
in 12 functional non-structural proteins (NSPs). NSPs are involved in the genome
replication and the subgenomic mRNA transcription (reviewed by Modrow et al. 2010,
Snijder and Meulenberg 1998). ORF 1a encodes NSP2 (Allende et al. 1999) and is
considered as an important region for monitoring genetic variation (Fang et al. 2004).
NSP4 is the main protease and produces NSPs 3 - 12. All NSPs are fully conserved in the
genomes of PRRSV (reviewed by Fang and Snijder 2010). The ORFs from 2 - 7 are
situated at the 3´end of the genome (Meulenberg et al. 1993). ORF 2a, ORF 2b and ORFs 3
- 6 are characterized as membrane-associated proteins, encoding the viral structure proteins
like glycoproteins (GP) 2a, GP2b, GP3, GP4, GP5 and the matrix protein (M) whereas the
nucleocapsid protein (N) is encoded by ORF 7 (Conzelmann et al. 1993, Modrow et al.
2010, reviewed by Snijder and Meulenberg 1998) (Figure 1). N protein forms the principal
component of the viral capsid (Modrow et al. 2010) and is localized in the host cell nucleus
and in the nucleolus during replication (King et al. 2011, Rowland et al. 1999). The
envelope glycoprotein (E) (Snijder et al. 1999) is translated by ORF 2a/2b. E is required
for the production of ion-channel proteins (King et al. 2011). A schematic representation of
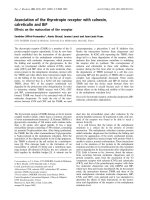
the arterivirus genome organization is depicted in Figure 2.
Figure 2:
Schematic representation of arterivirus genome organization (King et al.
2011)