Detailed x ray properties of galaxy groups and fossil groups
Bạn đang xem bản rút gọn của tài liệu. Xem và tải ngay bản đầy đủ của tài liệu tại đây (4.95 MB, 136 trang )
Detailed X-ray properties of galaxy groups and
fossil groups
Dissertation
zur
Erlangung des Doktorgrades (Dr. rer. nat.)
der
Mathematisch-Naturwissenschaftlichen Fakultät
der
Rheinischen Friedrich-Wilhelms-Universität Bonn
von
Bharadwaj Vijaysarathy
aus
Chennai
Bonn, 2015
Dieser Forschungsbericht wurde als Dissertation von der Mathematisch-Naturwissenschaftlichen
Fakultät der Universität Bonn angenommen und ist auf dem Hochschulschriftenserver der ULB Bonn
elektronisch publiziert.
1. Gutachter:
2. Gutachter:
Prof. Dr. Thomas H. Reiprich
Prof. Dr. Peter Schneider
Tag der Promotion:
Erscheinungsjahr:
10.07.2015
2015
Abstract
Most galaxies in the Universe are aggregated into groups of galaxies, agglomerations of a few 10s of
galaxies (at most). Typically, they have been considered to be similar to clusters, which contain a few
100s of galaxies, which however does not mean that the two types of systems have the exact same
properties. In this dissertation, the goal was to study the similarities and differences between groups
and clusters, for a selection of properties, primarily of the hot X-ray emitting gas, i.e. the intracluster
medium. This was carried out via three sub-projects.
In the first project, the goal was to investigate the cool-core properties of a sample of 26 galaxy
groups with Chandra data and correlate it to the feedback from the supermassive black hole (SMBH)
in the group centres. This involved handling data in three wavelengths, namely, X-ray, radio, and nearinfrared (NIR). For the X-ray analysis, the Chandra data was used to extract temperature and density
profiles and constrain the central cooling time (CCT) and central entropy; two important cool-core
diagnostics. The CCT was used to classify the galaxy groups into strong cool-core, weak cool-core, and
non cool-core classes, which was done for the first time for an objectively selected galaxy group sample.
The radio output of the central active galactic nucleus (AGN) was constrained using catalogue data and
correlated to the CCT. The mass of the central SMBH was determined using NIR data for the brightest
cluster galaxy (BCG) from the 2MASS extended source catalogue (XSC), and a scaling relation from
Marconi & Hunt (2003). Finally, the scaling relation between the X-ray luminosity/mass of the galaxy
group and cluster (LX /M500 ) and the NIR luminosity of the BCG was extended all the way from the
cluster regime to the group regime. The results show that although the observed cool-core fraction is
similar in galaxy groups and clusters, there are important differences between the two classes of objects.
Firstly, despite having very short CCTs (CCT < 1 Gyr), there are some galaxy groups which have a
centrally rising temperature profile unlike what is observed for clusters. Secondly, there is an absence
of a correlation between the CCT and the central radio-loud AGN fraction in groups unlike that for
clusters. Thirdly, the indications of an anti-correlation trend between the CCT and the radio luminosity
of the central AGN observed for clusters is not seen for galaxy groups. Fourthly, the weak correlation
between the radio luminosity and the mass of the SMBH observed for strong cool-core (SCC) galaxy
clusters is absent for SCC galaxy groups. Finally, the strong correlation for the LX –LBCG and the M500 –
LBCG scaling relation observed for clusters weakens significantly when the scaling relation is extended
to the group regime.
In the second project, the bolometric LX –T scaling relation was extended from the cluster regime to
the group regime. Additionally, we studied the impact of ICM cooling and AGN feedback on the scaling
relation for the first time for galaxy groups by fitting the relation for individual sub-samples, accounting
for different cases of ICM cooling and AGN feedback. The impact of selection effects were qualitatively
and quantitatively examined using simulations, and bias-corrected relations were established for the
entire sample and all sub-samples. The slope of the bias-corrected LX –T relation is marginally steeper
but consistent within errors to that of clusters (∼ 3), with the relation being steepest and highest in
iii
normalisation for the strong cool-core groups (CCT ≤ 1 Gyr), and shallowest for those groups without
a strong cool-core. The statistical scatter in T on the group regime is comparable to the cluster regime,
while the statistical and intrinsic scatter in LX increases. Interestingly, we report for the first time that
the bias-corrected intrinsic scatter in LX is higher than the observed scatter for groups. We also see
indications that groups with a relatively powerful radio-loud AGN have a much steeper LX –T relation.
Finally, we speculate that such powerful AGN are preferentially located in groups which lack a strong
cool-core.
The scientific goal of the third project was to investigate the core properties of fossil systems in detail
for the very first time using Chandra archival data for 17 systems. The presence/absence of a cool-core in
fossils was determined via three diagnostics, namely the CCT, cuspiness, and concentration parameter.
The X-ray peak/BCG separation and the X-ray peak/emission weighted centre separation was quantified
to give an indication of the dynamical state of the system. We also studied five low redshift fossils
(z < 0.05) in detail and obtained their deprojected ICM properties. Lastly, we also studied the LX –
T relation which shows indications of being shallower and higher in normalisation compared to other
galaxy groups, after factoring in potential selection effects. We interpreted these results within the
context of the formation and evolution of fossils, and concluded that these systems are affected by
non-gravitational processes particularly AGN feedback which leaves a strong imprint on the ICM.
iv
Contents
1
Introduction
2
Theoretical background
2.1 Galaxy groups and clusters . . . . . . . . . . . . . . . . . . .
2.1.1 Galaxy groups . . . . . . . . . . . . . . . . . . . . .
2.2 Cluster galaxies . . . . . . . . . . . . . . . . . . . . . . . . .
2.3 Dark matter . . . . . . . . . . . . . . . . . . . . . . . . . . .
2.3.1 Gravitational lensing . . . . . . . . . . . . . . . . . .
2.4 The intracluster medium . . . . . . . . . . . . . . . . . . . .
2.4.1 Studying the ICM using the Sunyaev-Zeldovich effect
2.4.2 ICM in X-rays . . . . . . . . . . . . . . . . . . . . .
2.4.3 Density and surface brightness profile of the ICM . . .
2.4.4 Temperature distribution of the ICM . . . . . . . . . .
2.5 X-ray scaling relations . . . . . . . . . . . . . . . . . . . . .
2.6 Cooling flows, cool-cores and AGN feedback . . . . . . . . .
2.6.1 Active galactic nuclei-AGN . . . . . . . . . . . . . .
2.6.2 AGN feedback . . . . . . . . . . . . . . . . . . . . .
3
5
.
.
.
.
.
.
.
.
.
.
.
.
.
.
.
.
.
.
.
.
.
.
.
.
.
.
.
.
.
.
.
.
.
.
.
.
.
.
.
.
.
.
.
.
.
.
.
.
.
.
.
.
.
.
.
.
.
.
.
.
.
.
.
.
.
.
.
.
.
.
.
.
.
.
.
.
.
.
.
.
.
.
.
.
.
.
.
.
.
.
.
.
.
.
.
.
.
.
.
.
.
.
.
.
.
.
.
.
.
.
.
.
.
.
.
.
.
.
.
.
.
.
.
.
.
.
.
.
.
.
.
.
.
.
.
.
.
.
.
.
.
.
.
.
.
.
.
.
.
.
.
.
.
.
.
.
.
.
.
.
.
.
.
.
.
.
.
.
.
.
.
.
.
.
.
.
.
.
.
.
.
.
X-ray astronomy
3.1
3.2
3.3
.
.
.
.
.
.
.
.
.
.
.
.
.
.
.
.
.
.
.
.
.
.
.
.
.
.
.
.
.
.
.
.
.
.
.
.
.
.
.
.
.
.
.
.
.
.
.
.
.
.
.
.
.
.
.
.
.
.
.
.
.
.
.
.
.
.
.
.
.
.
.
.
.
.
.
.
.
.
.
.
.
.
.
.
.
.
.
.
.
.
.
.
.
.
.
.
.
.
.
.
.
.
.
.
.
.
.
.
.
.
ICM cooling, AGN feedback and BCG properties of galaxy groups
4.1 Introduction . . . . . . . . . . . . . . . . . . . . . . . . . . . . . .
4.2 Sample selection and data analysis . . . . . . . . . . . . . . . . . .
4.2.1 Sample selection . . . . . . . . . . . . . . . . . . . . . . .
4.2.2 Data reduction . . . . . . . . . . . . . . . . . . . . . . . .
.
.
.
.
.
.
.
.
.
.
.
.
.
.
.
.
.
.
.
.
.
.
.
.
.
.
.
.
.
.
.
.
.
.
.
.
.
.
.
.
3.5
Components of X-ray telescopes . .
The X-ray background . . . . . . .
Steps involved in X-ray data analysis
3.3.1 Reprocessing event files . .
3.3.2 Cleaning of light curves . .
3.3.3 Removing point sources . .
3.3.4 Spectral analysis . . . . . .
3.3.5 Surface brightness analysis .
The Chandra X-ray telescope . . . .
3.4.1 The ACIS instrument . . . .
The eROSITA telescope . . . . . . .
5
5
6
9
9
10
12
12
16
17
19
21
22
22
27
.
.
.
.
.
.
.
.
.
.
.
3.4
4
1
.
.
.
.
.
.
.
.
.
.
.
.
.
.
.
.
.
.
.
.
.
.
.
.
.
.
.
.
.
.
.
.
.
.
.
.
.
.
.
.
.
.
.
.
.
.
.
.
.
.
.
.
.
.
.
.
.
.
.
.
.
.
.
.
.
.
.
.
.
.
.
.
.
.
.
.
.
.
.
.
.
.
.
.
.
.
.
.
.
.
.
.
.
.
.
.
.
.
.
.
.
.
.
.
.
.
.
.
.
.
.
.
.
.
.
.
.
.
.
.
.
.
.
.
.
.
.
.
.
.
.
.
.
.
.
.
.
.
.
.
.
.
.
.
.
.
.
.
.
.
.
.
.
.
.
.
.
.
.
.
.
.
.
.
.
.
.
.
.
.
.
.
.
.
.
.
27
28
28
29
29
29
29
30
32
32
33
37
37
39
39
39
v
.
.
.
.
.
.
.
.
.
.
.
.
.
.
.
.
.
.
.
.
.
.
.
.
.
.
.
.
.
.
.
.
.
.
.
.
.
.
.
.
.
.
.
.
.
.
.
.
.
.
.
.
.
.
.
.
.
.
.
.
.
.
.
.
.
.
.
.
.
.
.
.
.
.
.
.
.
.
.
.
.
.
.
.
.
.
.
.
.
.
.
.
.
.
.
.
.
.
.
.
.
.
.
.
.
.
.
.
.
.
.
.
.
.
.
.
.
.
.
.
.
.
.
.
.
.
.
.
.
.
.
.
.
.
.
.
.
.
.
.
.
.
.
.
.
.
.
.
.
.
.
.
.
.
.
.
.
.
.
.
.
.
.
.
.
.
.
.
.
.
.
.
.
.
.
.
.
.
.
.
.
.
.
.
.
.
.
.
.
.
.
.
.
.
.
.
.
.
.
.
.
.
.
.
.
.
.
.
.
.
.
.
.
.
.
.
.
.
.
.
.
.
.
.
.
.
.
.
.
.
.
.
.
.
.
.
.
.
.
.
.
.
.
.
.
.
.
.
.
.
.
.
.
.
.
.
.
.
.
.
.
.
.
.
.
.
.
.
.
.
.
.
.
.
.
.
.
.
.
.
.
.
.
.
.
.
.
.
.
.
.
.
.
.
.
.
.
.
.
.
.
.
.
.
.
.
.
.
.
.
.
.
.
.
.
.
.
.
.
.
.
.
.
.
.
.
.
.
.
.
.
.
.
.
.
.
.
.
.
.
.
.
.
.
.
.
.
.
.
.
.
.
.
.
.
.
.
.
.
.
.
.
.
.
.
.
.
.
.
.
.
.
.
.
.
.
.
.
.
.
.
.
.
.
.
.
.
.
.
.
.
.
.
.
.
.
.
.
.
.
.
.
.
.
.
.
.
.
.
.
.
.
.
.
.
.
.
.
.
.
.
.
.
.
.
.
.
.
.
.
.
.
.
.
.
.
.
.
.
.
.
.
.
.
.
.
.
.
.
.
.
.
.
.
.
.
.
.
.
.
.
.
.
.
.
.
.
.
.
.
.
.
.
.
.
.
.
.
.
.
.
.
.
.
.
.
.
Investigating the cores of fossil systems with Chandra
6.1 Introduction . . . . . . . . . . . . . . . . . . . . . . .
6.2 Data and analysis . . . . . . . . . . . . . . . . . . . .
6.2.1 Sample . . . . . . . . . . . . . . . . . . . . .
6.2.2 Basic data reduction . . . . . . . . . . . . . .
6.2.3 Cool-core analysis . . . . . . . . . . . . . . .
6.3 Results and discussion . . . . . . . . . . . . . . . . .
6.3.1 Cool-core properties . . . . . . . . . . . . . .
6.3.2 EP-BCG/EP-EWC separation . . . . . . . . .
6.3.3 Temperature profiles . . . . . . . . . . . . . .
6.3.4 Potential emission from the BCG . . . . . . .
6.3.5 Deprojection analysis of z < 0.05 fossils . . . .
6.3.6 LX –T relation for 400d fossil systems . . . . .
6.3.7 Discussion . . . . . . . . . . . . . . . . . . .
6.4 Summary . . . . . . . . . . . . . . . . . . . . . . . .
.
.
.
.
.
.
.
.
.
.
.
.
.
.
.
.
.
.
.
.
.
.
.
.
.
.
.
.
.
.
.
.
.
.
.
.
.
.
.
.
.
.
.
.
.
.
.
.
.
.
.
.
.
.
.
.
.
.
.
.
.
.
.
.
.
.
.
.
.
.
.
.
.
.
.
.
.
.
.
.
.
.
.
.
.
.
.
.
.
.
.
.
.
.
.
.
.
.
.
.
.
.
.
.
.
.
.
.
.
.
.
.
.
.
.
.
.
.
.
.
.
.
.
.
.
.
.
.
.
.
.
.
.
.
.
.
.
.
.
.
.
.
.
.
.
.
.
.
.
.
.
.
.
.
.
.
.
.
.
.
.
.
.
.
.
.
.
.
.
.
.
.
.
.
.
.
.
.
.
.
.
.
.
.
.
.
.
.
.
.
.
.
.
.
.
.
.
.
.
.
.
.
.
.
.
.
.
.
.
.
.
.
.
.
.
.
.
.
.
.
.
.
.
.
.
.
.
.
.
.
.
.
.
.
.
.
.
.
4.3
4.4
4.5
5
6
vi
4.2.3 Surface brightness profiles and density profiles
4.2.4 Cooling times and central entropies . . . . . .
4.2.5 Radio data and analysis . . . . . . . . . . . . .
4.2.6 BCG data and analysis . . . . . . . . . . . . .
Results . . . . . . . . . . . . . . . . . . . . . . . . . .
4.3.1 Cool-core and non-cool-core fraction . . . . .
4.3.2 Temperature profiles . . . . . . . . . . . . . .
4.3.3 Central entropy K0 . . . . . . . . . . . . . . .
4.3.4 Radio properties . . . . . . . . . . . . . . . .
4.3.5 BCG properties . . . . . . . . . . . . . . . . .
Discussion of results . . . . . . . . . . . . . . . . . .
4.4.1 Cool-core fraction and physical properties . . .
4.4.2 Temperature profiles . . . . . . . . . . . . . .
4.4.3 AGN activity . . . . . . . . . . . . . . . . . .
4.4.4 BCG and cluster properties . . . . . . . . . . .
4.4.5 The role of star formation . . . . . . . . . . .
Summary and conclusions . . . . . . . . . . . . . . .
Extending the Lx–T relation from clusters to groups
5.1 Introduction . . . . . . . . . . . . . . . . . . . . . .
5.2 Data and analysis . . . . . . . . . . . . . . . . . . .
5.2.1 Sample and previous work . . . . . . . . . .
5.2.2 Temperatures and luminosities . . . . . . . .
5.2.3 Bias correction . . . . . . . . . . . . . . . .
5.2.4 Cluster comparison sample . . . . . . . . . .
5.3 Results and discussion . . . . . . . . . . . . . . . .
5.3.1 Observed, bias-uncorrected LX –T relation . .
5.3.2 Bias-corrected LX –T relation . . . . . . . . .
5.3.3 A complete picture of the LX –T relation . . .
5.4 Summary . . . . . . . . . . . . . . . . . . . . . . .
40
41
42
43
43
43
43
46
46
47
50
50
52
53
55
56
57
61
61
62
62
63
66
66
67
67
68
70
71
73
73
74
74
75
77
78
78
79
80
80
81
83
85
87
7
Complete Summary
7.1 Summary of results . . . . . . . . . . . . . . . . . . . . . . . . . . . . . . . . . . . .
7.2 Outlook . . . . . . . . . . . . . . . . . . . . . . . . . . . . . . . . . . . . . . . . . .
7.2.1 eROSITA outlook on the gas mass in galaxy clusters . . . . . . . . . . . . . .
89
89
90
91
A Calculation of scatter for LX –LBCG and M500 –LBCG scaling relations
97
B Temperature profiles of the galaxy group sample in Chapter 4
99
C Temperature profiles of the fossil systems in Chapter 6
103
D NVSS radio contours on optical images for some groups in Chapter 4
105
Bibliography
117
Acknowledgements
127
vii
CHAPTER
1
Introduction
It would not be an exaggeration to state that the current decade is the golden age of precision cosmology.
This is largely due to a multitude of missions/telescopes in different stages of planning and execution,
which will offer unparalleled multi-wavelength coverage to researchers. The most recent one, namely
the Planck mission (Planck Collaboration et al. 2014a), has managed to constrain the cosmological
parameters to a very high level of precision, albeit some of the numbers are in tension with results
from previous studies (e.g. the value of the Hubble constant H0 and the matter density parameter ΩM ,
Planck Collaboration et al. 2014b). Complementary to Planck will be two upcoming missions, namely
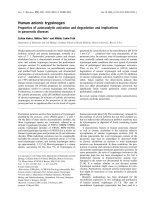
eROSITA and Euclid (Predehl et al. 2010; Laureijs et al. 2011 respectively, Fig. 1.1), which will try
to understand dark energy, that is considered to comprise 68% of the energy content of the Universe
(Planck Collaboration et al. 2014b). Both Euclid and eROSITA are stage-IV dark energy missions as
illustrated by the dark energy task force (Albrecht et al. 2006) and would be the next step after Planck
in space-based cosmological missions. For X-ray astronomers, the eROSITA instrument is undoubtedly
one of the most exciting X-ray missions in the next decade along with other missions such as the USA’s
NuSTAR (Harrison et al. 2013), and Japan’s Astro-H (Takahashi et al. 2014). eROSITA is slated to
perform only the second ever imaging all-sky survey in the X-ray wavelength, with the fundamental aim
of detecting close to 105 galaxy clusters, and constrain the dark energy equation of state (e.g. Merloni
et al. 2012).
With their complex structure consisting of galaxies, hot X-ray emitting gas (collectively called “baryons”), and dark matter, galaxy clusters are excellent laboratories for both cosmologists and astrophysicists. Cosmologists are keen on investigating their masses and distribution to constrain the large-scale
structure of the Universe, and to throw light on the fraction of dark matter and dark energy (e.g. Reiprich
2006; Vikhlinin et al. 2009b). Astrophysicists on the other hand, are investigating complicated baryonic
physics and answering questions such as how the X-ray emitting gas on the kiloparsec scale interacts
with a supermassive black hole on the parsec level (e.g. Churazov et al. 2002). It would not be a far
stretch to say that the study of galaxy clusters in the next decade with the latest and best instruments,
both ground and space-based, across wavelengths, will probably consolidate our understanding of the
Universe like never before. Though not very obvious, understanding baryonic physics via X-rays is
absolutely important for cluster cosmology. Survey telescopes like eROSITA will not have enough
cluster X-ray photons to constrain physical properties such as the mass and the temperature of the hot
X-ray emitting gas of the galaxy cluster directly, making one dependent on observable proxies such as
the X-ray luminosity, and correlations (i.e. scaling relations) to constrain these physical properties. To
1
1 Introduction
Figure 1.1: Left: Artist rendition of the Euclid telescope (optical). Figure credit; ESA-C. Carreau. Right: Artist
rendition of the eROSITA telescope (X-rays). Figure credit; eROSITA consortium. Both missions are survey
missions that have the primary science objective of understanding the mysterious dark energy.
ensure that the observable is a good descriptor of the underlying physical properties, one will have to
understand the gas physics at play in clusters, as these physics makes scaling relations deviate from
simple theoretical expectations. Several unanswered questions abound in baryonic physics such as:
What is the role of intracluster medium (ICM) cooling and feedback from supermassive black holes in
the cores of clusters? What happens to the X-ray gas in the outermost regions of these massive objects?
Why do X-ray scaling relations deviate from self-similarity? Is there a similarity break between the
high-mass “clusters” and the low-mass “groups”? Each of these questions is directly interesting to an
astrophysicist, and their implications on cosmological studies of clusters makes them also relevant for
cosmologists. With the first data set of the eROSITA all-sky survey to arrive within the next three years,
it is important to answer many, if not most of these questions as soon as possible with existing data sets,
which would ensure that observable proxies can be used with accuracy on the survey data to constrain
the physical properties and cosmological parameters thereon.
Theoretical and observational results indicate that most galaxy clusters are in the low-mass regime
(e.g. Tinker et al. 2008) and are accorded the nomenclature “galaxy groups”. In recent years, galaxy
group studies have gained traction, albeit still not to the extent of galaxy clusters. Indeed, a simple
astrophysics data system (ADS)1 abstract search shows that searching “galaxy clusters” and “galaxy
groups” yields entries which are lower by almost a factor of 8 for the latter, though admittedly this is
not corrected for overlapping studies. Observationally, galaxy groups are not as easy to explore as highmass clusters in X-rays due to their low surface brightness and the expected impact of gravitational and
non-gravitational processes on their structure. Thus, despite being much more numerous than high-mass
clusters, using them for precision cosmology studies has still not been explored in detail. This should
however not be seen as a drawback, but as an opportunity to do more work on the low-mass regime,
particularly in X-rays. This dissertation is one such attempt, where we explore in detail certain X-ray
properties of galaxy groups, their impact on scaling relations, and also provide a brief outlook for the
upcoming eROSITA all-sky survey. Presented mostly as a collection of research papers of which I have
been the lead author, this dissertation presents results from independent scientific investigations with the
underlying theme of understanding the X-ray properties of galaxy groups and fossil systems in detail.
The organisation of this dissertation is as follows: Chapter 2 presents a theoretical background on the
subject matter and brings the reader up to speed with the requisite knowledge for understanding the sci1
2
/>
entific results in subsequent chapters. Chapter 3 discusses X-ray astronomy in general, with a focused
look into the Chandra X-ray telescope, and a brief overview of eROSITA. Chapter 4 discusses ICM cooling, AGN feedback and BCG properties of galaxy groups and results thereof. Chapter 5 presents the
impact of ICM cooling, AGN feedback and selection effects on the X-ray luminosity (LX ) and temperature (T ) scaling relation for galaxy groups, and comparisons to the scaling relation for clusters. Chapter
6 looks into some properties of fossil systems, an interesting sub-class of clusters/groups, and focuses
mainly on their core properties. Chapter 7 is a detailed summary of all the scientific investigations
conducted in this dissertation, and also provides an outlook for potential future studies. Preliminary
results of a pilot study on estimating gas masses from the upcoming eROSITA all-sky survey are also
presented.
3
CHAPTER
2
Theoretical background
2.1 Galaxy groups and clusters
With masses between 1013 –1015 solar masses (M ), galaxy groups/clusters are the largest gravitationally
bound objects in the Universe. The choice of nomenclature is a natural one, as these systems are
essentially an aggregation of galaxies bound by gravity. This is a very simplistic definition however,
as galaxies form only a part of the total mass and in reality these are much more complex systems
than originally envisioned. The distribution of matter within galaxy clusters and groups is organised as
follows:
• Galaxies which number from as few as 4-5 to a few 1000.
• Hot X-ray emitting gas known as the intracluster medium (ICM) which has a temperature of
around 107 K. The ICM is generally the dominant baryonic component in clusters.
• Dark matter accounts for roughly 80% of the total mass of the cluster and is the dominant source
of the gravitational potential in clusters.
• Relativistic particles with velocities comparable to the speed of light.
2.1.1 Galaxy groups
Typically when galaxy clusters contain few 10s of galaxies, they are called as galaxy groups to represent
a smaller aggregation of galaxies. Alternatively, one could classify clusters with total masses less than
1014 M or with ICM temperatures below 2 keV as galaxy groups (e.g. Stott et al. 2012). Generally, the
low mass/low temperature objects have fewer galaxies and vice-versa, but this is not always true. Fossil
groups of galaxies (Ponman et al. 1994) for instance, could have high masses and temperatures, but low
optical richness1 .
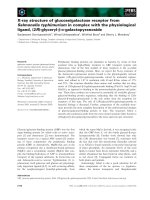
The shape of the galaxy cluster mass function, i.e. the number density of clusters as a function of
mass (e.g. Tinker et al. 2008), shows that most galaxies in the universe are organised in low-mass
groups, making them far more numerous than high-mass clusters (Fig. 2.1). Moreover, due to their shallower gravitational potential, they are expected to be much more strongly affected by processes such as
mergers, feedback from supermassive black holes (SMBH), and galactic winds. The plethora of these
1
richness is a measure of the number of galaxies in a cluster/group, see Sec. 2.2
5
2 Theoretical background
objects, and the impact of gravitational and non-gravitational effects on them (particularly in X-rays),
make galaxy groups potentially excellent cosmological and astrophysical laboratories, sometimes more
so than their high-mass counterparts. On a practical note, however, given their low masses, low-surface
brightness (especially in X-rays), and low optical richness, galaxy groups provide a rather strong observational challenge for scientists. Even on the theoretical side, the impact of baryonic2 physics on
global properties is hard to simulate as the details of many processes are poorly understood. Throughout this dissertation, important similarities and differences between galaxy clusters and groups will be
highlighted and explained as and when relevant.
2.2 Cluster galaxies
When observed in the optical wavelength, galaxy clusters appear as an overdensity of galaxies. Most
galaxies in the Universe are not isolated but aggregated into clusters/groups, but as mentioned above they
comprise a very small fraction of the mass (< 5%) for rich clusters (e.g. Fukugita et al. 1998). Galaxy
groups however, could have up-to 20% of their mass in the cluster galaxies (e.g. Schindler 2004). The
term optical richness is used to quantify the number of galaxies associated with the cluster. An optically
“rich” cluster would have more than 100 galaxies, while an optically “poor” cluster would have less
than 50 galaxies. A more formal usage of richness was provided by Abell 1958 to identify and classify
clusters into the famous Abell catalogue. In that catalogue, richness classes varying from 0 (< 50
galaxies) to 5 (> 300 galaxies) were used to identify and classify potential galaxy clusters. Note that, at
times cluster membership can be contentious due to strong projection effects making it highly imperative
to estimate velocities and redshifts for galaxies which accurately determines cluster membership. The
most accurate method to measure redshifts is to obtain the spectra of the galaxy and compare the spectral
lines of the object to the rest-frame predictions (Fig. 2.2). This is however rather time consuming and
is difficult for surveys where hundreds of thousands of galaxies are observed. A less resource-intensive
method to measure redshifts is to use photometry, wherein the measurement of the flux of the object
through different filters gives an estimation of the redshift of the object (e.g. Koester et al. 2007). The
errors on photometric redshifts at times however are substantially larger than spectroscopic redshifts
(e.g. Bolzonella et al. 2000).
The luminosity distribution of the galaxies in a cluster can be well described by the Schechter luminosity function (Schechter 1976) as follows:
n(L) =
N∗
L∗
L
L∗
−α
exp −
L
L∗
(2.1)
where L∗ is a characteristic luminosity of the galaxies and N ∗ is a normalisation (∼ 10−2 h3 Mpc−3 ) for
L∗ . The powerlaw index α varies from 0.8 to 1.3. The function demonstrates that the number of galaxies
decreases for increasing luminosity, i.e. there are more galaxies of a lower luminosity than a higher one
(Fig. 2.3).
Most galaxies in clusters are elliptical E and lenticular i.e. S0 type (Dressler 1980, 1984; Oemler
1992). In the centres of most relaxed clusters are massive galaxies which are generally the brightest
galaxy in the system and are thus assigned the nomenclature BCG—brightest cluster galaxy. These
are usually supergiant ellipticals (cD type in the Yerkes galaxy classification system, Fig. 2.4), have
an extremely extended outer envelope, and are thought to be the remnants of the mergers of smaller
galaxies into a larger one (e.g. Dubinski 1998). Despite consisting of older, more “red” stars, the BCGs
2
6
Baryons in this context always refers to the intracluster medium and galaxies
2.2 Cluster galaxies
ΩM = 0.25, ΩΛ = 0.75, h = 0.72
N(>M), h−3 Mpc−3
10−5
10−6
10−7
10−8
10−9
z = 0.025 − 0.25
z = 0.55 − 0.90
1014
1015
ΩM = 0.25, ΩΛ = 0, h = 0.72
10−5
N(>M), h−3 Mpc−3
M500 , h−1 M⊙
10−6
10−7
10−8
10−9
z = 0.025 − 0.25
z = 0.55 − 0.90
1014
M500 , h−1 M⊙
1015
Figure 2.1: Predicted galaxy cluster mass function (number density of clusters as a function of mass) for two
samples of clusters in two different redshifts, and for different cosmological parameters, plotted with data points
from the Chandra observations. The plot also indicates the sensitivity of the choice of cosmological model on the
mass function. From Vikhlinin et al. (2009b).
7
2 Theoretical background
Figure 2.2: Simple pictorial representation of redshift. Notice that greater the distance of the object from us, more
is the spectral line shifted to the right, i.e. the red part. Figure from />
Figure 2.3: Left: Schechter luminosity function (Schechter 1976). The plot shows that the number of galaxies
increases toward the lower brightness end. Right: A cartoon by Bingelli (1987) which shows that the original
luminosity function does not quite explain the details on why it has this form.
8
2.3 Dark matter
Figure 2.4: The supergiant elliptical (cD) galaxy M87, which is located at the centre of the Virgo cluster. This
galaxy is actually the second brightest one in this galaxy cluster consisting of ∼ 1000 galaxies. Image credit:
Anglo-Australian observatory.
in some cooling flow clusters (Sect. 2.6) show traces of recent star formation (e.g. Hicks et al. 2010)
which can be estimated e.g. through Hα spectra (Kennicutt 1998).
2.3 Dark matter
The dominant mass in a galaxy cluster is in the invisible matter known as dark matter. Dark matter does
not emit any electromagnetic radiation and its effect on baryonic matter can only be estimated through
gravitational interaction. Zwicky (1933) was the first to postulate the existence of an invisible matter in
galaxy clusters, when he concluded that the high mass-to-light ratio in the Coma cluster of galaxies could
not be explained by just the galaxies3 . One of the biggest outstanding questions in astrophysics today
is the nature of dark matter itself, with weakly interacting massive particles (WIMPs) being the prime
candidate (e.g. Blumenthal et al. 1984) over baryonic possibilities such as massive compact halo objects
(MACHOs, Griest 1991) and robust association of massive baryonic objects (RAMBOs, Moore & Silk
1995). In order to study dark matter, astronomers exploit its gravitational potential via gravitational
lensing. Some details are presented in the next section.
2.3.1 Gravitational lensing
When light from a distant object (e.g. galaxy) travels to us, it is affected by the gravitational field of
an intermediate mass distribution (e.g. galaxy cluster) and gets deflected, hence the name gravitational
lensing (Fig. 2.5). Gravitational lensing can be broadly classified into two types, strong and weak lensing. Strong lensing results in multiple images and arcs of the background galaxies (Fig. 2.6). Weak
lensing, as the name suggests, is a much weaker effect and results in weak magnification (convergence)
and elliptical distortions (shear) of the images of background galaxies by the foreground mass distributions. Note that background galaxies have an intrinsic ellipticity called “shape noise” which needs to be
accounted for when measuring the lensing shear (Fig. 2.7).
The major advantage of gravitational lensing for determining the total mass distribution in galaxy
clusters is the lack of any strong assumptions such as hydrostatic equilibrium, which is generally considered for other methods such as X-rays. Moreover, considering that the lensing effect is agnostic to the
3
Though at that time the ICM was not know, and some of the missing matter is in the hot X-ray gas
9
2 Theoretical background
Figure 2.5: Ray geometry of gravitational lensing. S represents the source (background galaxy), L the lens (foreground cluster), and O is the observer. Dd , Ds , Dds are the respective distances (angular diameter distances).
Figure credit: />
Figure 2.6: The galaxy cluster Abell 2218. The arcs visible in the image are background galaxies which are lensed
by the foreground galaxy cluster. Image credit: NASA, ESA, A. Fruchter and the ERO Team (STScI, ST-ECF)
nature of the matter in the cluster, and X-rays map out only the dominant baryonic component, a combined lensing/X-ray analysis, can accurately map out the total baryonic and non-baryonic composition
of the cluster. Such a combined analysis has provided one of the strongest astronomical evidences for
dark matter, namely the famous bullet cluster (Markevitch et al. 2002). Fig. 2.8 shows the bullet cluster
with the projected mass distribution (from lensing) overlaid with the distribution of the hot X-ray gas.
The high significance of the spatial offset of the centre of the total mass of the object from the centre of
the baryonic mass peaks is a clear indicator of the presence of dark matter (Clowe et al. 2006).
2.4 The intracluster medium
The intracluster medium (ICM) is a highly rarefied plasma with densities typically between 10−4 –
10−1 cm−3 , temperatures between 1 and 10 keV, and highly luminous in the X-ray band with bolometric
luminosities between 1043 –1045 erg/s. It comprises up to 20% of the total matter in the cluster and
is the dominant baryonic component in high-mass clusters, which however, is not necessarily true for
low-mass groups (Schindler 2004; Giodini et al. 2009). The origin of the gas is still somewhat unclear,
though the presence of heavy elements makes it unlikely that the gas is purely primordial. A possibility
is that the gas bound to the individual galaxies which had been metal-enriched by the supernovae within
the galaxies (Arnaud et al. 1992), was stripped from the galaxy as it fell into the cluster potential well
(e.g. Schindler 2004). The most widely accepted mechanism for the stripping of the gas in the galaxy
is ram-pressure stripping (Gunn & Gott 1972), which is essentially the stripping of the gas caused by
the pressure exerted on the galaxy as it moves through the fluid ICM. Another possibility is galactic
10
2.4 The intracluster medium
Figure 2.7: An over-simplified pictorial representation of weak lensing. The top left image shows circular unlensed “sources”, while the top right image shows the effect of a foreground mass distribution on the images
of these sources. Notice the distortion on the sources into elliptical shapes. The bottom left image shows
a more “realistic” distribution of galaxies with an intrinsic ellipticity and the effect of lensing is seen on the
right. Figure credit: />svg/400px-Shapenoise.svg.png
11
2 Theoretical background
Figure 2.8: The galaxy cluster IE0657-56, a.k.a., the bullet cluster. The weak lensing mass distribution is shown
in blue and the X-ray emission is shown in red. The spatial offset of the two components provides a strong
indication for dark matter. Image credit: NASA/CXC/CfA/M.Markevitch et al. for X-ray image, NASA/STScI;
ESO WFI; Magellan/U.Arizona/D.Clowe et al. for lensing map, NASA/STScI; Magellan/U.Arizona/D.Clowe et
al. for optical image
winds, which is argued as a better alternative to ram-pressure stripping to explain the nearly constant
metallicity observed at the virial radii for some objects (e.g. Fujita et al. 2008; Werner et al. 2013).
The ICM can be studied via two different techniques, namely through the Sunyaev-Zeldovich (SZ)
effect and through X-ray observations.
2.4.1 Studying the ICM using the Sunyaev-Zeldovich effect
The cosmic microwave background (CMB) is used to signify photons from an era of the Universe when
the photons decoupled from primordial matter and are visible at the present epoch in the millimetre
wavelength in the entire sky (Fig. 2.9). As these photons travel to the observer, they pass through galaxy
clusters and experience inverse Compton (IC) scattering by the electrons of the ICM and this is referred
to as the Sunyaev-Zeldovich effect (Sunyaev & Zeldovich 1972). This IC scattering is visible as a
decrease in the CMB intensity below 218 GHz and an increase in intensity above it (Fig. 2.10). The
signal arising due to the Sunyaev-Zeldovich effect is redshift independent making it an excellent tool in
discovering high-redshift clusters (e.g. Birkinshaw 1999; Carlstrom et al. 2002). However, it is strongly
dependent on the mass of the object (e.g. Motl et al. 2005) making it difficult to discover and study
low-mass groups with this method.
2.4.2 ICM in X-rays
Given their high temperatures, the primary wavelength to observe and study the ICM are X-ray wavelengths.
There are two main emission processes, namely thermal Bremsstrahlung and line emission which characterise the X-ray spectrum of the ICM (Fig. 2.11).
In order to understand the emission processes more clearly, we need to define some common terminology such as flux, luminosity and emissivity.
12
2.4 The intracluster medium
Figure 2.9: Temperature fluctuations of the cosmic microwave background as observed by the WMAP satellite.
Image credit: NASA/WMAP.
Figure 2.10: Example of the Sunyaev-Zeldovich effect for the cluster Abell 2163. There is a decrease in the CMB
intensity below 218 GHz and an increase above it. The dashed and dotted lines represent the thermal and kinetic
SZ effect respectively, with the solid line representing the combined effect. Figure credit: Carlstrom et al. (2002).
13
2 Theoretical background
Figure 2.11: Typical spectra for the ICM of a galaxy cluster (Bremsstrahlung with line emission). Black, red, and
green correspond to objects with temperatures of 1 keV, 3 keV, and 9 keV respectively. As the temperature of the
cluster increases, the Bremsstrahlung cut-off moves to higher energies. Figure credit: Reiprich et al. (2013).
Terminology in X-rays
The amount of energy (dE) per area (dA) per time (dt) interval is defined as the X-ray flux ( fX ) of the
object. As is the convention in X-ray astronomy, in CGS units the flux would be expressed in erg/s/cm2 .
The X-ray luminosity (LX ) i.e., the energy emitted per unit time (erg/s in CGS units) would then be
defined as:
LX = 4π fX d2 ,
(2.2)
where d is the distance to the object. It must be noted that in cosmological scales, this distance is the
luminosity distance (DL ).
The emissivity is the energy per unit time per volume, or expressed mathematically:
=
dLX
,
dV
(2.3)
where V is the volume. takes the units erg/s/cm3 in CGS units.
When one wishes to talk about a specific emission process, the emissivity can be defined as a function
of frequency, i.e. ν = dLX /dV/dν.
Mathematical formalism of X-ray emission of the ICM
Broadly speaking, one can define the emission from the ICM, which is collisionally ionised, in two
different temperature ranges, above and below 2 keV. The dominant emission process differs in both
cases. For ICM temperatures above 2 keV it is thermal Bremsstrahlung. The emissivity for this emission
can be expressed as follows:
We start with the assumption that the electrons are in thermal equilibrium in the ICM and that it
14
2.4 The intracluster medium
Figure 2.12: Bremsstrahlung spectra as a function of temperature for an optically thin plasma. Once again, black,
red, and green correspond to objects with temperatures of 1 keV, 3 keV, and 9 keV respectively. For higher
energies, the exponential cut-off moves to higher energies. Here, the densities are kept constant for all three
temperatures. Figure credit: />
follows a Maxwell-Boltzmann distribution, i.e.
f (v) =
m
2kT
3
4πv2 exp
−mv2
,
2kT
(2.4)
where v is velocity and m is mass of the particle, T is the thermodynamic temperature and k is the
Boltzmann’s constant. Integrating over the velocity distribution and writing in terms of frequency ν,
one can express the emissivity as
1
ν
hν
= (6.8 × 10−38 )Z 2 ne ni gff (Z, T, ν)T − 2 e− kT ,
(2.5)
where ne and ni is the electron and ion number density, respectively, Z is the ion charge, and gff is the
gaunt factor, a correction for quantum mechanical effects.
Integrating over the entire frequency range, we get the total emissivity as
ff
=⇒
ff
1
∝ n2e T − 2
=⇒
∞
=
dν
(2.6)
e− kT dν
(2.7)
ν
0
∞
0
ff
hν
1
∝ n2e T 2 .
(2.8)
Thus, for Bremsstrahlung emission, the emissivity increases with increasing temperature and increasing
density (Fig. 2.12).
For temperatures below 2 keV, line emission dominates over Bremsstrahlung emission. In general,
15
2 Theoretical background
the most prominent line emission in ICM spectra is the Iron-L and Iron-K shell complexes at 1 and 6
keV, respectively (Fig. 2.11). The emissivity for plasmas of temperature below 2 keV as a function of
electron density and temperature can be roughly expressed as (e.g. Sutherland & Dopita 1993)
line
1
∝ n2e T − 2 .
(2.9)
Thus, at lower temperatures, the emissivity increases with decreasing temperature. This makes line
emission a crucial feature in the analysis of spectra of low-mass galaxy groups.
X-ray data of galaxy clusters gives an excellent insight into the density and temperature distribution
of the cluster. In the next two subsections this is presented in some detail.
2.4.3 Density and surface brightness profile of the ICM
The density of the X-ray emitting gas is closely related to the X-ray surface brightness of the galaxy
cluster which is demonstrated here. Starting from the radial galaxy density profile (ρgal ) and using the
King approximation for an isothermal sphere (King 1966, 1972)
r2
ρgal (r) = ρgal (0) 1 + 2
rc
− 32
,
(2.10)
where rc is the core radius. Further assuming that the gas is ideal, isothermal and in hydrostatic equilibrium, with the galaxies having an isotropic velocity dispersion, it follows (e.g. Cavaliere & FuscoFemiano 1976; Sarazin & Bahcall 1977; Sarazin 1986)
β
ρgas ∝ ρgal ,
(2.11)
where ρgas is the gas density, and β is the ratio of energy per unit mass in galaxies to the energy per unit
mass in gas
µmp σ2
.
(2.12)
kT
Here µ is the mean molecular weight, mp is the mass of the proton, σ is the velocity dispersion of the
cluster, T is the temperature of the gas. The gas density profile can be expressed as
β=
r2
ρgas (r) = ρgas (0) 1 + 2
rc
− 3β
2
.
(2.13)
As the gas density ρgas is proportional to the electron density ne one can write
r2
ne (r) = ne (0) 1 + 2
rc
− 3β
2
.
(2.14)
In a soft X-ray band such as the ROS AT band (0.1–2.4 keV), the emissivity for plasmas does not
strongly depend on temperature for ICM temperatures above 2 keV. Therefore, one can approximate the
above equation for emissivity
2
(2.15)
0.1−2.4keV ∝ ne .
16
2.4 The intracluster medium
The surface brightness of an extended source S X is defined as the flux ( fX ) per solid angle (Ω). Hence,
fX
Ω
(2.16)
LX
Ω 4πD2L
(2.17)
SX =
=⇒ S X =
=⇒ S X =
=⇒ S X =
A
dA
Ω
dV
V
(2.18)
Ω 4πD2L
∞
−∞
4πD2L
dl
.
(2.19)
(2.20)
Here, we assume there is no dependence of on A, and A can be expressed as Ω D2A , where DA is the
angular diameter distance. The equation can now be written as
SX =
Ω D2A
=⇒ S X =
∞
−∞
dl
(2.21)
4π Ω D2L
∞
D2A −∞ dl
.
4π D2L
(2.22)
DA and DL are related to each other through the redshift z as D2L = (1 + z)4 D2A . Hence, substituting it
in the above equation we get the following expression for S X :
SX =
∞
1
4π (1 + z)4
dl
(2.23)
−∞
Substituting for from Eq. (2.13), we get
∞
SX ∝
−∞
∞
n2e dl =⇒ S X ∝
1+
−∞
r2
rc2
−3β
dl.
(2.24)
Thus, the final expression for the surface brightness profile can be expressed as
SX
R2
= S X (0) 1 + 2
rc
−3β+ 12
,
(2.25)
where R is the projected distance from the centre of the cluster. As demonstrated, we see a clear relation
between the surface brightness profile and the density profile of the cluster, and hence, a good model
fit to the surface brightness profile can recover the density profile with reasonable accuracy. It must be
noted that the single beta model, though a good approximation at large radii, is not very good at fitting
data in the cores of the clusters. This is generally due to the presence of cooler X-ray gas in the centres
which has a higher density than gas in the other regions of the cluster (Fig. 2.13).
2.4.4 Temperature distribution of the ICM
The temperature of the ICM is determined by fitting models to the observed spectra (convolved with
the instrument response). Initially, the finite spatial and spectral resolution of X-ray telescopes meant
17