Model based controllers for blood glucose regulation in type i diabetics
Bạn đang xem bản rút gọn của tài liệu. Xem và tải ngay bản đầy đủ của tài liệu tại đây (1.38 MB, 111 trang )
MODEL BASED CONTROLLERS FOR BLOOD GLUCOSE REGULATION
IN TYPE I DIABETICS
YELCHURU RAMPRASAD
NATIONAL UNIVERSITY OF SINGAPORE
2004
MODEL BASED CONTROLLERS FOR BLOOD GLUCOSE REGULATION
IN TYPE I DIABETICS
YELCHURU RAMPRASAD
(B.Tech, National Institute of Technology, Warangal, India)
A THESIS SUBMITTED
FOR THE DEGREE OF MASTER OF ENGINEERING
DEPARTMENT OF CHEMICAL AND BIOMOLECULAR ENGINEERING
NATIONAL UNIVERSITY OF SINGAPORE
2004
ACKNOWLEDGEMENTS
I would like to express my deep gratitude to Prof. Rangaiah Gade Pandu and
Dr. Lakshminarayanan Samavedham for their constant support, encouragement,
motivation and guidance. I am very grateful to them for being patient and kind with
me during unproductive times. My special thanks to Prof. Rangaiah and Dr. Laksh for
the weekly meetings, which kept me always focused on the research.
Prof.
Rangaiah’s philosophy of “think carefully” and Dr. Laksh philosophy of “think
practically” have improved my abilities significantly. I would also like to thank Prof.
Rangaiah and Dr. Laksh for their kindness, humility and sense of humor. I enjoyed
discussing with them the technical topics and various other interesting issues.
I would like to thank Dr. Laksh, Prof. M.S. Chiu, Prof. Q.G. Wang and Prof. A.P. Loh
for teaching me the fundamentals of control and Prof. Rangaiah and Prof. I.A. Karimi
for educating me in the field of optimization. I would also wish to thank other
professors in the chemical and biomolecular engineering department who have
contributed, directly or indirectly, to this thesis. I am indebted to the National
University of Singapore for providing me the excellent research facilities and the
necessary financial support.
I will always relish the warmth and affection that I received from my present and past
colleagues Madhukar, Srinivas, Mranal, Murthy, Ganesh, Sudhakar, Naveens, Mohan,
Arul, Suresh, Abhijit, Manish, Biswajit, Lynn Sum, Prabhat, Dharmesh, Reddy,
Martin, Mukta, Ankush, Yasuki, Jai Li, Ye, Balaji, May Su, Rohit, Lalitha, Sumanth
and Ravi. Special words of gratitude to Madhukar for his support throughout my
research at NUS. The enlightening discussions that I had with Madhukar, Sudhakar,
Srinivas, Velu, Vijay, Reddy, Prabhat, Murthy, Mranal, Mohan, Ravi, Sumanth, Omar,
Sanjeev and Durga, are unforgettable memories that I carry along.
Equally cherishable moments are the long discussions on Indian politics, economics
and various enlightening discussions with Benarjee, Biswajit, Sudheer, Shantanu, and
Rohit in the canteen. My wonderful friends other than those mentioned above, to list
whose names would be endless, have been a great source of solace for me in times of
need besides the enjoyment they had given me in their company. I am immensely
thankful to all (my friends and my relatives) in making me feel at home in Singapore.
My endless gratitude to my parents for bestowing their support, love and affection,
and for immense trust they have placed on me. I am always indebted to my siblings
and cousin brothers for their encouragement, support, affectionate love and friendship.
Also I would like to thank some of my classmates, my seniors and juniors in REC
Warangal whose moral support helped me cruise through some of the tough times I
experienced in Singapore.
ii
TABLE OF CONTENTS
ACKNOWLEDGEMENTS
i
SUMMARY
v
NOMENCLATURE
viii
LIST OF FIGURES
xii
LIST OF TABLES
xvii
1. Introduction
1.1 Diabetes Mellitus
2
1.2 Modeling Literature
3
1.3 Control Literature
6
1.4 Motivation and Scope of the Work
10
1.5 Outline of the Thesis
14
2. Physiological Modeling of Diabetic
2.1 Introduction
15
2.2 Physiological Modeling
16
2.2.1 Compartmental Model
16
2.2.2 Uncertainty Description
22
2.3 Realization of Meal Model
24
2.4 Implementation of Diabetic model
27
2.5 Dynamics of Diabetic with Meal
31
2.6 Summary
32
3. Model based Control Strategies for Glucose Control in Type I Diabetics
3.1 Introduction
34
Table of Contents
3.2 Diabetic Model and Uncertainty Description
36
3.3 Synthesis of IMC and EIMC
41
3.4 Results and Discussion
44
3.5 Conclusions
52
4. Regulation of Glucose in Diabetics Using PID Controller
4.1 Introduction
53
4.2 Diabetic Model and Uncertainty Description
55
4.3 PID Controller Tuning
60
4.4 Results and Discussion
61
4.5 Conclusions
70
5. Input Output Linearization for Glucose Regulation in Type I Diabetics
5.1 Introduction
72
5.2 Synthesis of IOL Controller
72
5.3 Implementation of IOL controller for diabetic
76
5.4 Evaluation
78
5.5 Summary
81
6. Conclusions and Recommendations
6.1 Conclusions
82
6.2 Recommendations
84
References
85
APPENDIX
91
iv
SUMMARY
Diabetes is a chronic disease affecting millions of people in the world. Regular insulin
injection therapy is now practiced for maintaining blood glucose level within
normoglycemic range (70-100 mg/dl) in Type I diabetics having insulin dependent
diabetes mellitus. Controllers for automatic monitoring and regulation of blood
glucose in diabetics have been investigated. In this study, several model-based
controllers including the ubiquitous proportional-integral-derivative (PID) controllers
are designed for specifying insulin dosage in Type I diabetics. The study employs a
recently reported and detailed physiological model of a diabetic along with a meal
disturbance model. The performance and robustness of designed controllers are
evaluated on 577 diabetic patient models generated by considering ±40% variation in
the significant parameters of the physiological model.
The detailed physiological model of the diabetic is successfully implemented and
validated for use in evaluating the designed controllers. An internal model controller
(IMC) is designed based on a first order plus time delay (FOPTD) model
approximation of the detailed physiological model of the nominal diabetic. Enhanced
internal model controller (EIMC) is then developed due to its simple structure, better
disturbance attenuation and uncertainty reduction. Both these controllers are assessed
for their ability to track the normoglycemic set point of 81.1 mg/dl for blood glucose
while rejecting meal disturbances both in the nominal patient case and 577 perturbed
patient models. The results show that EIMC performs better than IMC as well as the
robust H∞ controller (Parker et al., 2000) for blood glucose regulation in Type I
diabetics.
Summary
Noting that the ubiquitous PID controllers have not been tested on the detailed
physiological model employed in this study, several PID controllers are designed
using classical and recent tuning techniques. A secondary objective for this part of the
study is to analyze the effectiveness of the recent tuning techniques for PID
controllers for challenging biomedical applications such as diabetes control. Detailed
results of testing the PID controllers designed on the perturbed patient models for
meal disturbance rejection, show that the PID tuning by Shen (2002) is the best
among the four tuning techniques tested. It is able to maintain the glucose
concentration above the hypoglycemic range (hypoglycemia occurs when blood
glucose concentration is less than 60 mg/dl) in 95% of all the 577 patient models
considered while rejecting both single and multiple meal disturbances in a day.
A nonlinear internal model controller (NIMC) using input-output linearization is
developed for a Type I diabetic. Although this controller showed promising results for
rejecting meal disturbances in the case of nominal patient model, spikes in the
controlled variable (i.e., insulin injected) made it impossible to test NIMC for all the
577 perturbed patient models. The reason for spikes seems to be numerical errors, and
further investigation is needed to confirm this.
In summary, several model based controllers (namely, IMC, EIMC, PID and NIMC)
are designed and evaluated for blood regulation in Type I diabetic. Among these,
EIMC and PID controller tuned by Shen's technique have performed better than the
robust H∞ controller which itself was shown to be better than the computationallyintensive model predictive controller (Parker et al., 2000). Considering this and the
vi
Summary
simplicity of EIMC and PID controller, it is concluded that these “simpler” controllers
may be an attractive alternative over the more complex controllers for glucose
regulation in Type I diabetics.
vii
NOMENCLATURE
Abbreviations
AIDA
automated insulin dosage advisor
C
controller
C1, C2
controllers in EIMC structure
C-C
cohen-coon
Chcrit
critical value of carbohydrates intake where gastric emptying functions
changes shape
DCCT
diabetes control and complications trial
DEE
differential equation editor
DMC
dynamic matrix control
e
error signal
EIMC
enhanced internal model control
ε
epsilon
FOPTD
first order plus time delay
g
gram
GA
genetic algorithm
G CH
arterial blood glucose concentration
i
suffix
IAE
integral absolute error
IMC
internal model control
IOL
input output linearization
ISE
integral squared error
ITAE
integral time averaged error
Kc
PID controller gain
Nomenclature
τi
integral time
τd
derivative time
KP
PID controller proportional gain coefficient
KI
PID controller integral coefficient
KD
PID controller derivative coefficient
L f h(x)
lie derivative of h(x) with respect to f(x)
L g L f h(x)
lie derivative of h(x) with respect to g(x) and f(x)
M
model
MPC
model predictive control
MPCSE
model predictive control with state estimation
MPCSPE
model predictive control with state and parameter estimation
NIMC
nonlinear internal model control
ode15s
stiff differential equation solver
P
process or proportional
PD
proportional-derivative
PI
proportional-integral
PID
proportional-integral-derivative
r
set point
Tascge
time of ascending part of gastric emptying function
Tdesge
time of descending part of gastric emptying funcition
Tmaxge
time of plateau of gastric emptying function
x
state variable
~
x
estimated state variable
y
output
Ysp(t)
set point of output variable as a function of time
ix
Nomenclature
Y(t)
output variable as a function of time
~y
estimated output
γ
relative order
α
constant
Diabetic Patient Model Variables:
A
auxiliary equation state (dimensionless) or hepatic artery
B
fractional clearance (I, dimensionless; N, L/min) or Brain
BU
brain uptake
C
capillary space
FHIC
fractional hepatic insulin clearance
FKIC
fractional kidney insulin clearance
FPIC
fractional peripheral insulin clearance
G
glucose concentration (mg/dl)
G
glucose
H
heart and lungs
HGP
hepatic glucose production
HGU
hepatic glucose uptake
I
insulin concentration (mU/L)
IHGP
insulin effect on HGP
IHGU
insulin effect on HGU
IVI
intravenous insulin infusion
K
kidney
KC
kidney clearance
KE
kidney excretion
x
Nomenclature
L
liver
LC
liver clearance
N
glucagons concentration (normalized)
NHGP
glucagons effect on HGP
P
periphery (muscle/adipose tissue)
PC
peripheral clearance
PGU
peripheral glucose uptake
PIR
pancreatic insulin release
PNC
pancreatic glucagons clearance
PNR
pancreatic glucagons release (normalized)
q
vascular blood flow rate (dL/min)
Q
vascular plasma flow rate (L/min)
RBCU
red blood cell uptake
S
gut (stomach/intestine)
SIA
insulin absorption into blood stream from subcutaneous depot
SU
gut uptake
T
tissue space or transcapillary diffusion time constant (min)
v
volume (dL)
V
volume (L)
Gempt, wf
gastric emptying function
λ
lambda
λ1 , λ 2
filter constants in EIMC
Г
metabolic source or sink rate (mg/min or mU/min)
xi
LIST OF FIGURES
Fig 1.1
Regulation of Blood Glucose by Insulin and Glucagon in a 2
Healthy Person
Fig 2.1
Compartmental diagram of the glucose and insulin systems in a 17
diabetic. The arrow indicates the direction of blood circulation.
Fig 2.2
General Representation of a Physiological Organ
17
Fig 2.3
The gastric emptying rate for carbohydrate ingestions of (a) 10 g 26
and (b) 50 g.
Fig 2.4
The glucose absorption into gut compartment for 10 g (dotted 26
curve) and 50 g (solid curve) carbohydrate meal ingestion
Fig 2.5(a)
Simulink implementation of diabetic model with DEE, meal 28
model and input-output scaling
Fig 2.5(b)
The differential equations editor with diabetic differential 28
equations, initial guesses and output equations
Fig 2.5(c)
Implementation of the meal model in Simulink using Matlab 29
function (Matlab Fcn) block
Fig 2.5(d)
The Matlab Fcn block for gastric emptying rate of meal 29
(equation 2.40)
Fig 2.5(e)
Input output scaling of insulin and blood plasma glucose 30
concentration
Fig 2.6
Response of some patient models to the step change in insulin to 31
0 mU/min: solid - nominal patient model; dot - response bounds
for ± 50% variations in EGHGP-EГ; dash-dot - response bounds
for the simultaneous ± 50% variations in EGHGP-EГ and EIPGUDГ
List of Figures
Fig 2.7
Transient response of blood plasma glucose concentration due to 32
50 g (solid curve) and 10 g carbohydrate (dashed curve) meal
ingestion
Fig 3.1
Response of some patient models to the step change in insulin to 39
0 mU/min: solid - nominal patient model; dot - response bounds
for ± 50% variations in EGHGP-EГ; dash-dot - response bounds
for simultaneous ± 50% variations in EGHGP-EГ and EIPGU-DГ.
Fig 3.2
Response of nonlinear (solid), 19th order linear (cross), 3rd order 40
linear (dash-dot), first order plus time delay (dot) models to ±5%
step changes in insulin from the nominal 22.3 mU/min.
Fig 3.3
Conventional IMC system.
41
Fig 3.4
Enhanced IMC structure.
43
Fig 3.5
The effect of increasing K in EIMC for a perturbed case with 47
EGHGP-EГ =1.4, EIPGU-DГ = -3.4927 and EGHGU-DГ = -0.88
with remaining parameters at their nominal values.
Fig 3.6
Transient responses of the EIMC for two perturbed patients 48
(giving the lowest and highest IAE) and the nominal case, in
attenuating
Fig 3.7
50 g meal disturbance at time t = 0 min.
Performance of EIMC (solid) and H∞ controller (dashed) of 49
Parker et al. (2000) including uncertainty weighting and
parametric uncertainty, on a perturbed patient model with
EIPGU-DГ = -8.15, EGHGU-DГ = -2.072, FHIC = 0.36 and the
xiii
List of Figures
remaining five parameters are at their nominal values.
Fig 3.8
Performance of EIMC (solid) and H∞ controller (dashed) of 50
Parker et al. (2000) including uncertainty weighting and
parametric uncertainty, on a perturbed patient model with
EIPGU-EГ = 0.6, EGHGU-EГ = 0.6, EGHGP-EГ = 1.4 and the
remaining five parameters are at their nominal values.
Fig 3.9
Transient responses of the EIMC for two perturbed patients 51
(giving the lowest and highest IAE) and the nominal case, in
attenuating four meals in a typical day
Fig 4.1
Response of some patient models to the step change in insulin to 58
0 mU/min: solid - nominal patient model; dot - response bounds
for ± 50% variations in EGHGP-EГ; dash-dot - response bounds
for the simultaneous ± 50% variations in EGHGP-EГ and
EIPGU-DГ.
Fig 4.2
Response of nonlinear (solid) and first order plus time delay (dot) 59
models to ± 5% step changes in insulin from the nominal 22.3
mU/min.
Fig 4.3
Performance of PID controllers tuned by four methods on the 62
nominal patient model in rejecting the 50 g meal disturbance at
time, t = 0 min.
xiv
List of Figures
Fig 4.4
Transient responses of PID controller with Shen tuning for two 65
perturbed patients (giving the lowest and highest IAE) and
the nominal case, in attenuating 50 g meal disturbance
at time, t = 0 min.
Fig 4.5
Performance of PID controller with Shen tuning (solid) and H∞ 66
controller
(dashed)
including
uncertainty
weighting
and
parametric uncertainty (Parker et al., 2000), on a perturbed patient
model with EIPGU-DГ = -8.15; EGHGU-DГ = -2.072, FHIC =
0.36 and the remaining five parameters are at their nominal
values.
Fig 4.6
Performance of PID controller with Shen tuning (solid) and H∞ 67
controller
(dashed)
including
uncertainty
weighting
and
parametric uncertainty (Parker et al., 2000), on a perturbed patient
with EIPGU-EГ = 0.6; EGHGU-EГ = 0.6, EGHGP-EГ = 1.4 and
the remaining five parameters are at their nominal values.
Fig 4.7
Transient responses of the PID controller with Shen tuning for 68
two perturbed patients (giving the lowest and highest IAE) and
the nominal case, in attenuating four meals in a typical day.
Fig 4.8
Transient response of PID controllers with three different values 70
of KP for a perturbed patient with parameters EGHGP-EГ = 1.4,
FHIC = 0.32, FPIC = 0.09 and rest of the parameters are at their
nominal values.
Fig 5.1(a)
Nonlinear controller with input output linearization
73
Fig 5.1(b)
Nonlinear Internal Model Control (NIMC) Structure
74
xv
List of Figures
Fig 5.2
Nonlinear controller in NIMC structure for the diabetic system.
76
Fig 5.3
The Matlab Fcn block for the implementation of nonlinear 77
controller with input output linearization technique
Fig 5.4
Transient response of the nominal diabetic patient in rejecting 10 78
g meal disturbance
Fig 5.5
Transient response of the nominal diabetic patient in rejecting 30 79
g meal disturbance
Fig 5.6
Transient response of the nominal diabetic patient in rejecting 50 80
g meal disturbance
xvi
LIST OF TABLES
Table 2.1
Values of the Parameter in the Diabetic Model.
21
Table 2.2
Nominal Values for Uncertain Parameters in Diabetic Patient 24
Model.
Table 3.1
Performance of IMC with various values of filter constant, for all 45
577 patients subjected to 50 g meal disturbance at time, t = 0.
Table 3.2
Effect of K on rejecting the 50 g meal disturbance by the EIMC 46
(with λ1 = λ2 = 5) for all 577 patients with lower limit of 0 mU/min
on insulin.
Table 4.1
The performance of PID controllers tuned by four methods, on the 62
nominal patient case in attenuating the 50 g meal disturbance.
Table 4.2
The performance of PID controllers tuned by the four methods on 64
the 577 patients in attenuating the 50 g meal disturbance.
Table 4.3
The performance of PID controllers tuned by Shen method but with 69
various values of KP on the 577 patients in attenuating the 50 g meal
disturbance.
xvii
CHAPTER 1
Introduction
At the interface between biological sciences and engineering disciplines can be found
an interesting set of problems most easily classified as biosystems. Further
subdivision of these systems yields problems addressing biomedical and biotechnical
issues. Biomedical is related to medicine or the human patient, whereas the
biotechnical issues deal with non-human or exvivo organisms. These biosystems offer
a challenging set of modeling and regulation problems to the biological, medical and
engineering communities. Biomedical problem of glucose regulation using different
control strategies in diabetes patients is the focus of this study.
Diabetes mellitus is a global, public health problem and a leading cause of morbidity
and mortality in many parts of the world. Diabetes is of two types, Type I & Type II.
Type 1 diabetes, formerly called juvenile diabetes or insulin dependent diabetes
mellitus (IDDM), is usually diagnosed in children, teenagers, or young adults. In Type
I diabetic, the glucose concentration is elevated beyond the normoglycemic range
(70-100 mg/dl) due to the insufficient insulin secretion from the β-cells of islets of
Langerhans present in the pancreas. Type 2 diabetes, formerly called adult-onset
diabetes or non insulin dependent diabetes mellitus (NIDDM), is the most common
form of diabetes. People can develop Type 2 diabetes at any age - even during
childhood. This form of diabetes usually begins with insulin resistance, a condition in
which fat, muscle and liver cells do not use insulin properly. The role of pancreas in
the healthy person for the regulation of the blood glucose levels is depicted in Fig. 1.1.
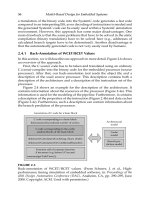
Chapter 1: Introduction
Fig. 1.1. Regulation of Blood Glucose by Insulin and Glucagon in a Healthy Person
As shown in Fig.1.1, the blood glucose level is regulated via two paths. Firstly when
the glucose levels falls due to physical activity (e.g. exercise), it stimulates α-cells of
pancreas which turn signals the liver to deliver the stored glucose (i.e. glucagon) into
the blood stream to maintain the glucose concentration in the normoglycemic range
(Glucose Concentration of 70-100 mg/dl). Secondly, when the blood glucose level
rises by meal intake, it stimulates the β-cells of pancreas to release insulin. Insulin
acts as a funnel for glucose to enter cells, and glucose is taken up by cells to return to
normoglycemic range. Malfunctioning of pancreas is the cause for diabetes. Due to
that, glucose level goes beyond the normoglycemic range in diabetics. In such patients,
monitoring the glucose level and administering insulin are vital. Present study is to
develop closed loop devices (referred as artificial β-cells) to mimic the action of
pancreas.
1.1 Diabetes Mellitus
The medical name for diabetes, diabetes mellitus, comes from words with Greek and
Latin roots. Diabetes comes from a Greek word that means to siphon. The most
2
Chapter 1: Introduction
obvious sign of diabetes is excessive urination. Water passes through the body of a
person with diabetes as if it were being siphoned from the mouth through the urinary
system out of the body. Mellitus comes from a Latin word that means sweet like
honey. The urine of a person with diabetes contains extra sugar (glucose) and tastes
as sweet like honey. Insulin is a hormone produced in the pancreas to regulate the
amount of sugar in the blood. In persons with diabetes, the pancreas produces no
insulin, too little insulin to control blood sugar or defective insulin.
The normal human body requires blood glucose concentrations of between 70 and 100
mg/dl (milligrams of glucose in 100 milliliters of blood), which is termed as
normoglycemic region in the medical literature. The condition of blood glucose
concentrations of below 60 mg/dl is termed ‘hypoglycemia’, and above 110 mg/dl
after 2 to 3 hours from eating a meal, is considered abnormal. Hypergylcaemia is a
condition when the blood glucose exceeds 180 mg/dl at any time. Blood sugar can
occasionally fall below 60 mg/dl and even to below 50 mg/dl and still not indicate a
serious abnormality or disease. Blood sugar levels below 45 mg/dl are almost always
associated with a serious abnormality.
1.2 Modeling Literature
Various models developed for the human glucose-insulin system in whole or in part,
are comprehensively reviewed by Parker (1999). Here, only the most relevant and
important works are briefly described. The first modeling study of the diabetic is the
work of Bolie (1961) who developed a two state linear model consisting of two
differential equations, one for glucose and other for insulin. A model with similar
structure was developed by Ackerman et al. (1965) for glucose-insulin dynamics in a
3
Chapter 1: Introduction
healthy person. Even though these models with two linear equations are
oversimplification of the physiological glucose and insulin effects, the interaction
effects of glucose and insulin were concluded from these studies. Primitive but
detailed physiological (organ-derived model divisions) structures were developed for
glucose dynamics (Tiran et al., 1975) and insulin dynamics (Tiran et al., 1979)
including nonlinear effects in the glucose metabolism. These models accounted for
the distribution of insulin and glucose throughout the body compared to the earlier
approaches of Bolie (1961) and Ackerman et al. (1965), but they were unable to
capture the threshold metabolic behavior of the physiological system.
Bergman et al. (1981) have developed a “minimal” model with three compartments as
a lumped representation of the human body. The underlying dynamics of the glucose
transport and distribution throughout the tissues were neglected by grouping these
effects into a few parameters. The effects of glucagon, which raises the blood glucose
concentration, were not accounted explicitly. Inadequacies of the “minimal” model
were demonstrated in the literature (Quon et al., 1994; Weber et al., 1989).
Cobelli et al. (1982) have studied the glucose and insulin modeling extensively. These
models utilized 5-compartment models for insulin, and glucose and glucagon effects,
each lumped into its own whole-body blood pool. These nonlinear models included
the use of threshold functions (hyperbolic tangents) to describe the saturation
behavior seen in biological sensing (e.g. hepatic glucose production). Validation of
these mathematical models with a case study on glucose regulation was performed
(Cobelli and Mari, 1983). Comparison of the peripheral versus portal route for insulin
administration in closed-loop glucose control was done by Cobelli and
4
Chapter 1: Introduction
Ruggeri (1983). In peripheral route, insulin is injected through subcutaneous tissue,
where as in portal route, it is administered through the vein. They found portal vein
insulin administration to diabetics accurately matches their glucose profiles to those
of healthy persons. However, models of Cobelli and co-workers were unable to
describe the glucose distribution throughout the body.
Puckett (1992) presented detailed modeling study of diabetes mellitus; the time scale
of interest was much larger than that for the equilibration of glucose and insulin
across the blood-tissue boundary, as determined from the blood perfusion data. In this
work, the body was modeled as a two-blood-pool system representing insulin and
glucose concentrations. The metabolic flux terms and exogenous signals directly
affected the blood pool concentrations. Nonlinear metabolic behavior of the glucose
insulin system was accounted, but the steady state compartmental representation
neglects any high-frequency dynamics within the patient. Inclusion of carrier
mechanism and diffusion pathways improved the accuracy of the glucose and insulin
removal from the bloodstream. Puckett and Lightfoot (1995) have demonstrated both
inter-and intrapatient variability (i.e. the differences in the dynamics of insulin and
glucose profiles in different patients and the same patient over time) and steady state
behavior by using their models. Variability is a challenging feature that needs to be
addressed in both modeling and control of diabetics.
A physiologically based compartmental model of glucose and insulin dynamics was
developed by Sorensen (1985), based on an earlier model by Guyton et al. (1978). In
this model, glucose and insulin are treated separately, with coupling through
metabolic effects utilizing threshold functions similar to those of Cobelli et al. (1982).
5
Chapter 1: Introduction
A lumped whole body representation for glucagon was included to complete the
glucose-insulin system with counter regulation. Parker (1999) modified the
Sorensen (1985) model to include meal disturbances as well as parameters for
uncertainty analysis. This complete model is described in Chapter 2, and is used for
the controller synthesis and analysis in the present study.
Lehmann and Deutsch (1992) developed a nonlinear model of glucose and insulin
kinetics within the diabetic. The glucose sub-model was a single compartment extra
cellular pool, from which glucose could be added or removed via metabolic processes
and meal consumption. A two-compartment model of insulin representing plasma and
“active” concentrations was developed. This “active” insulin compartment was
responsible for regulating insulin-dependent glucose uptake. A generalized meal
model was also developed by Lehmann and Deutsch (1992) as a trapezoidal
waveform representative of a relatively constant glucose supply to the gut during
carbohydrate absorption in series with a first order transfer function, which
approximated the absorption kinetics of glucose by the blood stream. This allowed
treatment of arbitrary meal sizes in disturbance rejection scenarios, which are highly
relevant to the diabetic modeling and control. This generalized meal model is
included in the diabetic model, as described in Chapter 2.
1.3 Control Literature
Several control algorithms were developed and studied for different models of
diabetic in the literature. These are comprehensively reviewed by Parker (1999) and
Parker et al. (2001). The earliest diabetes regulation work dates to the “BIOSTATOR”
algorithm and device of Clemens (1979). This feedback controller utilized a low
6