Photocatalytic treatment of wastewater contaminated with organic waste and heavy metal from semiconductor industry
Bạn đang xem bản rút gọn của tài liệu. Xem và tải ngay bản đầy đủ của tài liệu tại đây (937.4 KB, 88 trang )
PHOTOCATALYTIC TREATMENT OF WASTEWATER
CONTAMINATED WITH ORGANIC WASTE AND HEAVY
METAL FROM SEMICONDUCTOR INDUSTRY
ZOU SHUAIWEN
NATIONAL UNIVERSITY OF SINGAPORE
2004
PHOTOCATALYTIC TREATMENT OF WASTEWATER
CONTAMINATED WITH ORGANIC WASTE AND HEAVY
METAL FROM SEMICONDUCTOR INDUSTRY
ZOU SHUAIWEN
(B. Eng., Tsinghua University)
A THESIS SUBMITTED
FOR THE DEGREE OF MASTER OF ENGINEERING
DEPARTMENT OF CHEMICAL & BIOMOLECULAR
ENGINEERING
NATIONAL UNIVERSITY OF SINGAPORE
2004
ACKNOWLEDGEMENT
I would like to thank my supervisor, Dr. J. Paul Chen for his extensive guidance,
interests and helpful suggestions throughout the project.
I would also like to express my appreciation to my fellow postgraduate students, Mr
Sheng Pingxin and Mr Yanglei for many helpful discussions.
I would also like to acknowledge the National University of Singapore for funding
this research.
i
TABLE OF CONTENTS
Page
ACKNOWLEDGEMENTS
i
TABLE OF CONTENTS
ii
SUMMARY
v
NOMENCLATURE
vii
LIST OF FIGURES
viii
LIST OF TABLES
xi
CHAPTER 1 INTRODUCTION
1
1.1 Problem statement
1
1.2 Objectives
3
1.3 Organization of the thesis
4
CHAPTER 2 LITERATURE REVIEW
5
2.1 Background of wafer fabrication processes
5
2.2 Physical properties of UV light
7
2.3 Advanced oxidation process
10
2.4 Basic principles of the TiO2/UV process
13
2.5 Kinetic models
18
2.6 Effects of temperature
19
2.7 Effects of initial solution pH
19
2.8 Photocatalytic recovery of metals
20
ii
2.9 Effects of the electron donor on photocatalytic reductions
20
2.10 Role of oxygen
20
2.11 TiO2 as a stationary phase
22
2.12 Model of metal ion adsorption on TiO2 particles
23
CHAPTER 3 MATERIALS AND METHODOLOGY
26
3.1 Materials
26
3.2 Methodology
26
3.2.1 Photocatalysis reactor
26
3.2.2 Encapsulation equipment
28
3.2.3 Experimental procedure
29
3.3 Analysis
CHAPTER 4 RESULTS AND DISCUSSION
31
33
4.1 Adsorption of organic solvents on TiO2 suspensions
33
4.2 Turbidity
35
4.3 Effects of the TiO2 loading
36
4.4 Effects of initial solution pH
46
4.5 Effects of oxygen concentration
52
4.6 Effects of different brands of TiO2
53
4.7 Simultaneous removal of copper-organic waste
55
4.8 Effects of encapsulation of TiO2 as a photo-oxidant
66
iii
CHAPTER 5 CONCLUSIONS
70
REFERENCES
73
iv
SUMMARY
Treatment of dilute organic-copper wastewater discharged from semiconductor
manufacturing facilities using photocatalytic degradation mediated by illuminated TiO2
was investigated in this study. Two organic compounds of ethyl lactate and phenol and
copper ions were studied due to their common applications in various fabrication
processes as well as their seriously negative environmental impacts.
Photocatalytic experiments showed that the removal efficiency of ethyl lactate and
phenol were dependent on TiO2 catalyst loading, initial pH, oxygen concentration and
TiO2 catalyst properties. The optimal TiO2 dosage of 0.1 g/L and initial pH of 3.0 were
determined. The photocatalytic process had much better removal efficiency under pure
oxygen conditions.
Kinetic experiments on ethyl lactate and phenol photodegradation illustrated that the
photodegradation processes agreed with first-order rate reaction under the experimental
conditions in this study. It was found that the removal of ethyl lactate and phenol due to
adsorption onto TiO2 particles could be neglectable.
Simultaneous removal of the copper ions and two organic compounds was investigated
under aerobic and anaerobic conditions. Under aerobic conditions, oxygen inhibited
copper reduction and copper was removed through precipitation; while under anaerobic
conditions, it can be reduced to elemental Cu. The removal rate of copper and the rate of
v
reduction of ethyl lactate and phenol concentrations are lower than those in the aerobic
conditions.
It has been a major obstacle that TiO2 particles are difficult to separate from the treated
water stream due to their lower settling velocities. In order to overcome the problem, the
TiO2 particles were encapsulated by a novel electronic spraying technology. The spraying
involves extruding a liquid at a constant flow rate and subjecting the liquid to an electric
field. In this manner, a charge induced on the surface of the liquid results in a mutual
charge repulsion that disrupts the liquid surface, breaking it up into a charged stream of
fine droplets. By the technology, the encapsulated titanium dioxide with calcium alginate
was prepared. Such parameters as particle size and setting velocity were investigate in
this study. It was found the settling capacity of the encapsulated TiO2 was significantly
enhanced. More importantly the photo-oxidation properties of ethyl lactate and phenol by
the TiO2 were still maintained and the secondary organic pollution was negligible.
vi
NOMENCLATURE
Description
Symbol
c
light speed, m/s
λ
wavelength, m
v
frequency, Hz
h
Planck’s constant, J·s
E
photon energy, J
T
temperature, K
P
total energy emitted by source matter, W·cm-2
S
Stefan-Boltzmann constant, W·cm-2·K-4
K
Langmuir adsorption constant
t
reaction time, min
k
reaction rate constant, min-1
vii
LIST OF FIGURES
Figure
Title
Page
Figure 2.1
Flow diagram for a typical sequence of wafer fabrication
process
6
Figure 2.2
Electromagnetic Spectrum
9
Figure 2.3
Schematic illustration of two-pK triple-layer surface
Complex formation model
25
Figure 3.1
Schematic of photoreactor used in this study
27
Figure 3.2
A schematic of the equipment layout of the
microencapsulation process.
28
Figure 4.1
The adsorption of phenol onto TiO2 suspensions
34
Figure 4.2
The adsorption of ethyl lactate (EL) onto TiO2 suspensions
34
Figure 4.3
The turbidity in solution with changing TiO2 dosage
35
Figure 4.4
Effect of TiO2 dosages on the photooxidation phenol and
EL
37
Figure 4.5
Phenol concentration in solution vs. time under different
TiO2 loading
37
Figure 4.6
Ethyl lactate (EL) concentration in solution vs. time under
different TiO2 loading
38
Figure 4.7
Intermediate detected during the degradation of 1mM
phenol solution under different TiO2 loading
38
Figure 4.8
pH in solution vs. time under different TiO2 loading
40
Figure 4.9
Oxidation reduction potential (ORP) in solution vs. time
under different TiO2 loading
41
viii
Figure 4.10
Conductivity in solution vs. time under different TiO2
loading
42
Figure 4.11a
Test of pseudo-first order kinetics according to degradation
of phenol at different TiO2 loading
44
Figure 4.11b
Test of pseudo-first order kinetics according to degradation
of ethyl lactate at different TiO2 loading
45
Figure 4.12a
Effect of TiO2 loading of k’
45
Figure 4.12b
Effect of TiO2 loading on [C6H6O2]max
46
Figure 4.13
Effect of initial pH on photocatalytic oxidation of phenol
and EL
47
Figure 4.14
Phenol concentration in solution vs. time under different
initial pH
48
Figure 4.15
Ethyl lactate (EL) concentration in solution vs. time under
different initial pH
48
Figure 4.16a
Test of pseudo-first order kinetics according to degradation
of phenol at different initial pH
50
Figure 4.16b
Test of pseudo-first order kinetics according to degradation
of ethyl lactate at different initial pH
50
Figure 4.17
Effect of initial pH on k’ (first-order rate constant)
51
Figure 4.18
Effect of oxygen concentration on photooxidation of
phenol and EL
52
Figure 4.19
Effect of two different TiO2 catalysts on the photocatalytic
oxidation of phenol and EL
54
Figure 4.20
Effects of different oxygen conditions on the copper (II)
ions reduction
55
Figure 4.21
SEM micrographs of the precipitated green solid
56
Figure 4.22
SEM micrographs of the bare TiO2
56
Figure 4.23
EDX analysis of the precipitated green solid
57
ix
Figure 4.24
EDX analysis of the bare TiO2 solid
58
Figure 4.25
XPS Spectrum after curve fitting for the green precipitate
on the membrane filter
59
Figure 4.26
XPS Spectrum after curve fitting for the brown solid
61
Figure 4.27
Effects of different oxygen conditions on photocatalytic
oxidation of phenol
62
Figure 4.28
Effects of different oxygen conditions on photocatalytic
oxidation of ethyl lactate (EL)
62
Figure 4.29a
Effect of the initial copper(II) concentration on the
photocatalytic oxidation of phenol
64
Figure 4.29b
Test of pseudo-first order kinetics according to eq(4-3). at
different copper (II) concentrations
65
Figure 4.30
Effect of copper (II) concentration on k’ (first-order rate
constant)
66
Figure 4.31
Particle size with different TiO2
67
Figure 4.32
Comparing setting velocity of different forms of TiO2
68
Figure 4.33
The effect of different forms of TiO2 on the photocatalytic
oxidation phenol and EL
68
Figure 4.34
The TOC leaching of encapsulation TiO2
69
x
LIST OF TABLES
Table
Title
Page
Table 2.1
Important properties and usage of the selected compounds
7
Table 2.2
Oxidation potentials of some oxidants
11
Table 3.1
List of control parameters in encapsulation of TiO2 process
31
Table 4.1
The effect of TiO2 loading on phenol and ethyl lactate (EL)
reaction rates using a 30W Hg lamp
39
Table 4.2
Maximum intermediate concentrations for the photocatalytic
degradation of 1mM phenol using a 30W Hg lamp
39
Table 4.3
The effect of initial pH on phenol and ethyl lactate
degradation rates using a 30W Hg lamp
51
Table 4.4
A comparative study of two different commercial TiO2
catalysts
54
Table 4.5
Apparent rate constant obtained from Eq. (4-3) at different
Cu2+ concentrations
65
xi
CHAPTER 1
INTRODUCTION
1.1 Problem Statement
The semiconductor industry is an important component of the electronics industry,
whose global market yield has already exceeded that of the automobile industry as the
new millennium arrives (Chang and Sze, 1996). The semiconductor manufacturing
process involves a wide variety of distinct unit procedures and is continually evolving.
Although considerable efforts have been made through process modification or
chemical substitution to reduce environmental contamination, many of the processes
involved in the semiconductor industry give rise to emissions of a variety of
pollutants include inorganic and organic compounds. In Singapore, the organic
content of the wastewater must be reduced to within allowable limits in accordance to
the Environmental Pollution Control Act (EPCA) and the Sewerage and Drainage Act
(SDA) before it is discharged to the public sewer or watercourse (Ministry of
Environment, 2001).
Currently, vast majority of the wastewater treatment processes for semiconductor
manufacturing facilities is intended to remove inorganic chemicals such as
hydrofluoric acid, sulfuric acid, phosphoric acid, nitric acid, ammonium hydroxide, as
well as heavy metals such as copper, cobalt and silicon (Huang and Liu, 1999). In
contrast, the potential problems associated with the waste organic compounds have
not been properly addressed. At present, there are a number of waste disposal
1
methods currently in practice with varying degrees of success. Methods of treatment
in which the application of physical forces predominate are known as unit operations,
like primary screening. Methods of treatment in which the removal of pollutants
using chemical or biological reactions are known as unit processes, like neutralization.
Unit operations and processes are grouped together to provide various levels of
treatment known as primary, advanced primary, secondary and advanced treatment.
An ideal waste treatment process should completely mineralize all the toxic species
present in the waste stream without leaving behind any hazardous residues. It should
also be cost effective. The current situation most of the treatments require subsequent
treatment which results in high cost. For example, air-stripping require subsequent
treatment of the off-gas. Biological degradation is not applicable to waste streams
with very toxic organics. Advanced oxidation processes (AOPs) are used to oxidize
complex organic constituents found in wastewater that are difficult to degrade
biologically into simpler end products.
In addition, copper, cobalt and palladium are heavy metals also present in the
wastewater discharged from semiconductor manufacturing processes. They are toxic
contaminants and hence taking away of these metals is required. In Singapore, the
allowable limits for metal ions discharge into the sewer and watercourse and
controlled watercourse are 1 and 0.5 ppm, respectively. Specifically, copper ions
discharge into the sewer and watercourse should not exceed 5ppm (MOE, 2001). At
present the conventional treatment processes to remove heavy metals from industrial
waste stream are adsorption, ion exchange, electrowinning, precipitation, membrane
2
processes and evaporation. However most of these technologies have their own
limitations. For example, precipitation creates a significant amount of hazardous
sludge which is required a further treatment. Of many technologies, electrolytic
recovery is able to recover a metal to its elemental form.
In this study, simultaneous treatment of organic compounds and toxic metals is
investigated. This study is directed toward evaluating treatment technologies for
wastewater contaminated with several organic-base solvents commonly used in the
advanced semiconductor fabrication process. The selected organic chemicals include
the major elements of the following fabrication chemicals: ethyl lactate (EL), and
phenol (PHL). These organic compounds are vastly different in their chemical
structures, and are very popular pollutants in the waste stream from semiconductor
manufacturing facility. Copper is a very important heavy metal and is present in the
wastewater discharged from semiconductor manufacturing processes.
1.2 Objectives
The objectives of this research are to use a simple, batch scale photocatalysis reactor
to evaluate treatment technologies for wastewater contaminated with two organicbase solvents (ethyl lactate and phenol) and copper.
The most important objectives for the study are as followed:
•
Investigate
the
possibility
and
feasibility
of
using
heterogeneous
photocatalysis for simultaneous removal of ethyl lactate, phenol and copper.
3
•
Evaluate the mechanisms for the removal of organic compounds
•
Optimize photocatalysis reactor
•
Assess the possibility of the recovery of copper ions
1.3 Organization of the thesis
This thesis is divided into five chapters. Chapter 1 is an introduction to the motivation
and objectives of the project, followed by a description of the scope of the thesis.
Chapter 2 is a literature review of the photooxidation process in wastewater treatment.
In Chapter 3, the materials and analysis methods used in this study are described. The
experimental results and discussions are demonstrated in Chapter 4. Finally, a
summary of the findings from this thesis is presented in Chapter 5.
4
CHAPTER 2
LITERATURE REVIEW
2.1 Background of Wafer Fabrication Processes
There are a number of distinct unit processes within the semiconductor manufacturing
process in the production of integrated circuits (IC). These processes can be broadly
classified into wafer preparation, wafer fabrication and the wafer assembly. The basic
processes in wafer fabrication include a sequence of photolithography, doping, thinfilm deposition, advanced dry etch processes, metallization, post-cleaning and
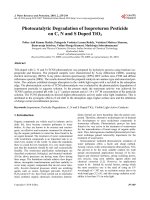
chemical-mechanical planarization/polishing. Figure 2.1 shows a simplified flow
diagram depicting a sequence of a typical wafer fabrication process (Den and Ko,
2001). Depending on the type and complexity of the IC design, the actual sequence of
the unit processes might vary from plant to plant. However the ultimate goal is the
same which is still to define the pattern of IC in microscopic scales.
Photolithography is a process that forms surface patterns on the wafer. The actual
number of photolithography steps to be repeated depends on the complexity of the IC
design. For example, production of 64M Dynamic Random Access Memory (DRAM)
typically requires a minimum of 30 photolithographic cycles for an individual wafer.
During the process of photolithography, a viscous, organic-base and light sensitive
material called photoresist is applied to the wafer surface. The photoresist used in
wafer fabrication process involves a mix-and match of commercialized I-LINE and
5
KrF solutions that are mainly composed of ethyl lactate, propylene glycol methyl
ether acetate and some phenol additives (Thompson et al., 1994). This is then followed
by the introduction of a photoresist developer to remove the unwanted portion of the
photoresist.
Input wafer
Wafer cleaning (pre-treatment) *
Oxidation
Chemical vapor
deposition (CVD)
Physical vapor
deposition (PVD)
Photolithography *
Ion implantation
Etching
Resist removal *
Wafer cleaning (post treatment) *
Output wafer
Figure 2.1: Flow diagram for a typical sequence of wafer fabrication process
* points of organic compoundss applied, (Den and Ko, 2001)
Ethyl lactate and phenol are two most important organic chemicals in the
semiconductor manufacturing process and found to be present in the wastewater from
6
the facilities. Table 2.1 summarizes the important chemical and characteristics of the
selected organic chemicals.
Table 2.1 Important properties and usage of the selected compounds*
Name of
Chemical
Molecular structure
Molecular
Compound
formula
(Molecular weight)
weight
Usage
O
HO
Ethyl
lactate
C5H10O3
O
CH3
CH3
118.1
Photoresist
94.1
Additive
component
OH
Phenol
C6H5OH
Description
Colorless, clear
liquid, mild odor,
soluble in water,
methanol, and
dichloromethane,
boiling point 154
℃, specific gravity
1.03 g/cm3
Colorless,
crystalline solid
that melts at about
41°C, boils at
182°C, and is
soluble in ethanol
and ether and
somewhat soluble
in water.
* Fluka laboratory chemicals and analytical reagents 2002/2003
2.2 Physical properties of UV light
UV light is part of electromagnetic radiation. The relationship between frequency,
wavelength, and light speed can be expressed as:
C = v×λ
(2-1)
where
v = frequency, Hz
λ = wavelength, m
7
c = light speed, 3.0×1010 cm/s
The photon energy E is given as:
E = h×v = h×C/λ
(2-2)
where
λ = wavelength, m
h = Planck’s constant, 6.626176 × 10⁻³⁴ J·s
E = photon energy, J
Eq. (2-2) can be simplified to
E = 1.9865× 10⁻¹⁵/λ
(2-3)
As one can see from the above equation, the photon energy is higher as the
wavelength is decreased. In the electromagnetic spectrum, UV lies between the
visible light and the X-rays with the wavelength range from 100 to 400 nm as shown
in Figure 2.1 (EPA-815-R-99-014) This can be subdivided into vacuum UV (100 ~
200 nm); UV-C (200 ~ 280 nm); UV-B (280 ~ 315 nm) and UV-A (315 ~ 400 nm).
8
Figure 2.2 Electromagnetic Spectrum
Emission of UV light is a generally regarded as physical process. UV light is
generated when the atoms return from a high energy state to a lower energy state. The
energy change in this process is described by
E1 - E0 = hv
(2-4)
where
E1 = higher energy status, J
E0 = lower energy status, J
According to the Stefan-Boltzman law, total radiation power (P) depends on the
temperature of radiation source matter: (Wang, 2004)
P = s × T4
(2-5)
9
where
T = temperature, K
P = total energy emitted by source matter, W⋅cm-2
S = Stefan-Boltzmann constant, 5.6703×10⁻¹² W⋅cm-2⋅K-4
2.3 Advanced oxidation process
An advanced oxidation process (AOP) is chemical oxidation technology that relys on
the formation of chemically powerful free radicals, such as the hydroxyl radical (OH·)
to oxidize organic and/or inorganic contaminants (Halmann, 1996). AOP for
wastewater treatment include reactions with H2O2, with or without ultraviolet (UV)
irradiation, Ozonation, and O3/UV treatment (Langlais et al., 1991)
The H2O2/UV, O3/UV and H2O2/O3/UV processes uses UV photolysis of H2O2 and/or
O3 in order to generate OH· radicals. The vacuum-UV (VUV) photolysis uses high
energy radiation interacting with the water to generate primarily OH· and H· radical.
In the heterogeneous photocatalysis (TiO2/UV) process employed in this research
project, the semiconductor TiO2 absorbs UV light and generates OH· radicals mainly
from adsorbed H2O and hydroxide ions (Legrini et al., 1993).
The hydroxyl radicals are highly reactive transient oxidants with an unpaired electron.
The hydroxyl radicals are the primary oxidizing species due to their highly
10
electrophilic character. It is capable of rapidly oxidizing most organic contaminants.
The oxidation potentials for common oxidants are listed in Table 2.2. In the table,
hydroxyl radical is the 2nd most powerful oxidizing species after fluorine.
Table 2.2 Oxidation Potentials of Some Oxidants*
Species
Fluorine
Hydroxyl radical
Atomic oxygen
Ozone
Hydrogen peroxide
Perhydroxyl radical
Permanganate
Hypobromous acid
Clorine dioxide
Hypochlorous acid
Hypoiodous acid
Chlorine
Bromine
Iodine
Oxidation Potential (V)
3.03
2.80
2.42
2.07
1.78
1.70
1.68
1.59
1.57
1.49
1.45
1.36
1.09
0.54
* Legrini et al., 1993
Hence, the generation of hydroxyl radicals is important for the oxidation of organic
molecules. Several possible mechanisms for the hydroxyl radical reactions in the
presence of an organic compound have been proposed (Legrini et al., 1993; Ray et al.,
2000):
Hydrogen abstraction: OH· + RH => R· + H2O
(2-6)
Electrophilic addition: OH· + PhX => HOPhX·
(2-7)
Electron transfer:
OH· + RX => RX·+ + HO-
(2-8)
11
Hydrogen abstraction is the most common mechanism that generates organic radicals
(R·). From Equation (2-9), organic peroxyl radical (RO2·) is formed with the addition
of molecular oxygen, which in turn initiate thermal (chain) reactions of oxidative
degradation, finally leading to CO2, H2O and mineral acid:
R· + O2 => RO2· =>=> CO2 + H2O + Mineral Acid
(2-9)
Based on hydroxyl radical attack of organic compound in photocatalytic degradation,
organic radical is formed as Equation (2-10).
OH· + R1 => R2·
Turchi
and
Ollis
suggested
four
possible
(2-10)
general
mechanisms
for
the
photodegradation of organic molecules in illuminated aqueous TiO2 slurries,
assuming that OH· are the primary oxidants. The following reactions might occur
(Turchi and Ollis, 1990; Halmann, 1996):
•
An adsorbed OH· radical reacts with an adsorbed organic species (R1) on the
TiO2 surface
•
A non-bound (free in solution) OH· radical reacts with an adsorbed organic
species
•
A free organic species reacts with an adsorbed radical
•
A free OH· radical reacting with a free organic molecule in solution.
Results have indicated that the main reaction of the photocatalytic degradation
process takes place on the surface of the catalyst.
12