Hướng dẫn từ a đến z bài viết table
Bạn đang xem bản rút gọn của tài liệu. Xem và tải ngay bản đầy đủ của tài liệu tại đây (509.42 KB, 8 trang )
IELTS Writing task 1
HƯỚNG DẪN CHI TIẾT CÁCH VIẾT 1 BÀI TABLE
BY NGOC BACH
Lưu ý: nếu bắt đầu làm quen với Task 1 của IELTS. Bạn có thể vào trang
/>Tham khảo các bài giảng về phần task 1 trước khi đọc tiếp bài này thì sẽ hiểu dễ dàng hơn
You should spend about 20 minutes on this task.
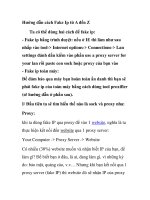
The table illustrates the proportion of monthly household income five
European countries spend on food and drink, housing, clothing and
entertainment.
Summarize the information by selecting and reporting the main features
and make comparisons where relevant.
Write at least 150 words.
Proportion of household income five European countries spend on food and drink, housing,
clothing and entertainment.
Food
drink
25%
and
Housing
Clothing
Entertainment
31%
7%
13%
Germany 22%
27%
UK
33%
15%
19%
37%
11%
11%
Turkey
36%
20%
12%
10%
Spain
31%
18%
8%
15%
France
Written by Ngoc Bach
Website: www.ngocbach.com
Page: />
Page 1
IELTS Writing task 1
PHƯƠNG PHÁP CHUNG VIẾT 1 BÀI TABLE
1- Về cơ bản, biểu đồ dạng table viết không có gì khác với dạng line graph, bar chart hay pie
chart. Bạn bố cục bài viết gồm 4 phần: Introduction, Overview, Body 1, Body 2
2- Mở bài: cố gắng paraphrase lại các từ của đề bài. Nếu để ý bạn sẽ thấy quanh đi quẩn lại sẽ
chỉ một vài từ xuất hiện. Mình đang tổng hợp một list các từ hay sử dụng để paraphrase phần
intro trong task 1 cho lớp của mình. Sẽ post public cho mọi người khi soạn xong
3- Tổng quan: Một mẹo tìm đặc điểm phần tổng quan là: Nếu thấy bài có sự thay đổi theo thời
gian -> nên tìm đặc điểm về xu hướng trước (đây thường là đặc điểm quan trọng cần lưu ý trước
tiên). Sau đó, mọi người cố gắng để ý so sánh các cột các dòng (thay vì chỉ để ý các ô trong
table). Nếu không thể so sánh các hạng mục thì có thể so sánh các số liệu lớn nhất, nhỏ nhất. Nên
viết 2 câu - tương ứng với 2 đặc điểm trong phần tổng quan (1 câu thường không đủ)
4- Ở 2 khổ thân bài: Mọi người nhớ không bao giờ mô tả số liệu riêng rẽ, luôn cố gắng so sánh
càng nhiều càng tốt. Cố gắng chia thành 2 nhóm (Ví dụ: một nhóm số liệu lớn nhất, một nhóm số
liệu nhỏ nhất, hoặc nhóm số liệu bằng nhau)
5- Lưu ý sử dụng past simple khi mô tả năm trong quá khứ, sử dụng cấu trúc dự đoán tương lai
'is expected/predicted to" nếu có năm tương lai. Nếu không có khoảng thời gian được chỉ ra ->
dùng present simple
6- Mọi người xem hướng dẫn từng bước viết 1 bài Table phía dưới để hiểu rõ cách viết nhé :)
Written by Ngoc Bach
Website: www.ngocbach.com
Page: />
Page 2
IELTS Writing task 1
I) INTRO: Cách viết mở bài trong bài Task 1 là paraphrase the question. Bạn viết lại câu của đề
bài thay bằng từ của bạn. Những phần mình gạch chân là những phần gợi ý bạn có thể thay lại.
Câu đề bài: The table illustrates the proportion of monthly household income five European
countries spend on food and drink, housing, clothing and entertainment.
+ Câu trả lời của một bạn học sinh: The table gives information about the percentage of salary
(1) which residents in 5 European nations spend on 4 different items every month.
Nhận xét: Đây là một câu trả lời khá tốt. Thay hầu hết được các từ khóa của bài bằng từ của bạn
đấy. Tuy nhiên, lưu ý rằng nên để nguyên "income"thay vì paraphrase thành "salary" (‘income’
may also be made up of social benefits, pensions or rents – in the case of landlords)
-> Bach’s amendments: The table compares the percentage of income which residents in five
European nations spend monthly on four different categories of expenditure.
II) OVERVIEW: An overview is simply a summary of the main things you can see. write two
overview sentences. Câu tổng quan là câu nêu lên đặc điểm chung của biểu đồ. Thường ta sẽ viết
2 câu nêu lên 2 đặc điểm chung. Trong task 1, thường bạn có thể tìm đặc điểm về xu hướng (nếu
đề bài có sự thay đổi về thời gian), hoặc tìm đặc điểm về yếu tố lớn nhất, nhỏ nhất.
+ Câu trả lời của một bạn học sinh: Overall, food and drink and housing are the most prevalent
choices (2) of citizens in all countries while clothing and entertainment occupy the lower rates.
Nhận xét: (2) Diễn đạt không rõ ràng lắm. Có thể diễn đạt lại như sau "‘In all five countries,
citizens spend the highest proportion of their incomes on food, drink and housing and
significantly less on clothing and entertainment".
-> Bach’s amendments: Overall, in all five countries, citizens spend the highest proportion of
their incomes on the first two categories – food and drink, and housing. Their percentage of
expenditure on clothing and entertainment, in contrast, is significantly less.
Written by Ngoc Bach
Website: www.ngocbach.com
Page: />
Page 3
IELTS Writing task 1
III) BODY
Lưu ý khi viết thân bài:
Hướng phân tích hợp lý khi phân khổ ở đây đó là phân theo yếu tố lớn và yếu tố bé hơn. Yếu tố
lớn nhất vào khổ 1, yếu tổ nhỏ hơn khổ 2 ->
Khổ 1 viết cho "Food and Drink", "Housing".
Khổ 2 viết cho "clothing" và "Entertainment"
Mọi người chú ý yêu cầu của đề bài phần Task 1 luôn là "Summarize the information by
selecting and reporting the main features and make comparisons where relevant.". Tóm tắt các
thông tin bằng việc chọn và báo cáo những đặc điểm quan trọng, so sánh các thông tin liên quan.
Do vậy, phần thân bài của 1 bài mô tả biểu đồ cần nhất là bạn phải mô tả chính xác các thông tin
được chỉ ra trong biểu đồ và luôn so sánh chúng với nhau. Nếu bạn có thể đa dạng câu trúc so
sánh, từ vựng -> sẽ đáp ửng đủ tốt 4 tiêu chí.
+ Xem phần trả lời của 1 bạn học sinh: (phần màu xanh là phần mình sửa lại)
Turkish and Spanish households (2) spend the highest ratio percentage of their wages income
(1) on food and drink monthly with 36% and 31% respectively. However, only 27% of the
income is spent on this item by UK’s household (3), compared with 25% by French and 22% by
Germans (4). By comparison, people in all other nations tend to spend the highest proportion of
their salaries income (1) on housing. In France, Germany and the UK, people spend not under
over/more than (5) 30% of their income on this item, at 31%, 33% and 37% respectively. The
figure for Turkey is 20% and Spain is 18%.
The percentages of income citizens pay for clothing and entertainment are lower. In France and
Spain, people spend only 7% and 8% of their wages on clothing respectively. The figures for the
remaining nations are no more than/not above 15%. Likewise, the average percentage of income
that residents spend on entertainment is only from 10% to 19% in these five countries.
+ Nhận xét
1. nên để nguyên "income"thay vì paraphrase thành "salary" (‘income’ may also be made up
of social benefits, pensions or rents – in the case of landlords)
2. Tất nhiên bình thường ta có thể nói: He is Turkish/Spanish. It is not correct (or polite) to
use Turkish/Spanish in this way. You could refer to Turkish/Spanish people, for
example, or in this case ‘households’. Dùng ‘The Turkish/The Spanish spend...cũng
đúng
Written by Ngoc Bach
Website: www.ngocbach.com
Page: />
Page 4
IELTS Writing task 1
3. Đây là a plural, không phải a possessive: ‘...is spent on this item by UK households, ...’
4. Giống lỗi 2 – ‘...compared to 25% by French and 22% by German people’.
5. Về ngữ pháp ok tuy nhiên dùng từ như gợi ý sẽ rõ ràng hơn, tốt hơn.
+ Bach’s amendments:
Households in Turkey and Spain spend the highest proportions of their monthly income on food
and drink, with 36% and 31% respectively. However, in UK, French and German households
these figures are significantly less at 27%, 25% and 22% respectively. The proportion spent on
housing accounts for 37% of monthly income in the UK, 31% in France and 33% in Germany.
These figures are much higher than monthly housing expenditure in Turkey [20%] and Spain
[18%].
The proportion of their income which households in these countries spend on the last two
categories is much lower. Spending on clothing is just 7% in France and 8% in Spain, while
German households spend the highest proportion at 15%. The range of expenditure on
entertainment varies from only 10% in Turkey to 19% in Germany.
Written by Ngoc Bach
Website: www.ngocbach.com
Page: />
Page 5
IELTS Writing task 1
Đây là 2 bản cuối. Một bản mình đã correct hết lỗi từ bài của bạn học sinh (version 1), một bài
mình viết lại (version 2). Mọi người tham khảo nhé. Có rất nhiều cấu trúc so sánh tốt mọi người
có thể tham khảo trong này :)
VERSION 1
The table gives information about the percentage of income which residents in 5 European
nations spend on 4 different items every month.
Overall, in all five countries, citizens spend the highest proportion of their incomes on food,
drink and housing and significantly less on clothing and entertainment’.
Turkish and Spanish households spend the highest percentage of their income on food and drink
monthly with 36% and 31% respectively. However, only 27% of the income is spent on this item
by UK households, compared with 25% by French and 22% by German people. By
comparison, people in all other nations tend to spend the highest proportion of their income on
housing. In France, Germany and the UK, people spend more than 30% of their income on this
item, at 31%, 33% and 37% respectively. The figure for Turkey is 20% and Spain is 18%.
The percentages of income citizens pay for clothing and entertainment are lower. In France
and Spain, people spend only 7% and 8% of their wages on clothing respectively. The figures
for the remaining nations are not above 15%. Likewise, the average percentage of income that
residents spend on entertainment is only from 10% to 19% in these five countries.
(190 words)
Corrected by Ngoc Bach
Written by Ngoc Bach
Website: www.ngocbach.com
Page: />
Page 6
IELTS Writing task 1
VERSION 2
The table compares the percentage of income which residents in five European nations spend
monthly on four different categories of expenditure.
Overall, in all five countries, citizens spend the highest proportion of their incomes on the first
two categories – food and drink, and housing. Their percentage of expenditure on clothing and
entertainment, in contrast, is significantly less.
Households in Turkey and Spain spend the highest proportions of their monthly income on food
and drink, with 36% and 31% respectively. However, in UK, French and German households
these figures are significantly less at 27%, 25% and 22% respectively. The proportion spent on
housing accounts for 37% of monthly income in the UK, 31% in France and 33% in Germany.
These figures are much higher than monthly housing expenditure in Turkey [20%] and Spain
[18%].
The proportion of their income which households in these countries spend on the last two
categories is much lower. Spending on clothing is just 7% in France and 8% in Spain, while
German households spend the highest proportion at 15%. The range of expenditure on
entertainment varies from only 10% in Turkey to 19% in Germany.
(189 words)
Written by Ngoc Bach
Written by Ngoc Bach
Website: www.ngocbach.com
Page: />
Page 7
IELTS Writing task 1
Ở bài hướng dẫn sau, mình sẽ hướng dẫn mọi người chi tiết cách viết biểu đồ cột của đề thi
25/04/2015 nhé. Mọi người ủng hộ nhé ^^
Cám ơn mọi người nhiều
-Ngọc Bách-
Written by Ngoc Bach
Website: www.ngocbach.com
Page: />
Page 8