That shrinking feeling tracing the changing shape of the EU banking industry
Bạn đang xem bản rút gọn của tài liệu. Xem và tải ngay bản đầy đủ của tài liệu tại đây (368.88 KB, 4 trang )
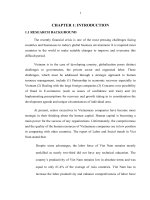
That Shrinking Feeling
Tracing the changing shape of the EU banking industry
Six years after the onset of the global financial crisis, EU banks are
still busy shoring up their balance sheets to meet regulatory
demands. But to what extent have the Basel III rules — announced
in 2010 — already changed the way EU banks do business?
Banks are slimming down
EU banks are less bloated with assets than they were previously.
In 2013, mean total assets
at the largest EU banks
have fallen by
11
1,097
1,156
1,211
1,196
1,064
EUR bn
%
2009
2010
2011
2012
2013
2009=100%
Breakdown of assets at EU banks, 2009-2013
210
190
• Cash and cash equivalents
170
The decline has been led by
the shrinking of net loans
and trading books.
150
130
• Investment securities available for sale
• Interest bearing deposits at banks
• Net loans
• Trading account assets
110
90
2009
2010
2011
2012
2013
For more information, please visit www.pwc.com/riskminds
An infographic from The Economist Intelligence Unit
Banks have reduced their risk exposures
In tandem with decreasing their assets, since 2011 banks significantly cut their exposure to
adverse market movements.
Trading book/market risk, 2011-2013
EUR mn
30000
25000
20000
15000
10000
5000
0
2009
2010
2011
2012
2013
150
Canada &
Australia
140
130
120
110
US
100
90
Japan
EU
The value of mean risk-weighted assets
in Europe has been trending downwards.
2009=100%
Mean risk-weighted assets
EU banking industry’s mean
credit risk in risk-weighted assets, 2011-2013
Corporate
lending
Most striking is the
reduction in riskier
corporate lending and
the corresponding
rise in government
bonds, most of which
are safer and more
liquid sovereign bonds.
Government
bonds
160,000
9,000
150,000
140,000
8,000
2011
Corporate lending
2012
2013
Government bonds
Banks have improved their liquidity position
EU banks not only have smaller, less risky balance sheets resting on firmer capital foundations, they are also in a
much stronger position to meet a liquidity crunch.
EU banks increased
their holdings of cash
and cash-equivalent
assets by no less than
8
7
%
2009
2013
EU banks reduced
their short-term
borrowings by
38%
EU banks lowered the
ratio of liquid assets
to non-liquid assets
A springboard for change?
This combination of reduced leverage, increased capital quality and a stronger liquidity position has led to a fitter
and leaner banking industry.
EU banks have already been given the all clear by regulators with average Tier 1 Capital ratios
well above Basel III requirements of 4.5% for Common Equity Tier 1 and 6% for Tier 1.
Capital ratios (mean),
2009 to 2013
Capital ratio
Tier 1 Capital ratio
%
14
EUR bn
500
12
0
2010
2011
2012
2013
0
2009
2010
2011
2012
421.110
425.862
421.057
454.238
411.677
12
13.4
11.3
13
10
11.8
9.2
11.6
8.4
10.7
2009
100
462.448
200
4
403.073
6
462.823
300
367.771
8
443.334
400
10
2
Mean net loans and mean total deposits,
2009 to 2013
Net loans
Total deposits
2013
At the same time business models are changing, with banks turning away from more volatile
activities. The past few years have seen some lenders move more towards a deposits-driven
business. Similarly, commercial loans – many of which are believed to be unsecured – are
shrinking faster than consumer loans.
2009=100%
Value of EU bank loans, 2009-2013
120
110
100
Consumer loans
Net loans
90
80
70
Commercial
loans
2009
2010
2011
Having passed their preliminary health
check, EU banks are now in a stronger,
more stable position, which will have
more appeal to shareholders. The journey
to full health, though, is just beginning.
2012
2013