Asian green city index assessing the environmental performance of asias major cities
Bạn đang xem bản rút gọn của tài liệu. Xem và tải ngay bản đầy đủ của tài liệu tại đây (6.93 MB, 63 trang )
Asian Green City Index
Assessing the environmental performance of Asia’s major cities
A research project conducted by the Economist Intelligence Unit, sponsored by Siemens
Asian Green City Index | Contents
Contents
004 The Cities00
006 Expert advisory panel
008 Introduction
010 Results
012 Overall key findings
018 Key findings from the
categories
018 Energy and CO2
018 Land use and buildings
019 Transport
019 Waste
020 Water
020 Sanitation
020 Air quality
021 Environmental governance
022 Managing the city as a
‘living organism’
An interview with Nicholas You,
urban environmental expert
2
024 Exemplar projects
024 Energy and CO2
Tokyo: The first cap and trade
system in Asia
Shanghai: The largest offshore
wind farm in China
025 Land use and buildings
New technology: The world’s
greenest skyscraper in
Guangzhou
Old technology: Planting trees
in Beijing
027 Transport
Shanghai: Doubling the size of
the world’s longest metro
Green transport: A holistic
approach in Singapore
028 Waste
Hanoi: Making waste pay
Bangkok: Follow that trash
029 Water
Singapore: Water as good as new
030 Environmental governance
Eco-clubs: Educating future
environmentalists in Delhi
0
032 Methodology
036
036
040
044
048
052
056
060
064
068
072
076
City portraits
Bangkok
Beijing
Bengaluru
Delhi
Guangzhou
Hanoi
Hong Kong
Jakarta
Karachi
Kolkata
Kuala Lumpur
080
084
088
092
096
100
104
108
112
116
120
Manila
Mumbai
Nanjing
Osaka
Seoul
Shanghai
Singapore
Taipei
Tokyo
Wuhan
Yokohama
3
Asian Green City Index | The Cities
The Cities
Beijing, China
Seoul, South Korea
Tokyo, Japan
Osaka, Japan
Yokohama, Japan
Nanjing, China
Shanghai, China
Wuhan, China
Delhi, India
Taipei, Taiwan
Karachi, Pakistan
rates the environmental performance of
Guangzhou, China
Kolkata, India
Hanoi, Vietnam
The Asian Green City Index measures and
22 Asian cities. They are capital cities as well
Hong Kong, China
as certain leading business centres selected
Mumbai, India
for their size and importance. The cities were
Manila, Philippines
Bangkok, Thailand
Bengaluru, India
picked independently rather than relying
on requests from city governments to be
included, in order to enhance the Index’s
credibility and comparability.
Kuala Lumpur, Malaysia
Singapore, Singapore
Jakarta, Indonesia
4
5
Asian Green City Index | Expert advisory panel
Expert advisory panel
A panel of global experts in urban environmental sustainability advised the Economist
Intelligence Unit (EIU) in developing the methodology for the Green City Index, including
the Latin American Green City Index and forthcoming Indexes in other regions.
The EIU would like to thank the panel for their time and valuable insight.
Brunella Boselli
Gordon McGranahan
Mary Jane C. Ortega
Hiroaki Suzuki
Pablo Vaggione
Sebastian Veit
David Wilk
Nicholas You
Statistician, Regional Development Policy Division, Organisation for Economic Cooperation
and Development (OECD)
Head of Human Settlements
Group, International Institute
for Environment and Development
Secretary General
CITYNET
Lead Urban Specialist and Eco2
Team Leader, Corporate
Finance Economics and Urban
Department, World Bank
Founder, Design Convergence
Urbanism
Senior Climate Economist
African Development Bank
Climate Change Lead Specialist, Sustainable Energy and
Climate Change Unit, InterAmerican Development Bank
Chairman, Steering Committee
of the World Urban Campaign,
UN-Habitat
Brunella Boselli has been with the
regional development policy
division of the OECD since 2003.
She is responsible for regional
statistics, and is one of the authors
of the flagship publication “OECD
Regions at a Glance”. She has
recently developed the OECD
Metropolitan Database, which
contains socio-economic data for
82 metropolitan areas, and is
currently working on a new OECD
territorial definition for metropolitan regions.
Gordon McGranahan currently
directs the Human Settlements
Group at the International Institute
for Environment and Development. Trained as an economist, he
spent the 1990s at the Stockholm
Environment Institute, in charge of
their Urban Environment
Programme. He works on a range
of urban environmental issues,
with an emphasis on addressing
poverty and environmental
problems in and around the home,
and how the critical scale of urban
environmental burdens changes as
cities become wealthier. Key
publications include: “The Citizens
at Risk: From Urban Sanitation to
Sustainable Cities” and “The rising
tide: Assessing the risks of climate
change and human settlements in
low-elevation coastal zones”. He
was the convening lead author of
the urban systems chapter of the
Millennium Ecosystem Assessment.
Mary Jane C. Ortega is the former
mayor of the city of San Fernando,
Philippines, and served the city
from 1998 to 2007. She is now the
secretary general of CITYNET, a
network of 119 member cities and
NGOs that works to improve living
conditions in human settlements
in Asia-Pacific. She was the charter
president of the Solid Waste
Management Association of the
Philippines, and was recently
elected back to the position of
president. She was a member of
the executive committee of the
United Nations Advisory Council
on Local Authorities (UNACLA)
from 2000 to 2007. She received
the UN-Habitat Scroll of Honour
Award in 2000.
Hiroaki Suzuki has more than 20
years of operational experience in
the infrastructure sector and public
sector at the World Bank. Having
worked in the East Asia and Pacific
Region, as East Asia urban sector
leader and China urban sector
coordinator for the last five years,
he joined the Bank’s Corporate
Finance Economics and Urban
Department in 2009 as lead urban
specialist and Eco2 team leader. He
is the main author of “Eco2 cities:
Ecological Cities as Economic Cities”
(www.worldbank.org/eco2).
Pablo Vaggione is an urban
specialist with over 15 years of
experience. His cross-sector and
multidisciplinary approach
provides cities and actors in urban
development with integrated,
strategic and practical plans to
respond to the challenges of
sustainable urbanisation. He has
worked in East and South-East
Asia, Western Europe, and Latin
and North America, in the
preparation of city development
strategies, plans for the
regeneration of historic urban
areas, and sustainable development blueprints for new districts.
He provides advice on urban issues
to a number of multilateral
organisations, local governments
and companies. His work for
Madrid received in 2007 the World
Leadership Award. Between 2007
and 2010 he served as the
Secretary General of the
International Society of City and
Regional Planners (ISOCARP), a
professional organization of
planners from 70 countries.
Sebastian Veit is senior climate
economist at the African
Development Bank in Tunis. While
at the organisation he has focused
on green growth strategies in
Africa and renewable energy
issues. In 2007 he was a consultant
to the United Nations Framework
Convention on Climate Change,
and from 2004 to 2007 he was a
consultant with the World Bank in
Washington DC. At the World Bank
he specialised in energy and water.
David Wilk joined the InterAmerican Development Bank in
early 2001 as an urban environmental senior specialist. His
professional experience in Latin
America and the Caribbean during
the 1990s included a range of
management and consulting
activities with the World Bank,
international organisations and
consulting firms. His work with
these organisations was in the area
of land use and environmental
planning, watershed management, sustainable urban transport
and environmental assessment of
development and infrastructure
projects.
Nicholas You is chairman of,
amongst others, the Cities and
Climate Change Commission of the
World Future Council, and the
Assurance Group of the Urban
Infrastructure Initiative of the
World Business Council for Sustainable Development. After
running UN-Habitat’s Best
Practices and Local Leadership
Programme for over a decade, he
was appointed as the senior
policy and strategic planning
adviser of the agency. From 2007
to 2009 he led the development
and roll out of UN-Habitat’s
strategic and institutional
management plan. As part of that
plan, he was asked in January
2009 to spearhead UN-Habitat’s
World Urban Campaign. Upon his
retirement from the UN in July
2010, some 50 partners representing public, private and civil
society institutions worldwide
elected him as chairman of the
Campaign’s Steering Committee.
6
7
Asian Green City Index | Introduction
Introduction
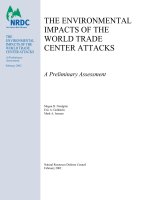
Unprecedented shift from the countryside to cities
T
he future of Asia is in its cities. Although still
one of the less urbanised continents, the
share of the Asian population living in urban
areas has grown from 32% in 1990 to 42% in
2010, according to the United Nations Population Division. By 2026, the United Nations forecasts that half of Asians will be city dwellers.
The sheer size of the continent’s population
makes the task of managing this urbanisation
especially daunting. For the last five years, Asia
has added 37 million urban residents each year,
more than 100,000 per day, to its growing total.
Asia currently has seven of the world’s 10 most
populous urban areas, and McKinsey and Co, a
consultancy, predicts that by 2025, China alone
will have 221 cities with more than a million
inhabitants. In contrast, Europe currently has
just 25.
The Asian Development Bank says the ongoing migration from the countryside to cities in
Asia is “unprecedented in human history”, and
the scale of the change has enormous environmental consequences. In order to cope with this
migration, the Asian Development Bank calculates that each day, across the continent, cities
currently need to build a total of 20,000 new
dwellings, 250 km of new roads, and the infrastructure to deliver an additional 6 million litres
of potable water. How Asian governments manage urbanisation will be crucial to the health
and wellbeing of billions of people in the region
and worldwide.
The Asian Green City Index, a research project
conducted by the Economist Intelligence Unit,
Urban population in Asia from 1990 - 2025
% of population living in cities
50
40
30
20
10
Year
0
1995
A unique Index
The 22 cities selected for the Asian Green City Index include most
major Asian urban areas. They are capital cities as well as certain
leading business centres selected for their size and importance. The
cities were picked independently rather than relying on requests
from city governments to be included, in order to enhance the Index’s credibility and comparability. Another decisive factor in the selection was the availability of data. One city, Ho Chi Minh City, Viet-
60
1990
sponsored by Siemens, seeks to measure and
assess the environmental performance of 22
major Asian cities across a range of criteria. This
report presents the key findings and highlights
from the Index, and is intended to provide
stakeholders with a unique tool to help Asian
cities learn from each other, in order to better
address the common environmental challenges
they face.
2000
2005
2010
2015
2020
2025
The report is divided into five parts. First, it
examines the overall key findings. Second, it
examines the key findings from the eight individual categories in the Index: energy and CO2, land
use and buildings, transport, waste, water, sanitation, air quality and environmental governance. Third, the report presents a variety of
leading best-practice ideas from across the
region. Fourth, it gives a detailed description of
the methodology used to create the Index. Finally, an in-depth profile for each city outlines its
particular strengths, weaknesses, and ongoing
environmental initiatives. These profiles rightly
constitute the bulk of the report because the aim
of the study is to share valuable experience.
nam, had to be excluded from the original shortlist due to a
significant lack of available information.
The methodology, described in detail in a separate section in this report, has been developed by the EIU in cooperation with Siemens. It
relies on the expertise of both organisations, a panel of outside experts, and the experience from producing the European Green City
Index in 2009 and the Latin American Green City Index in 2010. One
of the great strengths of the Asian Green City Index is the breadth of
information it uses. There are 29 individual indicators for each city,
and these indicators are often based on multiple data points. Value
also comes from how the Index is presented. Each city is assessed in
eight categories and placed within a performance band to indicate
its relative results. The process is transparent, consistent, replicable,
and reveals sources of best practice.
Source: United Nations Population Division
8
9
Asian Green City Index | Results
Results
H
ere are the complete results for the 22 cities in the Asian Green City
Index, including the overall results and placements within the eight
individual categories. The cities were placed in one of five performance
bands, from well below average to well above average.
Overall results
well
below
average
below
average
average
above
average
well
above
average
Karachi
Bengaluru
Hanoi
Kolkata
Manila
Mumbai
Bangkok
Beijing
Delhi
Guangzhou
Jakarta
Kuala Lumpur
Nanjing
Shanghai
Wuhan
Hong Kong
Osaka
Seoul
Taipei
Tokyo
Yokohama
Singapore
Category results
Energy and CO2
Transport
Air quality
well
below
average
below
average
average
above
average
well
above
average
well
below
average
below
average
average
above
average
well
above
average
well
below
average
below
average
average
above
average
well
above
average
well
below
average
below
average
average
above
average
Shanghai
Beijing
Guangzhou
Karachi
Kolkata
Kuala Lumpur
Nanjing
Wuhan
Bangkok
Bengaluru
Hanoi
Manila
Mumbai
Delhi
Hong Kong
Jakarta
Osaka
Seoul
Singapore
Taipei
Yokohama
Tokyo
Karachi
Kolkata
Bangkok
Bengaluru
Hanoi
Manila
Mumbai
Beijing
Delhi
Guangzhou
Jakarta
Nanjing
Shanghai
Wuhan
Hong Kong
Kuala Lumpur
Seoul
Singapore
Taipei
Tokyo
Yokohama
Osaka
Kuala Lumpur
Bangkok
Delhi
Guangzhou
Hanoi
Jakarta
Manila
Bengaluru
Hong Kong
Karachi
Kolkata
Mumbai
Shanghai
Taipei
Beijing
Nanjing
Osaka
Seoul
Wuhan
Singapore
Tokyo
Yokohama
Karachi
Mumbai
Beijing
Kolkata
Wuhan
Bengaluru
Delhi
Guangzhou
Hanoi
Jakarta
Nanjing
Seoul
Shanghai
Bangkok
Hong Kong
Kuala Lumpur
Manila
Osaka
Singapore
Taipei
Tokyo
Yokohama
Land use and buildings
10
Water
Waste
Sanitation
well
above
average
Environmental governance
well
below
average
below
average
average
above
average
well
above
average
well
below
average
below
average
average
above
average
well
above
average
well
below
average
below
average
average
above
average
Hanoi
Bangkok
Karachi
Kolkata
Manila
Shanghai
Wuhan
Beijing
Bengaluru
Delhi
Guangzhou
Jakarta
Kuala Lumpur
Mumbai
Nanjing
Tokyo
Osaka
Seoul
Singapore
Taipei
Yokohama
Hong Kong
Jakarta
Kuala Lumpur
Bangkok
Karachi
Kolkata
Manila
Mumbai
Seoul
Beijing
Bengaluru
Guangzhou
Hanoi
Nanjing
Shanghai
Wuhan
Delhi
Hong Kong
Osaka
Taipei
Tokyo
Yokohama
Singapore
Hanoi
Bangkok
Jakarta
Karachi
Kolkata
Kuala Lumpur
Manila
Mumbai
Beijing
Bengaluru
Delhi
Nanjing
Shanghai
Wuhan
Guangzhou
Hong Kong
Osaka
Seoul
Singapore
Taipei
Tokyo
Yokohama
well
above
average
well
below
average
below
average
average
above
average
Hanoi
Kolkata
Karachi
Mumbai
Beijing
Bengaluru
Delhi
Guangzhou
Jakarta
Kuala Lumpur
Manila
Nanjing
Shanghai
Wuhan
Bangkok
Hong Kong
Osaka
Seoul
Singapore
Taipei
Tokyo
Yokohama
well
above
average
11
Asian Green City Index | Overall key findings
Overall key findings
Environmental
awareness and income:
A tipping point in Asia
A
lthough money is not everything when it
comes to environmental performance, wealth
helps in some obvious ways. Richer cities are able
to make necessary investments in urban infrastructure, and can afford to maintain a professional, experienced civil service to drive environmental
initiatives. This holds true in the Asian Green City
Index, where wealthier cities consistently perform
better. Singapore, for example, is the Index leader
with a well above average ranking overall, and is
also the fourth richest city, with a GDP per person
of US$36,500. It can afford cutting-edge water
recycling plants, waste-to-energy facilities and
major investments in its transport system. Yokohama, with an above average per-formance overall and a GDP per person of US$30,200, offers
generous subsidies for electric vehicles, among
other investments, and its innovative Water Bu-
12
reau provides training and technical assistance to
city officials in developing countries. In Asia, the
correlation between GDP per capita and environmental performance is as strong as it was in
2009’s European Green City Index.
Richer cities perform better
Average annual GDP per person in US$
45,000
40,000
At a certain level, resource consumption
does not continue to rise with income
As cities become more prosperous, in addition
to investing in infrastructure, one might also
expect residents to consume more resources
and thereby experience environmental consequences such as higher carbon emissions, or
excessive water consumption and waste. Up to a
certain level of income, the Asian Green City
Index does indeed show a steady rise in resource
consumption along with per capita GDP. But
when income rises above a certain point, at
around US$20,000 per person, average consumption declines.
For example, the average waste generation
of the six cities in the high income range (each
with a GDP per capita above US$29,000) is 382
35,000
30,000
25,000
20,000
15,000
10,000
5,000
… well below … average … well above
Cities
ranking average or
average or
below average
above average
kg per person per year. This is just 7 kg above the
overall Index average of 375 kg and well below
the average of 598 kg of the five cities in the
mid-income range (between US$10,000 and
US$25,000).
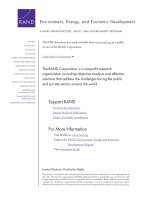
There is a similar picture regarding water
consumption. The six richest cities consume 343
litres per person per day on average. Although
this is higher than the average water consumption of all cities (278 litres), the mid-income
cities have higher consumption levels (393
litres). For an illustration of this phenomenon,
see chart on the right.
For carbon emissions, this pattern holds true
as well. The six richest cities emit an average of
5.8 tonnes per person per year, compared to an
overall average of 4.6 tonnes. However, the five
cities in the mid-income range produce on average 7.6 tonnes of CO2 per person per year.
All of this demonstrates that wealthier cities in
the Index do not necessarily consume resources
at a level that their high incomes might suggest.
This shift was not present in the Latin American
Tipping point in water consumption
Water consumption in litres per person per day
600
Guangzhou
Kuala Lumpur
500
Osaka
Shanghai
400
Hong Kong
Nanjing
Bangkok
Seoul
300
Wuhan
Mumbai
Beijing
Delhi
Karachi
Manila
Kolkata
200
100
Singapore
Yokohama
Taipei
Tokyo
Jakarta
Bengaluru
Hanoi
0
0
10,000
20,000
30,000
40,000
50,000
60,000
70,000
Annual GDP per person in US$
13
Asian Green City Index | Overall key findings
Index and was less clear in the European Index.
There are several potential factors at work. The
transition to more service-based industries plays a
part in reducing carbon emissions among the richest cities. And the quality of infrastructure contributes to lower water consumption levels. Five of
the seven wealthiest cities, for example, have
water leakage rates at or below 7%. Policy execution also plays a role in richer cities (see below). In
Japan, Taiwan and South Korea, the rise of environmentalism coincided with public outcries over
industrial pollution, which led governments to
begin addressing environmental issues as a
whole. And governments in those countries have
remained responsive to citizens’ concerns ever
since. Dr Hyun Bang Shin of the London School of
Economics has noted the link between income
and rising environmental awareness in China. As
wealth grows, he says, “many of the new middle
class are becoming much more aware of environmental issues. They seem to be exerting pressure
on local governments.” He adds, “Whether or not
the interest in environmental protection expands
14
beyond their immediate neighbourhoods and surroundings remains to be seen.”
Evidence from the city portraits in this report
suggests that the wealthier cities have also
made solid efforts to reduce consumption.
Taipei City has a longstanding, world-renowned
pay-as-you-throw waste charge. In 2003, Yokohama set a goal of reducing waste by 30% in ten
years but exceeded the target in five years. By
2030 Seoul aims to cut carbon emissions by 40%
compared to 1990. Osaka holds 150 workshops
each year to educate primary school children
about the water system. There are many more
examples of cities pursuing practical steps to
encourage sustainable resource use, and the
consumption figures in the Index show that they
are having a positive effect.
Delhi’s approach to waste and recycling:
when resources are limited, attitudes
make a difference
Such programmes do not necessarily need to
wait until cites grow rich, however. Delhi, for
example, has one of the lowest levels of GDP
per capita in the Index, at an estimated
US$2,000. Yet the city still achieves an average
overall rating, with a particularly strong result in
the waste category, where it ranks above average. This is in part because of residents’ attitudes towards consumption and recycling. As
the city portrait in this report notes, Delhi’s “traditional culture of careful consumption”, which
economic growth has not yet eroded, helps
explain why Delhi leads the Index with an extraordinarily low per capita waste generation figure of 147 kg per year. The city’s advanced policies, including one of the more robust
strategies in the Index to reduce, re-use and
recycle waste, also demonstrate just how much
can be achieved with limited resources. Delhi
shows that less well off cities do not need to
wait to get rich before adopting policies and
shaping attitudes towards sustainability.
Policy execution
differentiates the bestperforming cities
G
overnments in the 22 cities in the Index,
despite varying performances on quantitative indicators, appear to be convinced of the
need to improve the urban environment. Most
cities have comprehensive policies in place for
almost every environmental area evaluated in
the Index. Uniformity at the policy level also
helps to explain why cities in the Asian Green
City Index perform so much more consistently
overall. Fourteen of the 22 cities in Asia, for
example, appear in the same performance band
for at least five of the eight categories. In Latin
America, by contrast, the cities showed much
more varied results, even though income levels
are more homogeneous than in Asia. Results
from the Latin American Green City Index
showed that cities there are hindered by focusing on immediate, pressing problems rather
than taking a long-term holistic approach. With
policies so common in Asia, one differentiator in
the Asian Green City Index is the ability to execute and enforce those regulations and standards. Professor Yue-Man Yeung, emeritus professor of geography at the Chinese University of
Hong Kong, notes that “the most important
thing that you must have for a city to clean up is
political will.”
Singapore, the only city to achieve a well
above average overall score, illustrates this point.
If Singapore were scored only on quantitative
measures, it would have ranked one band below,
at above average. But it is comprehensive and
effective policies that elevate the city to rank well
above average overall. A rich city-state, Singapore
has access to resources, but unlike other cities in
the Index, the government is not split between
competing levels of administration. And it has a
highly trained civil service, along with a reputation for transparency, which is underlined by Singapore’s fourth place in Transparency International’s Corruption Perception Index.
Similarly, Hong Kong, with a large degree of
self-government, resources, and a capable civil
service, scores well in the Index, not because its
policies are inherently more advanced, but
because it has the capacity to carry them out.
Furthermore, the governments of Singapore
and Hong Kong have the capacity to approach
their cities as single entities, which enhances
their ability to address environmental challenges (see also interview with Nicholas You in a
separate section of this report).
City governments need
more power to make
their own environmental decisions
T
here is a growing consensus among environmental experts that decentralising authority
from national to local governments is a key way
to achieve more relevant and responsive envi-
15
Asian Green City Index | Overall key findings
ronmental oversight. The Asian Development
Bank states, “although central-local relations are
being reconfigured in many different ways, it is
quite clear that local, sub-national areas are now
overwhelmingly regarded as the site for effective governance.” In addition, Dr Xuemei Bai,
senior science leader for sustainable ecosystems
at CSIRO, Australia’s national science agency,
points out: “Urban government is the crucial
level in addressing the urban environment.”
There have been fears, according to the World
Bank, that decentralisation of authority could
lead to deterioration in key public services, but
at the same time it notes that in East Asia especially, the effects “appear to have been largely
benign so far.” However, Dr Bai says that
although national governments in Asia have
given formal authority to cities in recent years,
they have not always handed over adequate
funding to meet new responsibilities, and so
governments have faltered. Brian Roberts, professor emeritus at the University of Canberra
and former chief technical adviser for the United
16
Nations, adds that although in countries such as
India, which has a history of a federal structure,
cities might have some power, the trend across
Asia is that local governments are “incredibly
weak”. He says that too often, instead of real
power being transferred to localities, there is a
“decentralisation of corruption.” He and others
believe that more decentralisation is required to
make further environmental progress in cities,
but with the accompanying fiscal clout to
enforce regulations and invest in initiatives.
China’s environmental
performance: Looking
beyond air quality and
carbon emissions
I
n 2009 China overtook the US as the world’s
largest energy user, and for several years previously it already held the dubious distinction of
producing the most greenhouse gases. The Chi-
nese government, in its latest report on the state
of the environment, spoke of “very serious”
water pollution, “grave” results from acid rain,
and “serious” air pollution problems in some
urban areas. Of the country’s 113 key cities for
environmental protection, 43% are at or below
the lowest national air quality rating, Grade III. It
should also be noted that China’s Grade III standards for nitrogen dioxide are twice the World
Health Organisation’s recommended healthy
levels, and for particulate matter over seven
times more. The Grade III sulphur dioxide standard is more than 12 times higher. China’s poor
environmental record can be attributed to
explosive economic development, as a result of
being the “factory to the world”. The environmental challenges include an energy supply
heavily reliant on coal, factory emissions, dust
from construction and an increase in automobile traffic. So it is no surprise that the five
mainland Chinese cities in the Index, Beijing,
Guangzhou, Nanjing, Shanghai, and Wuhan are
also the five cities with the highest energy con-
sumption per $US of GDP. And three of the five
cities have the highest CO2 emissions per capita.
Similarly, all the cities finish in the bottom half of
the Index for their levels of airborne particulate
matter, nitrogen dioxide and sulphur dioxide.
These statistics are only part of the story,
however. Even with below and well below average results in the quantitative indicators for
energy and air quality in the Index, the five
mainland Chinese cities fall into the average
band in the Index overall.
Two factors help explain this. First, in some
environmental areas, Chinese cities are doing
reasonably well. Beijing, for example, collects an
estimated 95% of its waste, the eighth best figure in the Index. And Shanghai has the sixth lowest water leakage rate in the Index, at 10%, versus the Index average of 22%. Meanwhile,
Nanjing generates the third lowest amount of
waste per capita, at an estimated 218 kg annually. And Guangzhou, Nanjing and Beijing come
first, second and fourth, respectively, for the
amount of green spaces per person, although
the way the cities draw their official boundaries
plays some role in their results for green spaces.
Second, the Index rewards policy as well as statistical performance, and here Chinese cities are
strong. All are in the average band when only
policies are taken into account, and all but
Wuhan are above average in transport policy.
Even on air quality, Shanghai scores above average in policy terms, with an established air quality code and regular monitoring.
The Chinese performance regarding policies
suggests that the authorities take the environment seriously. A major step forward for Beijing,
for example, was hosting the 2008 Olympics. In
the run-up to the event, with the world’s attention on the city, the national and city governments invested heavily in improving air quality,
landscaping and transport. Prof Yeung of the
Chinese University of Hong Kong also notes a
perceptible change across the country. “Not too
long ago,” he says, “the motto was ‘develop
first, clean up later.’ This is no longer considered
acceptable. On green policy, garbage collection,
other areas, some cities are doing very well.”
However, the rapid growth of automobile traffic
has held cities back. Prof Yeung notes that about
30 big cities in China are building subway systems, which is a positive development, but construction is not keeping pace with the growth of
automobiles. The number of cars in Wuhan, for
example, has tripled to 1 million in the last
decade. Prof Yeung says, “Things are going both
ways in Chinese big cities.”
China’s economic development is bringing
huge environmental challenges, but a closer
look at its cities reveals a nuanced picture, with
some areas of success and seriousness about
policy that should yield improvements in the
long run. “With increasing levels of income,
infrastructure investment will increase, basic
issues like sanitation will improve, but more
urban dwellers are joining cities daily,” says Dr
Bai of Australia’s national science agency. “There
is a huge need to provide housing and other services. Most cities will continue to struggle with
competing interests.”
17
Asian Green City Index | Key findings from the categories
Key findings from the ca tegories
Energy and CO2
E
nergy consumption and carbon emissions
are rising as emerging economies develop,
especially in China. However, most cities in the
Index are responding with proactive policies to
limit greenhouse gases and use energy more
efficiently.
➔ Average carbon emissions in the Asian Green
City Index are 4.6 tonnes per person, which
compares well with the European Green City
Index average of 5.2 tonnes per person.
➔ Cities using the least energy tend to have the
lowest incomes, but when income rises above
about US$20,000 in GDP per person, average
emissions decline.
➔ The share of renewables in electricity production for Index cities is 11%, much lower than
the figure for Latin America, at 64%, where
hydropower is much more common. In addition, only about 3% of the energy these cities
use on average is from renewable sources,
which is less than half of Europe’s average share
of 7%.
18
➔ Governments are trying to improve their
renewables performance. All 22 cities in the
Index have invested in energy efficiency and
clean energy sources. Twenty cities have formal
energy strategies, and have also invested in
waste-to-energy projects.
➔ There is more to be done, however. While 18
cities have a climate change strategy, only 12
have conducted a baseline review of greenhouse gas emissions in the last five years and
just ten engage in regular greenhouse gas monitoring.
Land use and
buildings
L
iving conditions in Asian cities vary enormously. Mumbai, the densest city in the
Index with 27,000 people per square kilometre,
is more than 27 times more tightly packed than
Wuhan, which has fewer than 1,000 people per
square kilometre. The variation in green spaces
is even greater, from 2 square metres per person in Kolkata, to 166 square metres per person
in Guangzhou. But the Index shows a consensus is forming on the required elements for successful sustainable land use and building policies.
➔ Different regulatory systems and development histories explain most of the divergence in
population density and green spaces. China, for
example, places more outlying, undeveloped
land within official city boundaries.
➔ Income is less of an issue with regard to land
use. For example, Tokyo, with a GDP per person
of US$70,800, and Hanoi, with a GDP per person
of US$1,700, have roughly the same amount of
green spaces per capita.
➔ Despite the variety of conditions, every city
has policies to promote energy efficiency, incentives for homes and businesses to save energy,
and policies to protect green spaces and contain
urban sprawl. All but a few also have full or partial eco-building standards for private and government buildings.
➔ Policies do not need to be expensive or tech-
nologically difficult. The city portraits show, for
example, that tree planting is becoming a common environmental activity, especially for cities
with lower incomes.
Transport
T
raffic management and congestion reduction policies are widespread and comprehensive in all but the poorest cities. On the
other hand, with only a few exceptions, the
richest cities have the best superior public
transport infrastructure (defined in the Index as
transport that moves large numbers of passengers quickly in dedicated lanes, such as metro,
bus rapid transit or trams). However, an assessment beyond policy indicators was difficult
since many cities lacked reliable data on the
overall length of bus networks or the percentage of journeys taken by car, train, cycle or on
foot.
➔ Every city in the Index has an urban mass
transport policy and makes investments to
reduce emissions from mass transport. All but
two cities promote greener forms of transport.
Transport pricing systems are integrated in most
cities, with the exception of poorer ones.
➔ All but a few cities have traffic management
systems, with traffic light sequencing, traffic
information systems, and multiple access points
for entry. Congestion reduction is common as
well: 16 cities have road charges, pedestrian
areas and park and ride systems.
➔ Although wealthier cities have longer superior public transport networks, such as metros or
trams, Jakarta was an exception, employing
“bus rapid transit” as its main superior network,
a lower cost alternative to rail, and an idea which
originated in Latin America and is widespread
there.
Waste
A
sian cities produce less waste per capita
than Europe and Latin America, but waste
collection is less effective. Proactive policies in
wealthier cities have helped keep waste generation in check.
➔ The 22 Asian cities generate an average of
380 kg of waste per person per year, compared
with 465 kg in Latin America and 511 kg in
Europe.
➔ Every city in the Asian Green City Index has a
strategy to reduce, recycle or re-use waste. The
vast majority have environmental standards
governing waste disposal sites and for industrial
hazardous waste. Most cities also monitor illegal
waste dumping.
➔ Every city has recycling programmes covering a comprehensive range of materials including organic waste, electrical items, glass, plastics and paper.
➔ Waste collection is weaker. Only seven cities
collect and adequately dispose of more than
99% of waste, and on average the figure is 81%,
compared with 96% in Latin America.
➔ Waste picking is the biggest policy challenge. Only six cities have comprehensive regulations.
19
Asian Green City Index | Key findings from the categories
Water
W
ater consumption rates in the Asian Green
City Index are similar to Latin America and
Europe. In addition, water quality and sustainability policies are widespread in Asian cities.
Basic infrastructure is a problem for poorer
cities.
➔ The 22 Asian cities use an average of 277
litres of water per person per day, which is slightly higher than the figure for Latin America, 264
litres, but lower than the figure for Europe, at
288 litres.
➔ The average water leakage rate in Asian
cities, at 22%, is slightly lower than Europe’s,
23%, but significantly better than Latin America’s, at 35%. Wealthier cities have very good
leakage rates. For example, Tokyo’s figure of 3%
is lower than any city in Latin America or Europe.
Poorer cities have difficulties. Four of the cities
with low incomes (under US$10,000 in GDP per
capita) lose over a third of water in the system to
leakage.
➔ Water meters, grey water recycling, and rain-
20
water collection are nearly universal, although
water stress is an issue in only about half of
cities.
➔ Every city has water quality codes and standards, and policies to publicly promote water
efficiency.
Sanitation
A
mong the eight individual categories, the
sanitation category sees the widest performance gap between top-performing and bottom-performing cities. The divide reflects differences in infrastructure, which are closely related
to wealth.
➔ The overall average rate of access to sanitation is 70%, less than in the Latin American
Green City Index, at 93%. However, the percentage of wastewater treated is higher in the 22
Asian cities than in Latin America, at 60% for
Asia compared to 52% in Latin America.
➔ Six of the seven wealthiest cities in the Asian
Green City Index have sanitation access rates of
99% or more, and five of the seven wealthiest
cities treat nearly all of their wastewater. Cities
with lower income fare much worse. In nine of
the 11 cities with the lowest incomes in the
Index (below US$10,000 in GDP per capita), an
average of 49% of residents have access to sanitation and an average of just 36% of wastewater
is treated.
➔ Most cities in the Index have environmental
codes covering sanitation, as well as minimum
standards for wastewater treatment. Most also
monitor on-site sanitation systems in homes or
communal areas. However, only nine cities fully
promote public awareness about the proper use
of sanitation systems, and eight of these cities
have the highest incomes in the Index.
Air quality
A
ir pollution is a serious problem across Asia,
with average levels of the three pollutants
evaluated in the Index exceeding the safe levels
set down by the World Health Organisation
(WHO). However, most cities are addressing the
problem with government policies. Cities with
higher incomes perform better for sulphur dioxide emissions and particulate matter, but nitrogen dioxide levels — a primary source of which
is automobiles — show no correlation with
income.
➔ Particulate matter is the biggest air quality
challenge identified in the Index. The average
annual daily concentration of particulate matter among the 22 cities is 108 micrograms per
cubic metre, which is more than five times the
WHO’s recommended safe level of 20 micrograms. No cities in the Index are below the
guideline.
➔ The annual average daily concentration of
nitrogen dioxide among cities in the Index is 47
micrograms per cubic metre, also well above
the WHO’s recommended safe level of 40. Only
six cities are below that benchmark.
➔ The annual average daily level of sulphur
dioxide — a primary source of which is fossil
fuels burned to generate power — is 23 micrograms per cubic metre. The WHO’s safe guide-
line for sulphur dioxide is in the form of a 24hour average rather than an annual average,
which would be even lower. Even so, the Index
annual average still exceeds the WHO’s 24-hour
average of 20 micrograms.
➔ Clean air policies are widespread though. All
cities have a code to improve air quality, and all
cities conduct air quality monitoring.
➔ Policies can make a difference if executed
correctly. Yokohama and Tokyo used to have
much more polluted air until city authorities
tightened regulations.
Environmental
governance
departments with broad responsibilities, and the
legal capacity to implement regulations.
➔ Environmental monitoring and providing
public access to environmental information is
nearly universal, except among a few lower
income cities.
➔ The involvement of citizens, non-governmental organisations and other stakeholders in
decisions about projects with environmental
impacts is widespread and growing, even in
China, where there is traditionally less scope for
such input.
➔ Split jurisdictions can create difficulties: the
municipal structure of Metro Manila, for example, causes notable variation in environmental
governance among municipalities within the
metropolitan area.
M
ost municipal governments across the
region have established institutions for
environmental governance. Divided authority
between jurisdictions and a lack of administrative expertise to implement policies are ongoing
challenges to effective oversight.
➔ Index cities generally have environmental
21
Asian Green City Index | Managing the city as a ‘living organism’
Managing the city as a ‘living organism’
An interview with Nicholas You, urban environmental expert
The path to greener cities, says Nicholas You, requires rethinking how
we manage them. Holistic planning too often suffers from a sectorby-sector approach across competing jurisdictions, and policymakers
fail to see the city as a single entity. Mr You is chairman of the Steering Committee of UN-Habitat’s World Urban Campaign, a platform
for private and public organisations to share sustainable urban
policies and tools. He also leads several other global sustainable development initiatives, and served on
the expert panel that advised the Economist Intelligence Unit (EIU) on the methodology for the Asian
Green City Index. He spoke to the EIU about the results of the Index, the difficulty of measuring the
environmental impact of informal settlements and the necessity to administer cities as “living organisms”.
The Index results suggest that there is a
very strong correlation between income
and environmental performance in Asia,
with higher income cities performing
better. However, the results also show that
once cities reach about US$20,000 in GDP
per capita, their levels of carbon emissions, water consumption and waste
generation do not keep rising with income.
Have you seen evidence for this phenomenon more widely in Asia?
I think there is a certain amount of veracity in
this correlation. How much is due to environmental awareness and how much is due to
technological progress is subject to debate. But
generally speaking as cities reach a certain level
of wealth, their inhabitants will demand value
for money and that includes clean air, clean
water and a liveable urban environment.
Although wealth is important for environmental performance, what kinds of initiatives or activities can lower-income cities
undertake to improve their environmental
performance?
In economic terms, cities in lower-income
countries have the most to gain from adopting
environmentally sound and sustainable policies
22
and practices. Such initiatives can substantially
reduce waste, improve efficiency and create
jobs and income generating opportunities. A
typical example is waste recycling and reuse. In
many cities in developing countries, this is
carried out by scavengers working and living in
deplorable conditions. The right mix of policies,
participation and empowerment could result in
win-win situations whereby waste is recycled
into usable products; methane is captured to
produce green energy; and the scavengers no
longer have to work in life-threatening
conditions.
Chinese cities perform poorly as expected
for carbon emissions and air quality. But
they perform perhaps better than expected in other environmental areas, and are
particularly strong on environmental
policies measured in the Index. How would
you evaluate China’s current approach to
balancing growth with sustainability?
The context of carbon emissions in Chinese
cities is different to the situation in Europe or
North America. Cities in the west typically
account for 70% of energy consumption, of
which 70% is used for heating, ventilation, air
conditioning and lighting of buildings. Reduc-
ing carbon emissions therefore depends to a
large extent on reducing energy demand and
changing consumption patterns. In Chinese
cities, more than two thirds of energy consumption is used for industrial production. The
average urban consumer is actually quite frugal,
and a sizeable portion of the rural population
remains off grid. The focus for carbon emissions, for the foreseeable future, is on reducing
energy intensity in industrial production, while
at the same time accepting an increase in
household energy consumption. While this
may appear contradictory, it is perfectly justified, since access to energy is critical to improving quality of life and economic productivity.
What is missing, however, is a comprehensive
framework for urban sustainability. Such a
framework, which is equally valid for all cities
worldwide, must look at how we can help foster
compact and complete communities that avoid
urban sprawl and reduce reliance on individual
motorized transport.
Informal settlements clearly affect a city’s
environmental footprint. Yet by their
nature, informal settlements are not well
covered by statistics. For that reason the
Economist Intelligence Unit could not
include data about informal settlements in
the Asian Green City Index in a way that
was methodologically sound. How might
this affect the overall environmental
picture of cities in Asia, and how exactly do
informal settlements affect the environmental performance of a city?
Informal settlements are, by definition,
unsustainable. They represent a high degree of
social and economic exclusion. Milton Santos,
one of the most advanced thinkers of his time,
said that poverty is the worst form of pollution.
Informal settlements are living proof that we
are not planning our cities well.
Often cities report high levels of access to
basic services, such as potable water,
waste collection and sanitation, when the
situation on the ground may be very
different because of the presence of
informal settlements. What are the
implications for trying to get an accurate
picture through data?
If you are looking at indicators, such as water
consumption per capita or waste generation per
capita, and leave out informal settlements,
you’re leaving out part of the picture. The water
company has a remit, and the sewage company
has a remit, and their remits do not typically
include informal settlements. They rightly say
“100% coverage”, while the city as a whole may
drop down to 70% access. Since the Green City
Index is comparative within a region, that is,
comparing Asian cities with each other, the
distortion won’t be that serious. If we compare
across regions, we have to be a little more
careful.
What are the objectives of UN-Habitat with
respect to improving statistics on informal
settlements?
UN-Habitat has been trying to show that the
methods being used do not provide an accurate
picture of what is happening when it comes to
informal settlements. It will take years to
change the way statistical offices work and
census data is taken. The statistical issue is, how
do you gradually refine techniques so these
problems are not overlooked. When data is
disaggregated, for example, at the household or
neighbourhood level, which UN-Habitat has
been doing for some time, we begin to see
another picture of reality. A common syndrome,
for example, is that we often confound proximity with access. People living in informal
settlements may literally be living next door to
water supply, sewerage and garbage collection
services, or for that matter to schools and hospitals, yet not have access to these services.
Can we identify any common approaches
in the way cities are addressing the
challenge of informal settlements?
I believe that we are beginning to see an
emerging pattern which favours upgrading
informal settlements, as opposed to removal
and demolition. Slums are communities with
their own social, cultural and economic
networks. A lot of the reason why people don’t
move from the informal settlement is because,
in terms of location, they are ideal, with access
to jobs, or services they would otherwise have
to pay considerably more for. Most slums started
their life located on the margins of the city. Over
time, with rapid growth, the slum actually finds
itself located in the middle of the city. Removal
or relocation is also asking people to move from
a neighbourhood where they have lived a good
part of their life, if not their whole life.
What kinds of upgrades are cities undertaking?
Upgrading takes place on several fronts —
hooking the settlement into the infrastructure
grid, and providing waste collection, water and
sanitation. There is also an issue of tenure. Most
of the time an informal settlement remains
informal because it is not clear who owns or has
the right to the land. The service provider, the
water or sewerage company, for example, is
very reluctant to put in infrastructure if tenure is
not clear.
What incentives do cities have to upgrade
rather than remove the settlements?
The cities that are trying to play a proactive role
realise that globalisation is affecting everyone,
everywhere. They can become victims of
globalisation, or get some of the benefits. The
proactive cities realise you can’t have high
percentages of your population socially
excluded and expect to be a global city.
In general, how can city planning be
improved?
For many years I headed a best-practice initiative at UN-Habitat, and we found literally
hundreds of examples of innovations, new
models, new technologies. The single biggest
question I had to ask myself all the time was,
‘Why aren’t these best practices becoming the
norm?’ The only answer I came up with is that
the lessons from best practices are not being
fed into policymaking at the highest level.
They remain isolated initiatives that might
inspire a few other cities, but they don’t
necessarily have an impact on public policy,
and therefore don’t get replicated at scale. We
need to realise there is a lot of innovation out
there. How can we systematically document
these stories and record the lessons learned,
and provide a feedback mechanism directly
into policy?
The World Urban Campaign is working on an
initiative to get cities to tell their stories under a
new perspective of “living practices”. What are
you doing today to tackle tomorrow’s challenges? What innovations are being tested,
what new tools are being developed?
What are the most important steps that
cities in Asia and the rest of the world have
to take to become more environmentally
sustainable?
We have to take planning seriously. I don’t mean
‘sectoral’ planning, where each sector — water,
energy, waste, sanitation — plans independently. We must look at the city or the metro region
as a whole. Competing jurisdictions are one of
the biggest enemies to sustainable urbanisation. You have metropolitan areas cutting across
many jurisdictions, with several planning
commissions and independent service
providers. You could be busy trying to green
your city, but half of the population that
depends on your city may live in the suburbs
and fall under a different governmental
structure; and these governments are busy
building the next shopping mall, the next golf
course, the next exburb. The city is a living
organism that needs to be managed as a single
entity, and just like any living organism, it needs
to develop holistically.
23
Asian Green City Index | Exemplar projects
Exemplar Projects
Energy and CO2
Tokyo: The first cap and trade system in Asia
Tokyo performs reasonably well in the Index
regarding carbon emissions: it finishes 11th for
emissions per capita and first for energy consumed per unit of GDP. The city’s ambitious policies, however, are what really sets it apart.
Rather than wait for a national programme,
the city created its own mandatory cap and
trade system, the first in Asia, as part of its own
wider climate change strategy. The system came
into effect in April 2010, and aims to cut emissions by 25% from 2000 levels. All organisations
that use the energy equivalent of 1,500 litres of
oil annually for fuel, heat and electricity are
required to participate. In the first five years to
2015, those in the scheme will need to reduce
emissions by 6% (from their average level of
emissions between 2007 and 2010). In the following five years they must cut an additional
17%. Those who make bigger reductions are
allowed to sell credits. The city says that the sys-
24
tem is unique because it is the first to cover all
major buildings, including offices, hospitals,
universities and government buildings.
One reason for the system is the local government’s desire to address the city’s own emis-
sions, which are estimated to be roughly the
same size as Denmark’s or Norway’s. Just as
important, however, is that the city is trying to
encourage the adoption of such schemes on the
national and international stage. For example,
Ideas from other cities
Osaka is making concerted efforts to use solar energy to reduce its carbon emissions. In 2009 the municipal
government began offering subsidies for the installation of solar power systems, with homes eligible for up to
US$3,400 and offices US$17,000. The city is also deploying floating, solar-powered water purifiers on the
Dontonbori canal that can each clean 2,400 litres per day. Osaka’s biggest solar venture is Japan’s first commercial solar electric plant, with a 10-megawatt capacity, to be built on the artificial island of Yumeshima in
the city’s harbour. Bangkok is promoting the use of biofuels. The authorities aim to increase the proportion of
gasohol — a mixture of gasoline and ethanol — in the fuel mix (the total of all fuels consumed) from less than
20% in 2007 to 50% by 2012. They are also funding the purchase of used cooking oil for refinement into biodiesel. Mumbai has a fragmented energy delivery market which makes overarching conservation projects difficult. In September 2009, the Mumbai Energy Alliance was formed. It is a partnership between the Mumbai
government, the International Institute for Energy Conservation, and others, including energy companies, to
implement energy efficiency programmes in the region. A pipeline of proposed projects is expected to reduce
carbon dioxide emissions by 13 million tonnes.
Tokyo publicly contrasts its own mandatory
efforts with the voluntary ones of the Japanese
government.
Shanghai: The largest offshore wind farm
in China
Shanghai, which currently produces only about
2% of its electricity from renewable sources —
and almost all of that from hydropower — is
making massive investments in wind power. The
city built its first wind power station in 2003 and
by 2007, it had three sites with a total of 24
megawatts of capacity, producing enough electricity to power an estimated 24,000 households. In 2008, one of the three plants, located
in a wetland reserve, was expanded from 4.5
megawatts of capacity to 19.5 megawatts, which
could provide power for an additional 15,000
households from that single site.
The city’s future plans are even more ambitious. By 2020, officials expect to have a total of
13 wind farms producing a total of 2.1
gigawatts of total installed capacity, providing
electricity for more than 4 million households.
One of the largest of these is the Donghai
Bridge Wind Farm, located about 5 miles offshore in the East China Sea, which began feeding electricity into the grid in July 2010. The
US$340 million project has 34 turbines, each
with 3 megawatts of capacity, and is the first
offshore wind farm in China, and the world’s
first major offshore wind farm located outside
of Europe. It is capable of providing about 1% of
the city’s total power production; and is expected to cut coal use by 100,000 tonnes per year
and thereby reduce carbon emissions by
246,000 tonnes annually.
Land use and buildings
New technology: The world’s greenest skyscraper in Guangzhou
Skyscrapers spring up almost overnight in
China, and the results are not always environmentally unsustainable. When the 71-storey
Pearl River Tower in Guangzhou is completed,
which is expected in 2011, it will be the largest
zero-emission building in the world.
The tower’s environmental performance
will come from a range of features. The most
striking is its curved design, which funnels
wind towards turbines that provide 4% of the
building’s energy. Equally important are features which reduce energy consumption. Solar
panels on the roof supply power to automated
window blinds that reduce the sun’s impact
inside the building. Meanwhile, the skin of the
building includes an air gap that traps heat; the
warm air then rises and is harvested in heat
exchangers. The cooling features mean that
the air conditioning system is 80% smaller than
for a conventional building of its size. That
goes a long way towards making the whole
structure 58% more efficient than a traditional
skyscraper. Looking beyond energy, a rainwater collection system, combined with the solar
panels, will provide warm water to the building. Overall, the Pearl River Tower is so rich in
ideas that it is well worth studying by other
Asian cities.
25
Asian Green City Index | Exemplar projects
Old technology: Planting trees in Beijing
Beijing has serious air quality challenges, with
levels of nitrogen dioxide, sulphur dioxide and
suspended particulate matter that are all above
the Index averages. In addition, it has had an
increasing number of sandstorms in recent
decades, especially in the spring, as the northern desert has crept steadily closer. To address
this problem, the local government has encouraged green spaces as one part of the solution.
The most high profile element of these
efforts is the “Voluntary Tree Planting Day”. The
26th annual event in 2010 saw some 2 million
residents, including the president and most
senior officials, out planting trees. This event is
only the most visible part of a broader policy
Ideas from other cities
Hanoi has adopted a long-term strategy to turn itself into a “green, civilised and modern city” by 2050, which
will involve setting aside up to 70% of the city’s natural territory for “tree and water space.” In 2010, Osaka
planned to more than quadruple the number of its so called green “curtains” for the walls of public buildings
and “carpets” for the roofs to 485. It creates these by planting vegetables, such as bitter melons and sweet
potatoes, on the roofs and walls of city hall headquarters, primary and middle schools, ward offices, and other
public facilities in the city. This eases the city’s “heat island phenomenon,” which occurs when a metropolis is
much warmer than surrounding areas. Residents of Nanjing so rarely have central heating that they frequently reverse their air conditioning units in the winter to heat their accommodation — a highly wasteful approach. The city is therefore setting up community heating systems for new residential blocks that use excess
heat from electricity generating facilities.
26
that involves creating green belts of trees and
flowers bordering several of the main ring
roads, green separation belts between sections
of the city, specific gardens and green spaces
where people gather, and the greening of 1 million square metres of rooftop. The goal is that a
resident will never be more than 500 metres
from a green space.
Progress has been steady, and accelerated in
preparation for the 2008 Olympics. The city’s
green area — that which is covered by lawns,
and the shadow of trees and bushes — rose
from 36% in 2000 to 43% in 2007, and has since
then reached just over 50%. In comparison, the
figure for London is 63%. Although this may
not prevent sandstorms, it makes for a much
more liveable city in such close proximity to a
desert.
Transport
Shanghai: Doubling the size of the world’s
longest metro
Shanghai’s metro has grown at a stunning rate.
The city opened its first line, which covered only 20
km, in 1995. For most of the last decade, it has
invested US$4.5 billion per year and now has a system with 12 lines, 268 stations, and 420 km of
track, making it the world’s longest in absolute
terms. By comparison, London has 408 km and
New York has 368 km. In August 2010, Shanghai
set its one-day record of 6.7 million travellers.The
main problem is that the metro is still too small for
the city’s almost 20 million inhabitants. Shanghai
has extensive traffic jams at rush hour, and some
metro lines can become so crowded that people
have been hired to push passengers into train carriages in order to reduce delays in stations. For the
moment, buses are taking some of the overflow.
The city has aimed to more than triple the 86 km of
exclusive bus lanes set aside between 2002 and
2008. Looking ahead, however, the metro system
will see even faster growth than before. The city is
building 140 km of new track to be opened in
2012, and expects by 2020 to have 22 lines
totalling 877 km. In effect, Shanghai is adding the
equivalent of the longest system of any city in the
world to its already record-breaking network.
Green transport: A holistic approach in Singapore
Singapore already has a strong foundation in
sustainable transport, and achieves an above
average ranking for the category in the Index.
Ideas from other cities
Hong Kong’s Mass Transit Railway (MTR) became the world’s first heavy rail train line to use automated, driverless
technology when it introduced it on a 3.8 km route from Sunny Bay Station on the main airport line to the Disneyland
Resort. Automation is more energy efficient because trains on the line achieve one of the highest average speeds on
the MTR, at 55 km per hour, even though other lines on the system are allowed to reach much higher peak speeds
when possible. Other efficiency measures on the line include: automatic adjustment of train service frequency based
on the number of passengers actually waiting; and use of natural light and open ventilation in stations to reduce energy consumption. Wuhan took a step towards integrating its public transport services by introducing a card that
provides discounted fares on ferries, buses and its metro system. Jakarta is planning to add seven more lines to the
eight which already make up the city’s TransJakarta Busway, a tram-like “bus rapid transit” service which first opened
in 2004. The service carries passengers in modern air-conditioned buses in dedicated bus lanes which currently cover
124 km. Not only is the service the fastest way to get through the city’s traffic-clogged streets, but the buses also use
biodiesel, which emits less CO2 than conventional diesel or compressed natural gas. The Osaka city government is
installing rapid chargers for electric vehicles at 10 locations, including the main city office’s car park.
27
Asian Green City Index | Exemplar projects
However, improving the city’s performance even
further remains a strong priority on an island
where roads take up 12% of the island’s total
land area, and the transport sector accounts for
about 13% of total energy consumption, as well
as 50% of fine particulate matter in the air.
In response, the city has devised a comprehensive, integrated strategy for the next two
decades that aims to both lower the city’s
environmental footprint and improve the travel
experience for residents. The city’s plan calls
for increasing the share of morning commuting
journeys on public transport to 70% by 2020,
up from 59% in 2008. Officials will invest
US$40 billion to double the rail network, from
142 km to 278 km by 2020, and plan to develop
more connections between bus and rail services. Bus operations will be further centralised,
with more feeder buses connecting to main
routes, more exclusive priority lanes for buses,
and real-time public transport information
online and through mobile phones. The city has
already halved its limit on the annual growth of
28
the vehicle stock, from 3% to 1.5%. A number of
other initiatives are also in the pipeline, including piloting diesel-electric hybrid buses, revising
fuel duties, improving emissions testing and
investing US$43 million to create new cycling
paths.
Waste
Hanoi: Making waste pay
Much of the waste central Hanoi produces goes
to landfill with little or no sorting. In some districts the trash is simply thrown into lakes. This
will soon change. The Advanced International
Company, under a 50-year “build-operate-transfer” arrangement with Hanoi, is scheduled to
open a US$31 million, 15-hectare waste-processing plant this year that can handle 2,000 tonnes
of solid waste per day. After the time period expires, the operation becomes city property.
The plan is to separate waste into three
types. First, organic waste, which the company
estimates constitutes 40% to 50% of Hanoi’s
garbage, will undergo anaerobic composting in
order to create fertiliser. According to the company, this method is much cheaper than burning waste, and Malaysian plantations have already expressed an interest in the output.
Second, recycled waste, such as rubber, plastic
and metals, will be packaged and sold to companies in Malaysia, Singapore and Thailand. Finally, some of the other waste can be processed
for use as construction material. The company
expects that only 15% of the waste going
through the plant will need to be sent to landfill, and this will be processed to do the least
harm to the environment.
In order to address this issue, the Industrial
Works Department paid two local firms
US$151,000 to develop jointly a GPS system to
track garbage shipments. It cost just over
US$650 to equip each truck, but once they
have the system on board, both the department and the companies that created the waste
can confirm whether it is transported and disposed of properly.
The system is about more than compliance:
it allows insight into the waste itself. Companies equipped with the system, for example,
gain a better understanding of the waste they
produce, and in particular, what portions they
could sell rather than throw away. GPS has also
allowed interesting academic investigations of
Bangkok’s waste collection system, with three
Japanese scientists and a Thai colleague track-
Ideas from other cities
With little room for new landfill sites, Hong Kong is concentrating on waste reduction. It imposed a US$0.06 tax on
plastic shopping bags in July 2009 to help decrease the estimated 8 billion such bags that end up in landfill annually.
Bangkok: Follow that trash
Bangkok has seen numerous instances of waste
dumped in landfill sites without proper treatment or disposed of illegally in some other way.
Many industrial waste plants also report false
figures and get rid of at least some of the
garbage they receive improperly to save money.
Wuhan is shifting its waste policy from landfill to incineration. Its Sanitation Master Plan calls for the building of five
waste-to-energy incinerators with a total capacity of 6,500 tonnes per day and an output of around 150 megawatts.
Osaka’s municipal government holds a recycling contest for companies in the city, rewarding small and mediumsized enterprises for their efforts to reduce waste. Taipei City’s government runs a “Repaired Furniture Display
Area,” where officials accept discarded large items of furniture from residents which the city refurbishes and sells.
Since 2009, when the scheme began, the city has sold more than 100,000 items for US$300,000.
ing garbage trucks in order to understand
waste flow in an area on the northern outskirts
of the city.
Water
Singapore: Water as good as new
Water has long been a concern for Singapore, a
city-state with few fresh sources. Moreover,
occasional political tension with neighbouring
Malaysia, the one possible foreign source,
convinced Singapore’s leaders to pursue
greater self-sufficiency. The most innovative of
several strategies which the city has pursued
concurrently has been the purification of
wastewater, which Singapore has branded
“NEWater”.
Much of the technology has long existed,
although Singapore uses advanced forms. The
wastewater first goes through two types of filtration — micro-filtration and reverse osmosis
— which between them take out suspended
29
Asian Green City Index | Exemplar projects
particles, metals, salts and most pathogens.
Then ultraviolet light treatment kills off any remaining microbes that may have unexpectedly
remained. The resulting water is more than
pure enough to drink.
Most of the NEWater goes to non-domestic
users, such as wafer-production plants that
need a very pure supply. Nevertheless, the government made a conscious decision to pump a
small amount into the reservoir system that
Ideas from other cities
Nanjing and Beijing both face very low water supplies and are encouraging conservation in various ways. Nanjing is increasing water prices by 12% while Beijing is planning extensive work to reduce leakage in the distribution system, and is encouraging households and businesses to install water meters. Hong Kong is spending
US$2.5 billion to repair or replace 3,000 km of its 7,700 km water-main network by 2015. The government is
considering extending the program to cover the entire network after that year. To help address its high water
leakage rate, the Delhi city government has set up a leak detection and investigation unit. It began work with
sounding rods and pipe locators but is now equipped with more modern sonic and electronic equipment. In
1987, the Yokohama Waterworks Bureau, recognising that it had benefited extensively from a British engineer’s
technical assistance a century earlier, began inviting experts from developing-world cities to attend training programmes. Over more than two decades, nearly 2,000 people have participated from 35 countries. The city,
which has one of the lowest water leakage rates in the Index, also sends out experts to other countries, and has
entered into technical assistance arrangements with water departments of several developing Asian cities.
30
feeds the drinking supply. By 2011, it will make
up about 3% of what people consume. The
strategy has worked: familiarity has led to rapid
acceptance. Although the first water recycling
facility only came online in 1999, by 2007 there
were four, providing all together up to 15% of
the city’s water needs. This figure has increased
to 30% with the full completion of the fifth and
largest NEWater plant at Changi in 2010.
Environmental
governance
Eco-clubs: Educating future environmentalists in Delhi
Urban environmental sustainability is a result of
attitudes as much as anything else, and Delhi’s
environment department has been using
school “eco-clubs” to try to shape students’
views. The clubs have broad aims, and engage
students in a wide variety of projects, including
planting trees, conserving water, creating na-
ture trails and minimising waste. The clubs also
provide a convenient way to spread information
widely on environmental campaigns, such as
the city’s efforts to reduce the use of firecrackers during Diwali celebrations.
The environment department provides the
framework for the clubs, along with a small
subsidy of about US$200 to each, but the enthusiasm of the students and teachers is what
really drives the idea. There are clubs in about
1,000 schools, and among these are 100 lead
schools, each of which has a teacher who has
received instruction to train others. The lead
schools also coordinate the activities of up to
30 more schools. The clubs cover every age,
from primary schools all the way up to universities. Some are particularly active. At Salwan
Public School, for example, a primary school,
the club is an institutional member of eight
non-governmental organisations, and divides
students by interest into those interested in
land, air, water, energy, or waste management.
Students can engage in a vast range of activi-
ties, including air monitoring, water harvesting,
recycling paper, awareness-raising campaigns,
eco-tours, and even adventure sports. Thus, for
a very small investment, Delhi has been able to
harness existing interest in the environment in
a way that greatly encourages sustainability
now and will shape attitudes among residents
for years to come.
Ideas from other cities
Singapore’s Centre for Liveable Cities is a think tank established by the Singapore government in 2008. It
combines expertise from the public and private sectors and produces events, research and reports on sustainable urban development and environmental management. The Orangi Pilot project in Karachi, which has
been hailed as a success story across Asia, gives residents of poor communities the resources and engineering
expertise to help solve their own environmental challenges. The project began in the 1980s in Orangi Town,
an area within Karachi, and initially focused on sewer improvements. Within 10 years, the programme had expanded to cover not only environmental challenges, but had also led to the establishment of schools, health
clinics, women’s work centres, stores and a credit organisation to finance further projects. Today the Orangi
project model is being replicated in other cities in Pakistan, as well as Sri Lanka, India, Nepal and South Africa.
The Seoul city government runs the “Green Seoul Citizen Committee” which encourages citizen participation
in environmental policy. Established in 1995, the green committee is chaired by Seoul’s mayor and has 100
members from non-governmental organisations and businesses. Meetings take place about 120 times per
year to review new policy proposals on conservation and climate change.
31
Asian Green City Index | Methodology
Methodology
T
he Asian Green City Index measures the current environmental performance of 22
major Asian cities, as well as their commitment
to reducing their future environmental impact.
The selection sought to include the capital cities
or leading business capitals of all major Asian
countries, selected by size and importance.
Where city-specific data were significantly lacking, cities had to be omitted and this was
notably the case for Ho Chi Minh City.
The methodology, developed by the EIU in
cooperation with Siemens, builds on the work of
earlier regional Green City Indices. To be most
applicable to Asia, the structure has been adapted to accommodate variations in data quality
and availability, and environmental challenges
specific to the region. An independent panel of
international experts in the field of urban sustainability also provided important insights and
feedback in the construction of the Asian Green
City Index. Owing to concerns that the data was
insufficiently reliable or comparable to justify a
32
detailed ranking of Index results, the Asian
Green City Index results are presented in five
bands defined relative to the average score.
The Index scores cities across eight categories — energy and CO2, land use and buildings, transport, waste, water, sanitation, air
quality, and environmental governance — and
29 individual indicators. Fourteen are quantitative and measure how a city currently performs
— for example, a city’s water leakage or waste
production. The remaining 15 qualitative indicators assess policies and plans — for example, a
city’s commitment to reducing the environmental impact of energy consumption, green standards for public building projects, reducing congestion or recycling waste.
Data collection: An EIU team collected data
between April and June 2010. Wherever possible, the data were taken from publicly available
official sources, such as national or regional statistical offices, local city authorities, local utili-
ties companies, municipal and regional environmental bureaux, and environmental ministries.
The data are generally for the year 2008-2009,
but when these were not available they were
taken from earlier years.
Data quality: The availability and comparability of data across cities is far more limited in Asia
than in Europe or North America. The Index has
sought to include the most recent data available
for each city, even though this may mean that in
some cases, because of differences in the capacity of cities to gather and publish information
quickly, the comparison points are several years
apart. Where gaps in the data existed, the Economist Intelligence Unit has produced estimates
from national averages or other available, relevant data.
The EIU made every effort to obtain the most
recent data, including checking quantitative
data points with the cities’ environmental
departments. Data providers were also contact-
ed where uncertainties arose regarding individual data points.
With regard to the indicator on CO2 emissions, the Economist Intelligence Unit used
international CO2 coefficients provided by the
UN Intergovernmental Panel on Climate Change
to estimate the CO2 emissions produced by the
city’s energy mix. Only in very exceptional cases
did the Economist Intelligence Unit produce
estimates for CO2 and energy consumption on
the basis of regression analysis, referencing data
of peer cities if this data was not available for the
specific city. This was the case for Kuala Lumpur,
Karachi and Hanoi.
Indicators: In order to compare data points
across cities, and to calculate aggregate scores
for each city, the data gathered from various
sources had to be made comparable. For this
purpose, the quantitative indicators were “normalised” on a scale of zero to ten, with the best
city scoring ten points and the worst zero. Most
indicators use a min-max calculation, where the
best city receives ten points and the worst city
zero. In some cases, reasonable benchmarks
were inserted to prevent outliers from skewing
the distribution of scores. In such cases, cities
were scored against either an upper or a lower
benchmark, or both. For example, a lower
benchmark of 10% was used in scoring “wastewater treated” and all cities with less than that
figure received a score of zero for that indicator.
Cities use varying definitions for certain indicators, notably definitions of green spaces,
municipal waste generated, length of superior
transport networks, and administrative areas. In
such cases, the EIU has sought to standardise
the definition used. However, some differences
still exist and where significant these are identified in the footnotes.
Qualitative indicators were scored by analysts with expertise in the relevant city, based on
objective criteria that consider cities’ targets,
strategies, and concrete actions. The qualitative
indicators were also scored on a scale of zero to
ten, with ten points assigned to cities that meet
the criteria on the checklist. For the “greenhouse
gas (GHG) monitoring” indicator, for example,
cities were assessed according to whether they
regularly monitor GHG emissions and publish
their findings every one to three years. Selected
qualitative indicators which seek to measure the
existence of policies in certain areas — for example, the containment of urban sprawl — have
been multiplied using a rating on the city's efficiency to implement environmental policies
(Policy Implementation Effectiveness Rating).
These ratings were produced by EIU analysts
with thorough knowledge of the relevant city on
a scale of one to five, with five being highly
effective.
Index construction: The Index is composed of
aggregate scores of all of the underlying indicators. These are first aggregated by category, creating a score for each. These are in turn com-
33
Asian Green City Index | Methodology
List of categories, indicators and their weightings
Category Indicator
Type
Energy
Quantitative 25%
CO2 emissions per capita
Weight Description
and CO2
Total annual carbon dioxide emissions generated by the city from
Normalisation technique*
Min-max approximation.
total energy consumption, in tonnes per capita.
Energy consumption
Quantitative 25%
per unit of GDP
Clean energy policy
Total annual energy consumed by the city, in megajoules
Min-max.
per unit of GDP (in thousands of US$, at current prices).
Qualitative
25%
Measure of a city’s efforts to reduce carbon emissions associated
Scored by EIU analysts on a scale of 0 to 10.
with energy consumption.
Climate change action plan
Land use Green spaces per capita
Qualitative
25%
Quantitative 25%
and
buildings Population density
Quantitative 25%
Measure of a city’s strategy to combat its contribution to climate change. Scored by EIU analysts on a scale of 0 to 10.
Sum of all public parks, recreation areas, greenways, waterways, and
Zero-max; upper benchmark of 100m2 per
other protected areas accessible to the public, in m2 per inhabitant.
person inserted to prevent outliers.
Population density, in persons per km2.
Min-max; upper benchmark of 10,000
persons per km2 inserted to account for
differences in territorial definitions.
Eco buildings policy
Qualitative
25%
Measure of a city’s efforts to minimise the environmental impact
Scored by EIU analysts on a scale of 0 to 10.
of buildings.
Land use policy
Qualitative
25%
Measure of a city’s efforts to minimise the environmental
Scored by EIU analysts on a scale of 0 to 10.
and ecological impact of urban development.
Trans-
Superior public transport
port
network
Urban mass transport policy
Quantitative 33%
Qualitative
33%
Total length of all superior modes of public transport, ie BRT, tram, light
Zero-max; upper benchmark of 0.3km/km2
rail and subway, measured in terms of the area of the city (in km/km2).
inserted to prevent outliers.
Measure of a city’s efforts to create a viable mass transport system
Scored by EIU analysts on a scale of 0 to 10.
as an alternative to private vehicles.
Waste
Congestion reduction policy
Qualitative
Share of waste collected and
Quantitative 25%
33%
Measure of a city’s efforts to reduce traffic congestion.
Scored by EIU analysts on a scale of 0 to 10.
Share of waste collected by the city and adequately disposed either
Min-max.
in sanitary landfills, incineration sites or in regulated recycling facilities.
adequately disposed
Expressed in terms of the total volume of waste generated by the city.
Waste generated per capita
Quantitative 25%
Total annual volume of waste generated by the city, including waste
Zero-max.
not officially collected and disposed, in kg per capita.
Waste collection and
Qualitative
25%
disposal policy
Water consumption per capita
Scored by EIU analysts on a scale of 0 to 10.
and disposal system to minimise the environmental impact of waste.
Waste recycling and re-use policy Qualitative
Water
Measure of a city’s efforts to improve or sustain its waste collection
25%
Quantitative 25%
Measure of a city’s efforts to reduce, recycle and re-use waste.
Scored by EIU analysts on a scale of 0 to 10.
Total water consumed by the city, on a daily basis,
Scored against a lower benchmark of 500
expressed in litres per person.
litres per person per day and an upper benchmark of 100 litres per person per day.
Water system leakages
Quantitative 25%
Share of water lost in transmission between supplier and end user,
Zero-max; lower benchmark of 45%
excluding illegally sourced water or on-site leakages,
inserted to prevent outliers.
expressed in terms of total water supplied.
Water quality policy
Qualitative
25%
Measure of a city’s policy towards improving the quality of surface
Scored by EIU analysts on a scale of 0 to 10.
and drinking water.
bined into an overall score. To create the category scores, within each category all the underlying indicators received the same weight during
aggregation. The scores were then rebased onto
a scale of zero to 100. To build the overall Index
scores, the EIU assigned even weightings to
each category score so that no category was
given greater importance than any other. The
Index is essentially the sum of all category
scores, rebased to 100. The equal weighting of
each category reflects feedback from the expert
panel.
Finally, the cities were placed in one of five
bands, both within categories and overall,
reflecting the relevant scores. These bands are
built around the average (mean) score and are
defined using the standard deviation — a statistical term which is the area around the mean
that covers two-thirds of the values. The bands
are defined as follows:
➔ Well above average: Scores more than 1.5
times the standard deviation above the mean
➔ Above average: Scores between 0.5 and 1.5
times the standard deviation above the mean
➔ Average: Scores between 0.5 times the standard deviation below and 0.5 times the standard
deviation above the mean
➔ Below average: Scores between 0.5 and 1.5
times the standard deviation below the mean
➔ Well below average: Scores more than 1.5
times the standard deviation below the mean.
Clusters: In order to conduct a deeper analysis
of city trends, the 22 cities in the Index were
clustered into a series of groups, defined by the
size of the population, area, income, density and
temperature. These included:
➔ Population: “small population”, with a population below 5 million; “mid population”, with a
population between 5 and 10 million; and “high
population” with a population exceeding 10 million inhabitants.
➔ Area: “small area”, with an administrative
area smaller than 1,000 square kilometres; “mid
area”, with an administrative area between
1,000 square kilometres and 5,000 square kilometres; and “large area”, with an administrative
area larger than 5,000 square kilometres.
➔ Income: “low income”, with GDP per capita of
less than US$10,000; “middle income”, with
GDP per capita of US$10,000 to US$25,000; and
“high income”, with GDP per capita of more than
US$25,000.
➔ Density: “low density”, with a population of
less than 5,000 people per square kilometre;
“mid density”, with a population between 5,000
people per square kilometre and 10,000 people
per square kilometre; and “high density”, with a
population of more than 10,000 people per
square kilometre.
➔ Temperature: “low temperature”, with an average temperature of below 16 degrees Celsius;
“mid temperature”, with an average temperature
of between 16 degrees Celsius and 25 degrees
Celsius; and “high temperature”, with an average
temperature above 25 degrees Celsius.
Water sustainability policy
Qualitative
Sani-
Population with access to
Quantitative 33%
25%
tation
improved sanitation
Measure of a city’s efforts to manage water sources efficiently.
Scored by EIU analysts on a scale of 0 to 10.
Share of the total population either with direct connections to sewerage, Zero-max; lower benchmark
or access to improved on-site sources such as septic tanks and improved
of 20% inserted to prevent outliers.
latrines that are not accessible to the public. This figure excludes open
public latrines or sewers and other shared facilities.
Share of wastewater treated
Sanitation policy
Quantitative 33%
Qualitative
33%
Share of wastewater produced by the city that is collected and
Zero-max; lower benchmark of 10%
treated to at least a basic/primary level.
inserted to prevent outliers.
Measure of a city’s efforts to reduce pollution associated with
Scored by EIU analysts on a scale of 0 to 10.
inadequate sanitation.
Air
Nitrogen dioxide concentration
quality
levels
Quantitative 25%
Annual daily mean of NO2 concentrations.
Scored against an upper benchmark
of 40ug/m3 (EIU calculation based on WHO
target) and lower benchmark of 80ug/m3
to prevent outliers.
Sulphur dioxide concentration
Quantitative 25%
Annual daily mean of SO2 concentrations.
Scored against an upper benchmark of
10ug/m3 (WHO target) and a lower
levels
benchmark of 50ug/m3 to prevent outliers.
Suspended particulate matter
Quantitative 25%
Annual daily mean of PM10 concentrations.
Scored against an upper benchmark of
20ug/m3 (WHO target) and a lower
concentration levels
benchmark of 200ug/m3 to prevent outliers.
Clean air policy
Qualitative
25%
Measure of a city’s efforts to reduce air pollution.
Scored by EIU analysts on a scale of 0 to 10.
Environ-
Environmental management
Qualitative
33%
Measure of the extent of the city’s environmental oversight.
Scored by EIU analysts on a scale of 0 to 10.
mental
Environmental monitoring
Qualitative
33%
Measure of the city’s efforts to monitor its environmental performance.
Scored by EIU analysts on a scale of 0 to 10.
gover-
Public participation
Qualitative
33%
Measure of the city’s efforts to involve the public in environmental
Scored by EIU analysts on a scale of 0 to 10.
nance
decision-making.
*Cities score full points if they reach or exceed upper benchmarks, and zero points if they reach or exceed lower benchmarks.
34
35
Asian Green City Index | Bangkok_Thailand
sector accounts for almost 40% of the city’s CO2
emissions. There are now more than 6 million
vehicles registered in the city, up from around
4.2 million in 1999. Electricity generation, used
mainly for lighting and air conditioning,
accounts for a further third of the city’s CO2
emissions. Only about 5% of electricity is generated through renewable sources, with most
electricity coming from natural gas. However,
the city is relatively energy efficient, with energy
consumption of an estimated 6 megajoules per
US$ of GDP, which is equal to the Index average.
The city performs relatively well in terms of
clean energy policies, in particular for a strong
energy strategy and waste-to-energy investments. It has also signed up to international
covenants to reduce greenhouse gases, including the C40 group of global cities that have
pledged to make CO2 reductions.
Bangkok_Thailand
Green initiatives: The city has backed a number of energy conservation measures as part of
its global warming action plan, which runs from
2007 to 2012. Few specific details are included
in the report, but according to the document,
the city is encouraging residents to use air conditioning on an “as-needed basis”, which officials
believe could reduce electricity consumption by
nearly 800 gigawatt hours per year. Other measures mentioned in the plan include promoting
the use of energy-efficient light bulbs and appliances, but these initiatives are not mandatory.
The city is also considering a waste-to-energy
facility that would be capable of processing
3,000 tonnes of waste per day, but the city concedes that further research is needed before the
plan can move forward. This would be in addition to ongoing waste-to-energy activities conducted by the Thai Oil Public Company, which
Background indicators
Total population (million)
5.7
Administrative area (km2)
1,568.7
GDP per person (current prices) (US$)
Population density
9,095.41e
(persons/km2)
3,607.4e
Temperature (24-hour average, annual) (°C)
Data applies to Bangkok City, 1) Based on population for Bangkok
Metropolitan Region, e) EIU estimate
28.0
B
angkok, situated along the banks of the
Chao Phraya River, is Thailand’s capital and a
regional commercial and transportation hub. It
is one of the world’s most popular tourist destinations, and its services-dominated economy
accounts for nearly 30% of Thailand’s GDP, with
most heavy industry located outside the capital.
Bangkok is home to all of the country’s major
financial institutions and the regional headquarters of numerous international companies.
Bangkok faces many environmental challenges
such as urban sprawl and insufficient infrastructure to deal with a growing population. Due to
data availability, information in the Index for
Bangkok comes from a mix of figures from the
metropolitan region and the smaller city centre.
For example, indicators for green spaces and
water consumption take into account the metropolitan region, which has a population of about
12 million, while indicators for waste, transport
and air are taken from the city centre, which has
a population of about 5.7 million.
Bangkok ranks average overall in the Index.
Its best performances are in the air quality and
environmental governance categories, where it
ranks above average. In the air quality category,
Bangkok has below-average daily concentrations of the three pollutants measured in the
Index, and the city has also made particular
progress on vehicle emissions standards recently. Regarding environmental governance, the
city scores well for having a dedicated environmental department with a wide remit, and for
involving residents in environmental decisions.
The city’s performance is below average in the
categories of land use and buildings, transport,
waste, water and sanitation. Particular weaknesses in these categories include a relative lack
of green spaces, higher-than-average levels of
waste generation and water consumption, and a
low amount of treated wastewater.
Performance
buys municipal waste and converts it into gas
through decomposition and fermentation. It
then produces electricity from the gas. The city
also funds the purchase of used cooking oil for
refinement into bio-diesel.
Land use and buildings: Bangkok ranks
below average in the land use and buildings category, mainly for a relative lack of green spaces.
At 3 square metres per person across the metropolitan area, Bangkok is well below the Index
average of 39 square metres. Green spaces have
suffered at the expense of rapid urbanisation
and a general tendency to favour economic development over environmental priorities. Bangkok
is attempting to improve this situation (see
“green initiatives” below), and has implemented
policies to protect its existing green spaces and
other environmentally sensitive areas. The city
has the opportunity to bolster its eco-buildings
policies, since it currently only has a partial code
for eco-efficiency standards in new private
buildings and has no green standards for its public buildings. However, Bangkok does score well
for publicly promoting ways to improve energy
efficiency in buildings. The city’s climate change
action plan also contains a pledge to make its
buildings more energy efficient.
Green initiatives: The city is focusing on tree
planting to improve and expand green spaces.
Its climate change action plan calls for planting 3
million new trees by the end of 2012 along roadsides, canals and estuaries. In April 2010,
Bangkok’s deputy governor announced plans to
redevelop an approximately 740-square-kilometre informal settlement within the city. This will
involve building new residential complexes with
a focus on increasing park space. Adapting suc-
Bangkok
well
below
average
Other cities
below
average
average
above
average
well
above
average
Energy and CO2
Land use and buildings
Transport
Energy and CO2: Bangkok ranks average in
energy and CO2. Annual CO2 emissions are an
estimated 6.7 tonnes per person, above the 22city average of 4.6 tonnes per person. Much of
Thailand’s industrial activity takes place in zones
outside the capital city, and the city’s emissions
levels are mainly due to high rates of car ownership and electricity generation. According to the
national Ministry of Energy, the transportation
Waste
Water
Sanitation
Air quality
Environmental governance
Overall results
The order of the dots within the performance bands has no bearing on the cities’ results.
36
37
Asian Green City Index | Bangkok_Thailand
cessful sustainable informal settlement redevelopment projects from China, Japan and Singapore, the plan will be completed in stages until
2022, and will cost a total of US$1.3 billion.
Following implementation, total park area will
be increased by 320 square kilometres. Final
approval for the plan is currently in negotiations
with the Port Authority of Thailand and other
potential financial backers.
Transport: Bangkok ranks below average in
the transport category. In recent years the city
has expanded its mass transit network, which
now incorporates a 23-km elevated rail network
and a 20-km underground train network. Over
the next two decades plans are in place to build
several new lines and extensions of existing
lines, raising the length by some 350 km. In
spite of recent expansions, the length of
Bangkok’s superior public transport network
(defined in the Index as transport that moves
large numbers of passengers quickly in dedicat-
ed lanes, such as metro, bus rapid transit or
trams) remains well below the Index average, at
0.04 km per square kilometre compared to the
average of 0.17 km per square kilometre. In
addition, the city does not have an integrated
pricing system for its public transport system.
Traffic congestion also remains a serious problem throughout the city, since many residents
choose to drive rather than take public transport. However, the city is trying to address the
issue through the presence of some congestion
reduction policies including “no-car days”, road
pricing, and park and ride systems. It also has
traffic management systems, including traffic
light sequencing and traffic information systems.
Green initiatives: In May 2010 the city opened
its first bus rapid transit system, with 16 km of new
bus routes, and in August it opened a new 28-
km rail link to the main international airport to
improve its public transport network. The city also
has plans to develop more park and ride facilities, although it has given few further details.
Waste: In the waste category Bangkok ranks
below average, due mainly to the large of
amount of waste the city produces and the relatively low percentage it collects and disposes of
adequately. The city generates 535 kg per person, versus the Index average of 375 kg per person, and only collects 63% of it, versus the Index
average of 83%. Much of Bangkok’s waste is disposed of in landfills after being transported to
one of three sorting yards, but officials are concerned that landfill space is running out. There
are plans in place to build an incinerator within
the next decade. Although the city’s approach to
waste has suffered in the past because of a lack
of initiatives to encourage residents to reduce
waste and recycle, the city is marked up in the
Index for having a waste strategy in place. It also
performs well for enforcing hazardous waste
standards, and for its recycling services, which
include on-site collection and central collection
points throughout the city.
Green initiatives: The city’s Industrial Works
Department paid two local firms US$150,000 to
jointly develop a GPS system to track garbage
shipments in its trucks. Once trucks are fitted
with the system, which costs about US$660 per
vehicle, the department and the companies that
own the trucks know whether waste is transported and disposed of properly.
Water: Bangkok ranks below average in the
water category. Its performance reflects the
city’s relatively high level of water consumption,
at 340 litres per person per day, compared to the
Index average of 278 litres. The high consumption rate is due in part to abundant water
resources, with about 90% of the city’s supply
coming from treated water from the Chao
Phraya and the Mae Klong rivers. The quality of
river water is deteriorating from pollution, however, and intense groundwater pumping for the
rest of the water supply has resulted in land subsidence and salinity contamination. Leakages in
the water system are also a problem, with
Bangkok losing around 35% of its water supply,
compared to the 22-city average of 22%.
Bangkok’s water quality policies are strong, suggesting the city is addressing the issues. It is
marked up for its water quality code, and it monitors surface water quality, although its standards on industry are weaker.
Green initiatives: In September 2010, city officials announced a plan to charge fees on water
consumption in 20 districts in the city, which
house a total of about 500,000 residents, to
begin by early in 2011. The city believes the fees
will encourage conservation. The fee will start at
about US$0.03 per cubic metre in the first year,
and in the third year rise to US$0.06 per cubic
metre, the maximum to be charged under the
plan. Households that use less than 10 cubic
metres of tap water per month will not be
charged. A wastewater fee already applies to
hospitals, hotels and businesses, at between
US$0.13 to US$0.16 per cubic metre.
Sanitation: Bangkok ranks below average in
the sanitation category. Only an estimated 51%
of Bangkok’s residents have access to sanitation,
versus the index average of 70%. Bangkok also
lacks adequate wastewater treatment facilities,
and treats only an estimated 12% of wastewater,
compared to the Index average of 60%. Indeed,
most wastewater is discharged directly into the
city’s main river and canals, although there are
plans in place to improve its treatment capacity
(see “green initiatives” below). Otherwise, the
city scores well on sanitation policies, and is
marked up for its sanitation code, wastewater
treatment standards, and regular monitoring of
on-site treatment facilities in homes or communal areas.
Green initiatives: The city has outlined plans
to build additional wastewater facilities to
almost double treatment capacity from 1 cubic
metre to 1.8 cubic metres, although further
details, such as timetables, are unclear.
quality code and it receives full marks for informing the public about the dangers of air pollution.
Green initiatives: Taxes are 5% lower for
cleaner, alternative-fuel vehicles, and the policy
is having a positive effect, with sales of cars that
run on “E20 fuel” — a mixture of 20% ethanol
and 80% petrol — outperforming sales of other
vehicles. Bangkok authorities also aim to
increase gasohol’s proportion of the total fuel
mix from less than 20% in 2007 to 50% by 2012
in order to improve air quality.
Air quality: Bangkok ranks above average in
the air quality category. Average daily levels of
the three pollutants measured in the Index —
nitrogen dioxide, sulphur dioxide and particulate matter — are below the Index averages.
However, air pollution from traffic congestion in
the built-up parts of the city remains a challenge, and the city has made some strides to
introduce incentives for cleaner vehicles (see
“green initiatives” below). It has a robust air
Environmental governance: Bangkok
ranks above average in the environmental governance category. The city performs well for having a dedicated environmental department and
the capacity to implement its own environmental legislation. In the Bangkok Metropolitan Area,
the Department of the Environment for the
Bangkok Metropolitan Administration oversees
and implements environmental policies. In addi-
tion, the city has jurisdiction to change sections
of national law according to local requirements.
Officials also involve residents in decisions about
projects with environmental impacts, and provide the public with access to online information.
The city receives full marks in the Index for regularly monitoring its environmental performance
and publishing information on progress.
Green initiatives: The city’s cross-departmental climate change action plan features five
major initiatives to reduce greenhouse gas emissions: expanding mass transit systems; promoting the use of renewable energy; improving
electricity consumption efficiency in buildings;
improving solid waste and wastewater treatment efficiency; and expanding park areas.
Also, the Bangkok governor has taken a lead role
in an initiative by the Association of South-East
Asian Nations (ASEAN) to tackle climate change
— the “Cool ASEAN, Green Capitals” project —
which has been backed by the World Bank.
Quantitative indicators: Bangkok
Average
Energy and CO2
Bangkok*
Year** Source
CO2 emissions per person (tonnes/person)
4.6
6.7 1e
2008 Metropolitan Electricity Authority; Department of Alternative Energy
Energy consumption per US$ GDP (MJ/US$)
6.0
6.1 2e
2008 Metropolitan Electricity Authority; Department of Alternative Energy
Development and Efficiency Annual Report 2008; IPCC; EIU estimates
Development and Efficiency Annual Report 2008; EIU estimates
Land use
and buildings
Transport
Population density (persons/km2)
8,228.8
3,607.4 e
Green spaces per person (m2/person)
38.6
3.3 3
Superior public transport network , covering trams,
0.17
0.04
2010 Bangkok Metro Public Company Ltd; Bangkok Mass Transit System
82.8
62.9
2002 National Statistical Office of Thailand
Waste generated per person (kg/person/year)
375.2
534.8
2005 National Statistical Office of Thailand
Water consumption per person (litres per person per day)
277.6
340.2 3
2008 Metropolitan Waterworks Authority
Water system leakages (%)
22.2
35.0 4
2003 Asian Development Bank
Population with access to sanitation (%)
70.1
51.0 5e
2003 United Nations Environment Programme
Share of wastewater treated (%)
59.9
12.2 6e
2003 United Nations Environment Programme
Daily nitrogen dioxide levels (ug/m3)
46.7
42.7
2007 National Statistical Office of Thailand
Daily sulphur dioxide levels (ug/m3)
22.5
12.6
2007 National Statistical Office of Thailand
107.8
48.1
2007 National Statistical Office of Thailand
light rail, subway and BRT (km/km2)
Waste
Water
Sanitation
Air quality
Share of waste collected and adequately disposed (%)
Daily suspended particulate matter levels (ug/m3)
2008 Department of Provincial Administration
2007 Action Plan on Global Warming Mitigation 2007 - 2012
Public Company Ltd; Bangkok BRT
* All data applies to Bangkok City unless stated otherwise below, ** Where data from different years were used only the year of the main indicator is listed, e) EIU estimate, 1) Electricity data only available for Bangkok Metropolitan Region, 2) Based on 2005 GDP
estimate; electricity data only available for Bangkok Metropolitan Region, 3) Bangkok Metropolitan Region, 4) Non-revenue water, 5) Based on population covered by wastewater control plants, 6) Based on treatment area
38
39
Asian Green City Index | Beijing_China
lower their energy use, as well as promoting the
need for energy efficiency in buildings.
Beijing_China
Green initiatives: Ahead of the Olympics, the
city conducted an extensive tree planting and
landscaping programme to improve green cover,
defined by the city as the area covered by lawns,
and the shadows of trees and bushes. As a result,
green cover was set to increase from 42% in 2000
to 52% by 2007. The government also enforces
mandatory standards for new buildings, including insulation for outer walls to conserve heat,
and energy-efficient doors and windows.
B
eijing, China’s capital, has long been the
country’s cultural and political centre. A
sprawling commercial hub with a population of
some 17.6 million and a per capita GDP of
US$10,100, Beijing is trying to balance its
growth ambitions with a stated desire to protect
the environment. With the world’s attention on
Beijing for the 2008 Olympic Games, the national and city governments invested heavily in
improving air quality, landscaping and transport. Also, in recent years, the city government
has made substantial investments in the hightech and financial sectors, as well as relocating
older, highly polluting factories outside city limits. Beijing still faces significant environmental
Transport: Beijing ranks average in the transport category. The city has a relatively short
superior transport network (defined in the Index
as transport that moves large numbers of passengers quickly in dedicated lanes, such as
metro, bus rapid transit or trams), at 0.02 km
per square kilometre, compared to the Index
average of 0.17 km. But the city is making sub-
stantial investments to improve in this area (see
“green initiatives” below). The city receives good
marks for its policies on reducing mass transport
emissions, and encouraging citizens to use mass
transit services. Beijing also has several traffic
congestion measures in place including “no-car
days” and park and ride systems, but the rapid
growth in private car ownership in Beijing is
undermining the city’s efforts to improve traffic
flows and encourage the use of public transport.
The number of car owners in the city has doubled to 4 million since 2003, and is set to rise
even more over the next few years as incomes
rise and people aspire to the social status that
car ownership brings. The national government
has also heavily invested in developing the automobile industry, and while it does its part to promote green policies, it also promotes the automotive sector as a key to overall prosperity.
Green initiatives: The city had expanded its
underground metro system to a total of nine
Background indicators
Total population (million)
17.6
Administrative area (km2)
16,410.5
GDP per person (current prices) (US$)
10,136.7
Population density (persons/km2)
Temperature (24-hour average, annual) (°C)
1,069.4
12.0
Data applies to Beijing Municipality
challenges, especially in the areas of greenhouse gases and air quality, but the city performs well for the environmental policies covered by the Asian Green City Index, and has
therefore established a foundation to improve
its sustainability performance in the longer
term.
Beijing ranks average in the Index. The city
performs best in the water category, with an
above average ranking, reflecting the city’s vigilance in combating water shortages due to a
lack of surrounding rainfall. The city ranks average in the categories of land use and buildings,
transport, waste, sanitation and environmental
governance. Compared with its mid-income
peers (between US$10,000 and US$25,000),
Beijing has the lowest level of per capita water
consumption, the second most green spaces per
person, and collects and disposes of the second
highest share of waste. However, like other Chinese cities in the Index, Beijing has substantial
energy and air quality challenges, and this is
reflected by below average rankings for the
energy and CO2, and air quality categories. It is
also clear from the Index that China as a whole,
not just Beijing, has much more to do in reduc-
ing greenhouse gases, becoming more energy
efficient and reducing its reliance on private
vehicles. Beijing’s relative strength in sustainability policies and environmental governance
does suggest that officials take green issues seriously, even if policy intentions have not had
their full impact yet.
Energy and CO2: Beijing ranks below average in the energy and CO2 category. Despite two
major waves of industrial relocation since the
1990s, many carbon-intensive businesses remain.
And along with the rest of China, Beijing is highly dependent on carbon-intensive coal to meet
its energy needs. Coal accounts for 39% of the
city’s total energy consumption — the third
highest share of the 22 Asian cities. And the city
uses coal to power almost 100% of its electricity,
compared with about 80% for the rest of the
country as a whole. As a result the city emits an
estimated 8.2 tonnes of CO2 per capita, compared with the index average of 4.6 tonnes. Beijing and the national government are investing
in alternative sources of electricity for the future,
including solar, biomass, wind, natural gas,
nuclear and “clean coal”, which involves captur-
ing and storing greenhouse gases at coal plants.
As yet though, renewable energy sources play a
negligible role in Beijing’s energy consumption.
In addition, the relatively large amounts of energy Beijing uses in relation to its economic output
means the city scores poorly for energy efficiency. At 12.3 megajoules per US$ of GDP, Beijing
uses more than double the Index average of 6
megajoules. Again, Beijing suffers from the
large amount of heavy industry remaining in the
city, but also because utility prices in the country
have been held at artificially low levels, which
gives residents little incentive to conserve energy. The government has tried to raise prices
slowly but has not made as much progress as it
would have liked because the measures have
proved so unpopular.
Green initiatives: In response to a central government directive to boost energy efficiency
nationally, the city is promoting gas-fueled boilers. Ahead of the 2008 Olympics, the city modified 15,200 coal-burning boilers to burn natural
gas. This was to fulfill a pledge by the Olympic
committee to reduce greenhouse gas emissions
by 1.2 to 1.5 million tonnes ahead of the event.
Land use and buildings: Beijing ranks
average in land use and buildings. The city has
the second lowest population density in the
Index, with just 1,100 inhabitants per square
kilometre. At the same time, Bejing has a relatively large amount of green spaces, at 88
square metres per inhabitant, which is well
above the Index average of 39 square metres per
inhabitant. Beijing’s results for green spaces and
population density partly reflects the way the
government draws it boundaries — the city has
the largest administrative area in the Index. And
the city’s green spaces performance may very
well be even stronger than the Index suggests,
since, due to data availability, the figure in the
Index was calculated from 2005 data, and covers only nature reserves. Since 2005, Beijing has
made concerted efforts to boost green spaces,
particularly in preparation for the Olympics,
although the city is marked down in the Index
for only partially protecting its green spaces
once they are established. In terms of buildings,
Beijing performs well for its eco-buildings policies, driven by the presence of energy efficient
codes for new private and public buildings,
incentives for households and businesses to
Performance
Beijing
well
below
average
Other cities
below
average
average
above
average
well
above
average
Energy and CO2
Land use and buildings
Transport
Waste
Water
Sanitation
Air quality
Environmental governance
Overall results
The order of the dots within the performance bands has no bearing on the cities’ results.
40
41
Asian Green City Index | Beijing_China
Green initiatives: The government has plans
to improve tap water quality and replace outdated pipes, and continually invests in leakage containment efforts. City authorities are putting
plans in place to require houses and businesses
to install water meters. The national government has also directed industries to recycle and
reduce reliance on surface and groundwater.
Sanitation: Beijing ranks average in the sani-
lines by 2009, and is expected to open 10 more
lines by 2015. Officials have plans to double the
length of the city’s subway system to 600 km by
2020.
Waste: Beijing ranks average in the waste category. The city has a good record when it comes
to the share of waste collected and adequately
disposed of, at an estimated 95% compared
with the Index average of 83%. By the end of
2006, Beijing had 23 domestic waste disposal
facilities with a capacity for processing 16,200
tons of waste a day. In that same year 270,000
tonnes of waste were composted and 1.4 million tonnes were recycled in Beijing’s six recycling plants. Beijing generates more waste than
the Index average, at an estimated 395 kg per
person per year, compared to the average of 375
kg. The city scores better for its waste and recycling policies, including environmental standards on waste disposal sites, a strategy for
reducing, re-using and recycling, and for having
on-site and central collection points for recycling.
Green initiatives: The city has a general goal
to improve waste disposal and recycling rates. It
has set several targets to this end, which include
increasing the waste recycling rate in the city
through a combination of new regulations and
public awareness campaigns. The city also has
plans to build several landfills, incineration facilities and composting facilities during the next
several years. Unfortunately, the government
provides few specific details on many of these
initiatives.
Water: Beijing is above average in the water
category. The strong performance is a direct
result of the government’s investment to combat severe water shortages due to a lack of rainfall, and promoting awareness that these shortages will only get more severe as the population
grows. The government promotes conservation
and also ensures that water system leaks are
kept to a minimum, which is reflected in the
city’s above average performances in these
areas. Water consumption in Beijing is 218 litres
per person per day, the lowest among cities with
a similar income in the Index, and lower than the
Index average of 278 litres. Thirteen percent of
the water supply is lost through system leaks,
against an Index average of 22%. A water-conscious city, Beijing has also implemented comprehensive policies on water quality and promotes efficient consumption.
tation category. An estimated 70% of people
have access to sanitation in the city, which is
equal to the Index average. Officials have made
substantial investments in recent years, including the construction of four new sewage treatment plants between 2001 and 2007. The city
does better than average on the percentage of
wastewater treated, with 80%, compared to the
average of 60%. However, the city has relatively
strong sanitation policies in place, including promoting environmentally sustainable sanitation,
setting minimum standards for wastewater
treatment, and regular monitoring of on-site
treatment facilities in homes or communal
areas.
Green initiatives: A major new wastewater reuse plant has been built in North Beijing. With a
current capacity of treating 40,000 cubic metres
of wastewater per day, the plant will eventually
increase to 100,000 cubic metres per day,
although a timetable for the capacity increase
has yet to be announced. During the 2008
Olympic Games, the plant was responsible for
supplying water to the Olympic Park.
cubic metre. Particulate matter levels measure
121 micrograms per cubic metre, compared to
the Index average of 108 micrograms. Some of
the factors highlighted throughout this portrait
contribute to Beijing’s polluted air — the prevalence of cars, the relative lack of rainfall, the
presence of heavy industry and high dependence on coal. The government is aware of the
negative public health consequences caused by
the city’s air pollution, and has stepped up
efforts in recent years to monitor pollution levels. Gradually, as the city continues to improve
emissions standards, air quality is also likely to
get better. Beijing is also among the top-performing cities on air quality policies, including
its air quality code, attention to monitoring, and
efforts to warn residents about the potential
dangers of air pollution.
IV” emissions regulations for passenger cars.
Euro IV emissions standards are in force in
Europe and set limits on various pollutants emitted by vehicles. The city has also banned trucks
and buses that do not meet “Euro I” emissions
standards — an earlier, less strict version of the
standards — from entering the city centre
between 6 am and 9 pm. The government has
introduced a “cash for clunkers” programme to
buy back older, dirtier cars, and gives tax rebates
to consumers who buy cars with smaller, lesspolluting engines. In preparation for the 2008
Olympics, the government scrapped older, more
polluting buses and taxis. By 2006, more than
47,000 taxis were scrapped or replaced, out of a
total fleet of 60,000; and 7,000 older buses
were scrapped or replaced, out of a total fleet of
19,000.
Green initiatives: The national government
has tightened emissions standards for passenger cars and commercial vehicles, but Beijing
has gone farther than most other cities in the
Index. In January 2008 Beijing became the first
city in China to introduce the equivalent of “Euro
Environmental governance: Beijing
ranks average in the environmental governance
category. The city gets full marks for having a
dedicated environmental department, and for
monitoring its environmental performance and
publishing the results. The Beijing Environmen-
tal Protection Bureau has become increasingly
powerful as a result of the Olympics, and its
overall powers and responsibilities are expected
to rise. However, the city is marked down in the
Index for relative weakness compared to other
cities for involving citizens in decisions about
projects with environmental impacts.
Green initiatives: The city government was
initially slow to enlist the help of non-governmental organizations to combat Beijing’s environmental and pollution problems. But starting
in 2006, officials began to allow NGOs to play a
greater role in sustainability issues, particularly
in combating air pollution and improving traffic
management. This participation has been mainly in promoting awareness and providing policy
advice to the government. For example, NGOs
promoted the “26-degrees Celsius” movement
aimed to make hotels and restaurants maintain
a temperature higher than 26 degrees Celsius
during the summer, which helps reduce energy
use from air conditioning, although participation was voluntary and the programme’s results
were unclear.
Quantitative indicators: Beijing
Energy and CO2
Average
Beijing*
Year**
CO2 emissions per person (tonnes/person)
4.6
8.2 e
2009
Source
Beijing Statistics Yearbook; IPCC; EIU estimates
Energy consumption per US$ GDP (MJ/US$)
6.0
12.3
2009
China Statistics Yearbook 2010
8,228.8
1,069.4
2009
Beijing Statistics Yearbook
Land use
and buildings
Population density (persons/km2)
Green spaces per person (m2/person)
38.6
88.4 1
2005
Beijing Statistics Yearbook
Transport
Superior public transport network , covering trams,
0.17
0.02
2010
news.cn; Beijing Subway; chinabrt.org
light rail, subway and BRT (km/km2)
Air quality: Beijing ranks below average in
the air quality category, with above-average
emission concentrations for the three air quality
metrics in the Index. Average daily levels of
nitrogen dioxide are 53 micrograms per cubic
metre, compared to the Index average of 47
micrograms. For sulphur dioxide, the city registers 34 micrograms per cubic metre, much higher than the Index average of 23 micrograms per
Waste
Water
Sanitation
Air quality
82.8
95.4 2e
2008
China Urban Statistics Yearbook
Waste generated per person (kg/person/year)
375.2
394.7 2e
2009
Beijing Statistics Yearbook
Water consumption per person (litres per person per day)
277.6
218.1
2009
Beijing Statistics Yearbook
Water system leakages (%)
22.2
12.5
2008
China Urban Statistics Yearbook
Population with access to sanitation (%)
70.1
70.4 3e
2009
EIU estimate
Share of wastewater treated (%)
59.9
80.3
2009
Beijing Statistics Yearbook
Daily nitrogen dioxide levels (ug/m3)
46.7
53.0
2009
Beijing Statistics Yearbook
Daily sulphur dioxide levels (ug/m3)
22.5
34.0
2009
Beijing Statistics Yearbook
107.8
121.0
2009
Beijing Statistics Yearbook
Share of waste collected and adequately disposed (%)
Daily suspended particulate matter levels (ug/m3)
* All data applies to Beijing Municipality unless stated otherwise below, ** Where data from different years were used only the year of the main indicator is listed, e) EIU estimate, 1) Nature reserves coverage, 2) Based on household waste,
3) Based on regression analysis
42
43
Asian Green City Index | Bengaluru_India
action plan, and has not signed up to international covenants to lower greenhouse gas emissions.
Bengaluru_India
Green initiatives: The state electricity regulator is currently considering a tax on industrial
and commercial power consumption in order to
fund renewable energy and energy conservation programmes. Several IT companies headquartered in Bengaluru have undertaken their
own energy-efficiency measures. The harnessing of wind power, as well as the deployment of
various other conservation measures to meet
self-imposed carbon- and water-neutral targets,
are among some of the environmental steps
announced by IT companies located in the city.
Land use and buildings: Bengaluru is
Background indicators
Total population (million)
7.1e
Administrative area (km2)
709.5
GDP per person (current prices) (US$)
Population density (persons/km2)
2,066.3
10,034.0e
Temperature (24-hour average, annual) (°C)
Data applies to Bengaluru City, e) EIU estimate
23.0
B
engaluru (formerly known as Bangalore) has
developed rapidly in the past three decades,
shedding its reputation as a pensioners’ paradise to emerge as a symbol of India’s high-technology prowess. The city’s shift from a reliance
on publicly owned heavy manufacturing to ITbased industry has had positive effects on the
environment — not only because IT is inherently
cleaner, but also because the industry has
spurred the development of newer, energy-efficient buildings. A favourable climate, plentiful
gardens, and access to education and jobs, have
all done their part to support the city’s energetic
growth. However, Bengaluru remains one of the
poorer cities in the Asian Green City Index. The
estimated 7.1 million residents produce a GDP
per capita of just under US$2,100, compared
with the Index average of US$18,600, which
places limitations on how much the city can do
to balance environmental needs with the pressure for economic expansion. Due to data availability, information in the Index for Bengaluru
comes from a mix of figures from the central city
and wider, officially recognised boundaries.
Bengaluru ranks below average overall in the
Index. Its performance is consistent across most
categories, ranking average for all but the transport category, where it falls to below average. In
transport, it is marked down for lacking superior
transport, such as metro, bus rapid transit or
trams, although construction is under way on
the city’s first metro. Bengaluru faces several
environmental challenges, including one of the
highest levels of particulate matter in the Index.
But the city stands out for some other individual
indicators: For example, it has the lowest CO2
emissions per person of all cities in the Index.
Bengaluru also has the highest share of energy
consumption from renewables, and the highest
share of electricity generated from renewables.
Energy and CO2: Bengaluru ranks average
in the energy and CO2 category. It leads the
entire Index for CO2 emissions per person, at an
estimated 0.5 tonnes, compared with the Index
average of 4.6 tonnes. Energy consumption per
US$ of GDP is also lower than the Index average,
at an estimated 4.6 megajoules, versus the
Index average of 6 megajoules. The low levels of
CO2 emissions partially reflect Bengaluru’s use
of renewable energy, which, at nearly 30% of
the city’s total energy consumption, are the
highest in the Index. This is a figure based on an
estimate from data covering the use of renewables across Kanartaka State in 2007. In addition, 61% of the electricity is generated from
renewable sources, mainly hydropower — again
the highest share in the Index. The city’s relatively low income, resulting in a less energy-intensive lifestyle, also plays a part in reducing CO2
emissions, as does the shift from heavy industry to IT-related businesses. Additionally, the
national government’s policies to promote energy efficiency and renewable energy have been
important contributory factors. However, on a
city level, Bengaluru’s policies are relatively
weak when compared with other cities in the
Index. The city, for example, is only making partial efforts to consume energy more efficiently.
It also fails to regularly monitor greenhouse gas
emissions or to publish its findings. The city does
not have a comprehensive climate change
average in land use and buildings. Widely known
as the “garden city”, its particular strength in the
Index is plentiful green spaces — at 41 square
metres per person, which is higher than the 22city average of 39 square metres and the average for Indian cities in the Index, at 17 square
metres. The city also scores well for having the
seventh highest population density in the Index,
at an estimated 10,000 people per square kilometre. In spite of Bengaluru’s result for green
spaces and population density, the city has a
mixed performance on land use and building
policies. On one hand, it receives full marks for
having green standards for public buildings and
incentives for households and businesses to
lower their energy use. On the other hand, its
eco-standards for private buildings are only partial, although the city is addressing this (see
“green initiatives” below). Bengaluru has room
for improvement for its policies on green spaces
protection and urban sprawl containment, and
Performance
it also lacks policies to protect environmentally
sensitive areas.
Green initiatives: Bengaluru’s plan for ecofriendly buildings is set down in a 2009 plan
sponsored by the Renewable Energy & Energy
Efficiency Partnership, a global non-profit
organisation that funds energy research. The
proposed energy-efficiency regulations include
integrating solar energy sources in new buildings, a specific window design to enhance day
lighting, energy-efficient artificial lighting and
air-conditioning, and mandatory energy audits
for existing commercial buildings. Government
buildings already undergo mandatory energy
audits that include measuring energy conservation and efficiency, as well as the monitoring of
greenhouse gas emissions. The state government also requires energy audits and energy
efficiency standards for all industrial and commercial buildings that consume 480 kilowatts
and above.
Transport: Bengaluru is below average in the
transport category. In particular, it lacks any
form of superior public transport (defined in the
Index as transport that moves large numbers of
passengers quickly in dedicated lanes, such as
metro, bus rapid transit or trams). The city has
only just recently begun work on its first metro
system (see “green initiatives” below). Partial
policies also play a big part in Bengaluru’s transport performance. Investment in green transport is negligible, mainly because the city is allocating its limited resources towards traffic
congestion reduction, although currently, the
congestion-reduction policies measured in the
Index remain relatively weak, as do the city’s
urban mass transport policies.
Bengaluru
well
below
average
Other cities
below
average
average
above
average
well
above
average
Energy and CO2
Land use and buildings
Transport
Waste
Water
Sanitation
Air quality
Environmental governance
Overall results
The order of the dots within the performance bands has no bearing on the cities’ results.
44
45
Asian Green City Index | Bengaluru_India
Green initiatives: The city’s new US$1.7
billion metro system will run east-west and
north-south, for a total length of 42 km. It is
expected to open early in 2011 and to be fully
completed by the end of the year. The city
police have also devised the so-called B-Trac
programme, which aims to cut traffic congestion by 30%. It offers citizens real-time traffic
updates that estimate travel time between destinations. In 2007, nearly 60% of the B-Trac system was completed, and the focus now is on
pedestrian safety and traffic signal coordination. Total investment in the five-year programme is US$750,000.
Waste: Bengaluru is average in the waste category. Like other Indian cities, it generates comparatively small amounts of waste per person
— 267 kg versus the Index average of 375 kg,
and the Indian city average of 226 kg. It also collects and disposes of an estimated 80% of its
waste, which is just under the Index average of
83%, but above the Indian city average of 72%.
Bengaluru and its Indian counterparts in the
Index still espouse the less-wasteful lifestyles of
poorer economies, even as they grow richer.
However, the pressure of a growing population
is likely to increase waste, along with the necessity for better waste management and recycling. Bengaluru is marked down for not yet
having a comprehensive strategy for reducing,
recycling and re-using of waste, and for not
fully monitoring industrial and hazardous
waste. In many cases, economic growth has
outpaced the government’s ability to set and
enforce standards. And like many other Indian
cities, Bengaluru only partly regulates waste
picking, and illegal dumping of waste is not
uncommon.
Green initiatives: India’s first recycling plant
for e-waste, E-Parisaraa, became operational in
2005. Located about 50 km from Bengaluru, EParisaraa processes one tonne of e-waste per
day, although it has a daily capacity of 3 tonnes.
The e-waste comprises such things as computers, circuit boards, floppy disks and videos. Similar recycling plants are planned, as Bengaluru
alone produces between 8,000 and 10,000
tonnes of e-waste per year, but no firm details
have yet been announced.
Water: Bengaluru ranks average in water.
While the city consumes an estimated 73 litres
per day on a per capita basis, which is much
lower than the Index average of 278 litres and
the Indian city average of 167 litres, the apparently low demand owes more to poor supply
than success at water conservation. Bengaluru
loses 39% of its water to system leakages, the
fourth highest leakage rate in the Index, and
much higher than the Index average of 22%.
Water policy development is also uneven in Bengaluru. While the city has set pollution-level
standards for surface water that it monitors regularly, water-efficiency policies and promotion
could still be improved. For example, it has
water metres, greywater recycling and rainwater collection, but lacks other policies, such as
hose-pipe bans. In addition, its code to reduce
water stress and consume water more efficiently is only partial, as are its efforts to publicly promote conservation.
Green initiatives: In March 2010 the Bengaluru water board installed flow meters at more
than 218 strategic spots at a cost of US$1.5 million. The meters continuously measure how
much water is used and how much is lost.
Sanitation: Bengaluru ranks average in the
sanitation category. Only an estimated half of
Bengaluru’s residents have access to adequate
sanitation, a shortcoming it shares with other
Indian cities in the Index where growing populations have put further pressure on already inadequate infrastructure. In addition, only an estimated 42% of Bengaluru’s wastewater is treated, against a much higher Index average of 60%,
although about equal to the Indian city average
of 46%. However, Bengaluru performs well for
its sanitation policies. These include a code to
promote environmentally sustainable sanitation
services, the setting of minimum standards for
wastewater treatment, and regular monitoring
of on-site treatment facilities in both homes and
communal areas. However, the city has room for
improvement in promoting awareness of sanitary habits.
Green initiatives: The Japan Bank for International Cooperation is financing more than 80%
of a comprehensive, US$720,000 sewage pipe
upgrade in Bengaluru. The project is due to be
finished in 2013.
Air quality: Bengaluru ranks average in air
quality. The city has a mixed performance on
levels of emissions. It has below Index average
levels for both nitrogen dioxide and sulphur dioxide, registering 41 micrograms and 15 micrograms per cubic metre, respectively. Bengaluru
is supported by the national government in air
quality efforts, and India has a long history of
emission standards. They are set down in a progressive series of laws — the Air Act of 1981 and
the Environment Act of 1986. National air quality standards adopted in 1982 underwent another revision in November 2009. Despite this, the
city fares badly on daily levels of suspended particulate matter — at 343 micrograms per cubic
metre versus the Index average of 108 micrograms. The causes of high levels of particulate
matter are domestic fuel usage, construction
activities, road dust and, particularly, vehicular
emissions. However, the city has an air quality
code in place, regularly monitors air quality in
various locations around the city, and informs
citizens about the dangers of air pollution.
Green initiatives: In April 2010, stricter vehicle-emission standards were introduced in Bengaluru and 12 other Indian cities. Since 2003,
low-sulphur-content diesel and petrol have been
available in the city’s outer ring road, which is
favoured by heavy vehicles. Since 2004, the
city’s auto-rickshaws, heavily polluting vehicles,
have been required to run on “bi-fuel”, a combination of liquid petroleum gas and petrol, which
is considered less harmful than petrol or diesel
alone.
mental department’s wide remit. Bengaluru is
also marked up for having conducted a baseline
environmental review in the last five years
across all the major environmental areas covered by the Index. By the standards of the Index,
however, the city has limited scope to implement its own environmental legislation.
Environmental governance: Bengalu-
Green initiatives: The city’s master plan charting development to 2015 actively sought input
from all relevant stakeholders. These included
officials from different city departments, members of parliament, representatives from citizen
groups, trade and industry associations, and the
public.
ru is average in environmental governance. The
city receives full marks for offering citizens a
central contact point for information about environmental projects. Bengaluru’s government is
known for its e-friendliness and openness to
public enquiries, and scores well for its environ-
Quantitative indicators: Bengaluru
Average
Energy and CO2
Bengaluru* Year** Source
CO2 emissions per person (tonnes/person)
4.6
0.5 e
2007 Bengaluru Development Authority; Karnataka Government; Indian Oil
Energy consumption per US$ GDP (MJ/US$)
6.0
4.6 e
2007 Bengaluru Development Authority; Karnataka Government; Indian Oil
8,228.8
10,034.0 e
Corporation; World Institute of Sustainable Energy; IPCC; EIU estimates
Corporation; World Institute of Sustainable Energy; EIU estimates
Population density (persons/km2)
Land use
and buildings
Green spaces per person (m2/person)
38.6
41.0 1
Transport
Superior public transport network , covering trams,
0.17
0.00
Waste
Share of waste collected and adequately disposed (%)
2008 EIU estimate
2007 Indian State Forest Cover - Karnataka Government
light rail, subway and BRT (km/km2)
Water
Sanitation
82.8
80.0 2e
266.5 3
2005 Bengaluru Master Plan - 2015 - Bangalore Development Authority
Waste generated per person (kg/person/year)
375.2
Water consumption per person (litres per person per day)
277.6
73.0 4e
2005 Bengaluru Master Plan - 2015 - Bangalore Development Authority
Water system leakages (%)
22.2
39.0 3
2005 Bengaluru Master Plan - 2015 - Bangalore Development Authority
Population with access to sanitation (%)
70.1
53.0 5e
2003 Evaluation of Bengaluru Water Supply and Sewerage Project - Japan
Share of wastewater treated (%)
59.9
42.4 6e
2006 Report on City Development Plan for Bengaluru (2006) by JNNURM
Daily nitrogen dioxide levels (ug/m3)
46.7
41.0
2009 Karnataka State Pollution Control Board
Daily sulphur dioxide levels (ug/m3)
22.5
15.1
2009 Karnataka State Pollution Control Board
107.8
343.0
2009 Karnataka State Pollution Control Board
2007 Carbon Emission Report in Asian Cities 2008
Bank for International Cooperation
Air quality
Daily suspended particulate matter levels (ug/m3)
* All data applies to Bengaluru City unless stated otherwise below, ** Where data from different years were used only the year of the main indicator is listed, e) EIU estimate, 1) Based on forest cover in Bengaluru Rural and Urban Areas, 2) Share of municipal waste
collected; BMP (Bengaluru Mahanagara Palike), 3) BMP (Bengaluru Mahanagara Palike), 4) Based on per capita water supply; BMP (Bengaluru Mahanagara Palike), 5) Based on access to sewerage; BBMP (Bruhat Bengaluru Mahanagara Palike), 6) Based on daily capacity
of wastewater treatment plant; BMP (Bengaluru Mahanagara Palike)
46
47
Asian Green City Index | Delhi_India
Energy and CO2: Delhi ranks above aver-
Delhi_India
age in energy and CO2. Each inhabitant in Delhi
generates, on average, an estimated 1.1 tonnes
of CO2 per year, the third best level in the Index,
and well below the Index average of 4.6 tonnes.
This partially reflects the city’s relatively low
income, which means residents have less energy-intensive lifestyles, as well as the fact that
12% of Delhi’s electricity generation comes from
renewables, mainly hydropower. Delhi’s result in
energy consumption per US$ of GDP is higher
than the average, at an estimated 7.7 megajoules, versus the Index average of 6 megajoules. However, the city has proactive policies
to limit greenhouse gases. It also scores particularly well for its climate change action plan.
While it is strong on policy, Delhi could improve
its monitoring. It only partially monitors greenhouse gas emissions, for example.
Green initiatives: The Delhi government’s
report, Climate Change Agenda for Delhi 20092012, urges manufacturers to give 30% discounts on sales of compact fluorescent lamps,
Background indicators
Total population (million)
17.41
Administrative area (km2)
1,483.0
2,004.1e
GDP per person (current prices) (US$)
Population density
(persons/km2)
11,733.0e
Temperature (24-hour average, annual) (°C)
25.0
Data applies to NCT Delhi, 1) Delhi Municipal Corporation, e) EIU estimate
D
elhi, the capital of India, is the third most
populous city in the Asian Green City Index,
with some 17.4 million inhabitants. An additional 2 million commuters from neighbouring areas
visit Delhi daily for work or school. The capital
produces 5% of India’s GDP, second within India
only to Mumbai, the bustling financial centre.
Delhi’s main industries include food production,
textiles, leather, energy, media, tourism and real
estate. Its average per capita income of an estimated US$2,000 is more than twice the national
average, but the city is among the poorest cities
in the Index. Only two cities have a lower average GDP per person. All data for Delhi in the
Index comes from the National Capital Territory
of Delhi.
Despite the environmental challenges that
low income can sometimes pose, Delhi ranks
average overall in the Index. The city’s best performances are in the energy and CO2, and waste
categories. In energy and CO2, Delhi has one of
the lowest levels of CO2 emissions in the Index.
In the waste category, the city benefits from
some strong policies on waste collection and
recycling, and the fact that Delhi’s inhabitants
generate the least waste per person of all the
cities in the Index. In addition, among cities with
a similarly low income in the Index (with a GDP
per person of less than US$10,000), the city has
the second highest share of waste collected and
adequately disposed. Delhi is average in the categories of land use and buildings, transport,
sanitation, air quality and environmental governance. In the transport category, among cities
with a low income, the city has the second
longest superior transport network (a definition
which includes a metro, bus rapid transit or
trams). The city’s weakest performance is in the
water category, where it ranks below average,
mainly for a high level of water leakages.
Delhi hosted the Commonwealth Games in
2010, which spurred city officials to embrace
green policies. They created a separate “ecocode” for the event, setting goals for energy and
water efficiency, air pollution and waste management, among other green aims. The city
advertised the event as the first-ever “green
Commonwealth Games”.
which use less power and have a longer life than
traditional light bulbs. The government has set a
target to install compact fluorescent lamps to
light 700 km of city roads, which is expected to
conserve 100 megawatts of electricity every
year.
tres, which represents around 20% of the city’s
land space. The city also plans to add more
green cover (see “green initiatives” below).
Regarding energy efficiency in buildings, Delhi
only has partial standards for new private buildings, but receives full marks for its energy efficiency regulations for public buildings.
lighting and air conditioning. For example, the
city’s new Thyagaraj Stadium has large solar
panels on the roof, which provide energy to light
the venue. The government has also mandated
the use of solar water-heaters in buildings larger
than 500 square metres, and is subsidising one
third of the cost.
Green initiatives: Delhi aims to increase green
space from 20% to 33% by 2012, through the
addition of forests and biodiversity parks, which
are dedicated conservation zones that re-introduce threatened and extinct plant and animal
species. The city’s green spaces policy also aims
to prevent urban encroachment of “the Ridge”, a
dense forest known as the capital’s “green
lungs”. The government is also building a
wildlife sanctuary and plans the forestation of
2,100 acres of the southern part of the Ridge.
Regarding buildings, the eco-code created for
the 2010 Commonwealth Games mandates that
new buildings should have solar heating systems, windows that make the best possible use
of sunlight, as well as energy-efficient artificial
Transport: Delhi is average in the transport
Performance
category. The city’s superior public transport
network, consisting mainly of a metro system,
measures 0.08 km per square kilometre. This is
below the Index average of 0.17 km per square
kilometre, but is second best among cities with a
similarly low income in the Index and is higher
than the Indian city average of 0.03 km. Regarding transport policies, the city performs well for
its urban mass transport policy. It receives full
marks in the Index for taking steps to reduce
emissions from mass transport (see “green initiatives” below), and for encouraging residents
to take greener forms of transport. However, its
pricing system for mass transport is only partially integrated, and it lacks some of the traffic con-
Delhi
well
below
average
Other cities
below
average
average
above
average
well
above
average
Energy and CO2
Land use and buildings
Land use and buildings: Delhi ranks
average in land use and buildings. It has 19
square metres per person of green spaces, less
than the Index average of 39 square metres, but
above the average for Indian cities in the Index,
at 17 square metres. The city’s result is bolstered
by its relatively progressive policies on developing green spaces. Since 1993 Delhi has
increased green cover from trees and forests
from 22 square kilometres to 300 square kilome-
Transport
Waste
Water
Sanitation
Air quality
Environmental governance
Overall results
The order of the dots within the performance bands has no bearing on the cities’ results.
48
49