Cars the implications of mass car ownership in the emerging market giants
Bạn đang xem bản rút gọn của tài liệu. Xem và tải ngay bản đầy đủ của tài liệu tại đây (527.16 KB, 45 trang )
Cars
The implications of mass car ownership in the emerging market giants
SUMMARY
The typical urban household in China owns a TV, a refrigerator, a washing machine,
and a computer, but does not yet own a car. In this paper, we draw on data for a panel of
countries and detailed household level surveys for the largest emerging markets to
document a remarkably stable relationship between GDP per capita and car ownership,
highlighting the importance of within-country income distribution factors: we find that car
ownership is low up to per capita incomes of about US$5,000 and then takes off very
rapidly. Several emerging markets, including India and China, the most populous
countries in the world, are currently at the stage of development when such takeoff is
expected to take place. We project that the number of cars will increase by 2.3 billion
between 2005 and 2050, with an increase by 1.9 billion in emerging market and
developing countries. We outline a number of possible policy options to deal with the
fiscal implications for the countries affected and the worldwide environmental
consequences.
— Marcos Chamon, Paolo Mauro, and Yohei Okawa
The views expressed in this paper in progress are those of the author(s) and
do not necessarily represent those of the IMF or IMF policy.
2
Cars
Marcos Chamon, Paolo Mauro, and Yohei Okawa*
International Monetary Fund; International Monetary Fund; and University of Virginia
1. Introduction and Motivation
The pilot lowers the plane’s wheels and the sudden increase in noise wakes you up.
Disoriented, you try to remember which leg of your long flight you are on. Looking out of
the window, you see a complicated highway intersection, busy with plenty of cars. You
realize that you are about to land in an advanced economy, where you will transfer to
another flight. A few hours later, you reach your final destination in one of the world’s
lowest income countries, where paved roads are few, and traffic mostly consists of a mix
of carts and bicycles.
Cars are pervasive in modern economies, and are almost a defining gauge for how we
view a country’s degree of economic development. Widespread car ownership has major
implications for everyday life, countries’ economic and social fabric, and government
policies. Important spillovers are generated not only on the production side (through the
demand for various inputs), but also on the demand side (for complementary goods and
services), as cars make it easier to go shopping or to enjoy a vacation, with beneficial
effects for consumers, but also for suppliers of goods and services, and the economy more
generally. Turning to policies, at the national level, a demand for cars can only be
accommodated through the provision of the requisite infrastructure, with important fiscal
consequences, and through suitable regulations governing traffic to keep accident risks,
traffic congestion, noise, and pollution in check. Domestic long-term fiscal scenarios and
strategic decisions on appropriate types and amounts of infrastructure thus require taking a
view on future demand for cars, and for transportation more generally. At the international
level, cars account for a major share of oil consumption,1 as well as for 7% of global
greenhouse gas emissions (Stern, 2006). Accurate projections of future developments in
1
Gasoline currently accounts for as much as 45% of oil consumption in the United States, one of the most
gasoline-reliant economies (U.S. Energy Information Administration, www.eia.doe.gov).
3
car ownership are thus a key input in forecasting worldwide prices of energy and
commodities, especially oil, as well as climate conditions.
Beyond their practical economic relevance, cars have a number of features of analytical
interest to an economist. First, they have been, broadly speaking, a relatively
homogeneous product—both over time and across countries. Their comforts and safety
features have no doubt improved, and their relative price has declined, but their basic
workings have remained similar for almost a century now. Accordingly, researchers have
traditionally felt comfortable studying the demand for “cars,” perhaps because we all
recognize one when we see it, despite the availability of many different brands and
models. Second, cars have been one of the main tradable, durable goods in modern
economies for decades, and they are the second most expensive single item purchased by
the typical advanced country family, after its house or apartment. Third, owing to their
“lumpy” nature and relatively high cost, cars are only affordable for households with
incomes above a given threshold (which we will seek to estimate in this paper). Fourth,
partly owing to the presence of substantial externalities, cars are one of the consumer
products that have traditionally seen a major degree of involvement on the part of
governments, through taxes, regulation, the need for major infrastructure in order to be
useful, and—in some cases—various kinds of implicit or explicit subsidies to domestic
producers.
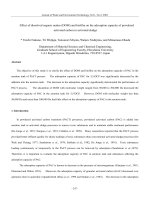
The motivation for our study is best summarized in Figure 1. The top panel is a crosscountry scatter plot of car ownership (per thousand inhabitants) against per capita incomes
(in U.S. dollars—not PPP-adjusted) for the year 2000, with each data point’s size being
proportional to the country’s population. The bottom panel is the same scatter plot for the
year 2050, according to the projections that we derive (as explained in subsequent
chapters) drawing on estimates based on data for a panel of countries.
As seen in the top panel, a casual look at cross-country data suggests a non-linear
relationship between car ownership rates and income per capita. Ownership rates are
usually minimal in the lowest income countries, but increase rapidly as per capita incomes
grow past an initial threshold (estimated at about US$5,000 per capita in 2000 prices,
about 8.5 in the log scale in the figure); ownership rises with per capita incomes even
among the most advanced countries, though it seems reasonable to expect that a saturation
point will eventually be reached. Underlying this (nonlinear) macroeconomic association
between rising per capita incomes and average car ownership, of course, is the fact that
more and more households are attaining the income levels at which they can afford a car,
as we confirm below using household level data.
4
Cars Per 1000 People
200
400
600
800
Figure 1a. Car Ownership and Income, Cross-Country Scatter Plot, 2000.
Luxembourg
New Zealand
Canada
United States
Spain
Portugal
Japan
U.K.
Poland
Bulgaria
Israel
Malaysia
Russia
Korea
Ukraine
Mexico
India
Singapore
Chile
Ethiopia
Hong Kong, China
0
China
4
6
8
10
Log GDP Per Capita (Constant 2000 Dollars)
12
800
Figure 1b. Authors’ Projections for 2050
Cars Per 1000 People
200
400
600
New Zealand
Bulgaria
Luxembourg
Canada
Poland
Portugal
Spain
Malaysia
U.K.
United States
Japan
Russia
Indonesia
Mexico
Ukraine
Korea
Chile
China
Israel
Singapore
Hong Kong, China
India
Ethiopia
0
Nigeria
4
Pakistan
Bangladesh
6
8
10
Log GDP Per Capita (Constant 2000 Dollars)
12
Notes: The solid line corresponds to a semi-parametric regression in an unbalanced panel for 1970-2003
and is drawn for illustration purposes only. GDP data are not PPP-adjusted. Projections in the bottom panel
are based on Specification (5), Table 4 (unrelated to the descriptive fitted line shown). Data sources: World
Road Statistics, International Road Federation; World Development Indicators, The World Bank. .
5
The threshold per capita income level where a major takeoff in car ownership tends to
occur is being attained by several important emerging market countries, including China
and India, the world’s most populous nations. The vast majority of urban households in
China owns appliances such as washing machines, televisions, and refrigerators (Table 1).
Almost half of urban households own a computer. Yet, although traffic jams do occur in a
handful of major cities, ownership of automobiles remains limited, at less than five per
hundred households. International experience suggests that a powerful economic force—
consumer demand—will cause this to change within the next few decades, and it is
important to estimate exactly how quickly this major transformation will take place.
India—with slightly lower per capita income—is likely to follow suit. Indeed, as shown in
the next sections, we project that emerging market countries, and China and India in
particular, will account for the bulk of growth in car ownership over the next decades.
Table 1. Durable consumer goods per 100 households (in 2006 or most recent available)
China
Urban
Automobiles
Bicycles
Cameras
Computer
Microwave Ovens
Motorcycles 1/
Refrigerators
Telephones
Telephones: mobile
Televisions 2/
Video Disc Players 3/
Washing Machines
4.3
117.6
48.0
47.2
50.6
20.4
91.8
93.3
152.9
137.4
70.2
96.8
Rural
…
98.4
3.7
…
…
44.6
22.5
64.1
62.1
89.4
…
43.0
Urban
4.0
51.9
0.0
0.0
…
28.3
30.8
…
…
70.4
8.2
12.5
India
Rural
0.7
Total
1.7
57.2
0.0
0.0
…
55.7
0.0
0.0
…
7.9
4.8
…
…
13.6
12.1
…
…
27.5
1.7
39.5
3.6
0.9
4.1
Sources: Data for China is based on tabulations of the National Bureau of Statistics (NBS) Urban
Household Survey and Rural Household Survey, available through CEIC Data. Data for India is from the
National Sample Survey Organization’s (NSSO) Consumer Expenditure Survey.
Notes: 1/Data for India includes scooters. 2/Data for China includes only color TVs. Data for India
includes all TVs. 3/Data for India includes VCRs.
The empirical study of car demand has a long history in economics, with many
applications to advanced countries—especially the United States (for example, Suits,
1958; Bernanke, 1984; and Eberly, 1994). A handful of studies have relied on panels of
country-level observations, and have in some cases used such estimates to project future
car ownership. The most extensive study to date, to our knowledge, has relied on a panel
of 45 countries since 1960 (Dargay, Gately, and Sommer, 2007).
In this paper, we extend the work to a much larger panel of countries, and also analyze
long time series information for several European and other countries that are now
advanced. Beyond the use of a richer data set, we build on Storchmann’s (2005) emphasis
6
on the importance of income distribution and “threshold” effects. While previous studies
have used flexible (if somewhat ad-hoc) functional forms allowing for different elasticities
of car ownership with respect to per capita incomes at different income levels, we start
from the simple observation that car ownership seems to rise suddenly beyond a per capita
income threshold (which we estimate). Based on income and inequality measures, we
estimate the share of the population whose income is above that threshold. This simple
and intuitive approach fits the data well, and has quantitatively substantive implications
for our projections in emerging market countries, notably China and India. More
important, this is the first study to derive projections of car ownership from householdlevel data for China and India—the countries that are expected to experience the largest
increases in ownership over the next decades.
Having estimated the relationship between incomes and car ownership from different
angles, we then project that the number of cars will increase by 2.3 billion (that is, by
about 350%) worldwide by the year 2050, with the bulk of the increase occurring in
emerging market countries, especially China and India. Indeed, we project substantially
faster growth in car ownership in these two important countries, compared with previous
studies (and controlling for different assumptions regarding future economic growth).
What do these projections imply for economic policy at the national and international
level? Should emerging market countries use their vast—and today still cheap—labor
resources to build roads or railways/metro lines? Should international agreements seek to
moderate the demand for cars, or perhaps provide incentives for greater reliance on less
polluting types of cars? Clearly there are myriad policy options that could be considered:
taxes, subsidies, regulations, and standards on particular types of cars or fuels, in the
context of domestic policies or international initiatives. We certainly do not pretend to
have answers that we can back up with quantitative analysis for all these policies. In this
paper, we offer some general thoughts on possible options where further investigation
would seem to be especially valuable, particularly where these can be linked—in an
admittedly tentative manner—to our estimation results (e.g., regarding the sensitivity of
car ownership to gasoline prices).
2. CAR OWNERSHIP IN PANELS OF COUNTRIES
We begin by drawing on data for panels of countries to establish the non-linear
relationship between per capita incomes and car ownership, with a takeoff around a fairly
robust per capita income level of US$5,000 (in 2000 prices). We first take the long-run
view, considering car ownership over the past decades for many countries, and going back
to the economic boom years of the immediate post-WWII period for several of today’s
most advanced economies. Simple plots of car ownership over time (or against growing
GDP per capita) provide strong suggestive evidence that a rapid takeoff in car ownership
seems to be the historical norm. We then turn to cross-country regressions for the most
recent data. This allows us to exploit the information from the largest cross-section of
countries, but also helps us to introduce our estimation method in the simplest and most
transparent way. Finally, we run panel regressions which we will then draw on as the
baseline estimates ultimately to project future car ownership.
7
2.1. The long-run view
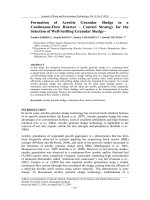
The same relationship that we saw in the cross-sectional scatter plots presented in the
introduction is also apparent in a panel of countries: based on data for 122 countries over
1970–2003, car ownership (per thousand people) is initially low at per capita incomes
below US$5,000 in 2000 prices (about 8.5 in a log scale), but increases rapidly with
income levels thereafter (Figure 1). There does not seem to be evidence of satiation: even
at the highest income levels, the semi-elasticity of car ownership with respect to per capita
income (the change in cars per person for a given percent change in per capita income)
remains high, though it falls slightly beyond a per capita income of US$10,000 (log GDP
per capita approximately 9.25), hence the (elongated) S-shape. The wide dispersion of
data points around the local-weighted regression line shows that the relationship between
car ownership and per capita incomes is far from perfect. Nevertheless, it is worth noting
that car ownership is more closely related to income levels than are other consumer goods
or other indicators of material well-being (for example, the socio-economic indicators
analyzed by Easterly, 1999).
0
Cars Per 1000 People
200
400
600
Figure 2. Car Ownership and Real Per Capita Income in a Panel of Countries (1970–2003)
4
5
6
7
8
9
Log GDP Per Capita (2000 Constant US Dollars)
10
11
Notes: Line corresponds to the fitted values from a locally-weighted regression. The data refer to 122
countries over 1963–2003 (3255 actual observations, owing to missing data). Data: car ownership from
World Road Statistics, International Road Federation; real per capita income from World Development
Indicators, World Bank.
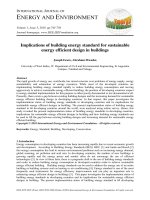
The same message holds focusing on the time series information. Long time series data
are available for the United States (since 1900, from national sources), Japan, and
13 European countries (since 1951, from national sources and Annual Bulletin of
Transport Statistics for Europe and North America). These data confirm the “boom” in
ownership rates for a number of advanced countries, notably post-war Europe and Japan
around a real income of US$5,000, even though the takeoff occurred at different times in
different countries (Figure 3). Low rates of car ownership in Japan and Europe prior to
8
1960 were, in our view, primarily the result of low per capita GDP levels: the technology
for mass car ownership was clearly available—mass car production and ownership had
been in place in the United States even before WWI.
Although our interest is primarily in the takeoff of car ownership in the relatively early
stages of economic development, we also note that there is little evidence to date of
satiation even in the most advanced countries, despite an apparent consensus on the likely
importance of this phenomenon according to previous studies of car demand. The decline
in car ownership according to the official statistics in the United States beginning in the
early 1990s is largely the result of a change in definition: personal use vans, minivans, and
utility-type vehicles are no longer defined as cars. The apparent slowdown in the growth
of car ownership in Japan in the 1990s is due to the slowdown in GDP growth: against a
GDP per capita scale, the growth in car ownership in Japan is still quite strong. And
ownership is still growing rapidly throughout Europe.
9
600
600
Figure 3. Car Ownership and Real Income Per Capita in Selected Advanced Economies
United States
Cars Per 1000 People
200
400
Cars Per 1000 People
200
400
United States
Japan
0
0
Japan
1940
1960
Years
1980
2000
8
8.5
9
9.5
10
Log GDP Per Capita (Constant 2000 Dollars)
10.5
600
1920
600
1900
Italy
Italy
France
Spain
0
0
Spain
Cars Per 1000 People
200
400
Cars Per 1000 People
200
400
France
1960
1980
2000
7.5
8
8.5
9
9.5
Log GDP Per Capita (Constant 2000 Dollars)
10
500
Years
500
1940
Austria
Cars Per 1000 People
200
300
400
Cars Per 1000 People
200
300
400
Belgium
Netherlands
Austria
Sweden
Switzerland
100
Belgium
0
0
100
Switzerland
Netherlands
Sweden
1970
Years
1980
1990
2000
8.5
9
9.5
10
Log GDP Per Capita (Constant 2000 Dollars)
Cars Per 1000 People
200
300
400
1960
Cars Per 1000 People
200
300
400
1950
Norway
United Kingdom
Denmark
Norway
United Kingdom
Denmark
Ireland
100
100
Ireland
10.5
Turkey
0
0
Turkey
1950
1960
1970
Years
1980
1990
2000
7
8
9
10
Log GDP Per Capita (Constant 2000 Dollars)
Sources: Car ownership from national sources; income from Maddison (2003). See Data Appendix.
11
10
2.2. Preliminaries: Cross-Country Regressions, Methodology and Functional
Forms.
Having observed the broad relationship between car ownership and per capita incomes
through a number of charts, we now introduce our methodological approach and turn to
regression analysis. An important element in our approach relates to how overall per
capita income levels and their within-country distributions interact to determine car
ownership. In this respect, the main explanatory variable we focus on is the share of
population above a certain income threshold. The simple theoretical rationale is presented
in Box 1. A compelling theoretical case for a similar “threshold” approach has been made
by Storchmann (2005), who traces its implications for the interaction of average income
and inequality in determining car ownership. In turning to empirical estimation for a panel
of 90 countries over 1990–97, however, Storchmann (2005) focuses on the interaction of
per capita income with measures of inequality such as the Gini coefficient, and the
changes in such interaction as per capita income grows. In our paper, we take a more
“structural” approach, by empirically relating car ownership to the share of a country’s
population above an income threshold, which in turn we estimate so as to achieve the best
fit.
An alternative approach, undertaken for example by Dargay, Gately, and Sommer (2007),
is to estimate the relationship between vehicle ownership and per capita income using a
“Gompertz” function, which allows different curvatures at different income levels, and
explicit estimation of a “saturation” level for different countries depending on various
explanatory variables. With theory giving limited guidance regarding the exact functional
form taken by the relationship we opted for what seems to us a simple and intuitively
appealing approach, recognizing of course that this may ultimately be an empirical
matter.2 Based on past experience—including in the most advanced countries (see, for
example Figure 3)—information on saturation levels seems to be rather limited: no
country seems near saturation yet. Thus we do not emphasize the issue of saturation, nor
do we attempt explicitly to estimate saturation levels, focusing instead on the “takeoff”
that seems to be especially relevant for developing and emerging market countries.
In order to estimate the share of population above a certain income threshold in the data
for each country, we follow the approach used in Dollar and Kraay (2002): we assume a
log-normal income distribution whose mean is given by the level of GDP per capita, and
2
More generally, one could consider various functional forms. For example, we experimented with a BoxCox transformation of the dependent variable. In the end, we did not find compelling evidence that more
complicated functional forms would lead to substantially different projections, and opted for the simple
approach adopted in the paper.
11
whose variance is estimated based on the Gini coefficient.3 Since cars are a tradable good,
our income measure is based on GDP in constant 2000 U.S. dollars, which, as appropriate,
does not incorporate PPP adjustments. Table 2 presents summary statistics for our sample.
Table 2. Summary statistics
Variable
log(GDP per capita)
Gini coefficient
No. of cars/1000 people
Gasoline price
Urbanization
Household size
log(Population density)
Observations
3255
3255
3255
365
3255
3062
3160
Mean
7.64
38.96
116.97
64.62
51.16
4.30
3.72
Std. Dev.
1.59
11.50
149.22
27.63
23.36
1.34
1.36
Minimum
4.03
14.69
0.05
2.00
4.48
2.20
0.12
Maximum
10.74
73.90
641.17
133.00
97.16
8.80
6.88
Notes: Unbalanced panel of 122 countries from 1963–2003. Data on cars from World
Road Statistics, International Road Federation; GDP per capita, urbanization, household
size, and population density from the World Bank’s World Development Indicators; Gini
coefficient from the UNU/WIDER World Income Inequality Database; See Data
Appendix for sources.
Table 3 presents regression results based on a cross-section of 122 countries in 2000.4
As expected, car ownership increases with income. 5 All else equal, one would expect
higher inequality to increase the growth in ownership rates at low levels of income,
because higher inequality increases the number of households with sufficiently high
income to buy a car. However, at a more advanced stage of development, higher
inequality will have the opposite effect, by creating a larger mass of poor households that
cannot afford a car despite a relatively high average income in the country. The estimated
impact of inequality alone is negative; however, when inequality, income and their
interaction are all entered in the same specification, the coefficient on inequality becomes
positive whereas the coefficient on its interaction with income is estimated to be negative.
Thus, higher inequality increases car ownership at low levels of income but decreases it at
high levels of income, as suggested by our priors. Moving to our preferred approach,
column (5) presents estimates where the share of population above a certain income
threshold is used instead of income, inequality and their interaction. The income threshold
3
Although the approach provides a useful approximation for the share of the population above a certain
threshold, a number of possible limitations need to be noted. The approach combines figures from different
data sources (and based on different concepts): the mean of the distribution is based on the national
accounts, while the Gini used to estimate the variance comes from household surveys. Moreover, per capita
GDP can be substantially higher than average household income (which would have been more appropriate
had it been readily available for a sufficient number of countries). Finally, the assumption of log-normality
may imply imperfect approximation when focusing on the tails of the distribution.
4
Whenever an observation was missing for a country, we used the data from the closest available year.
5
We report a linear relationship (rather than, say, a Tobit) between car ownership and the logarithm of per
capita income primarily for illustrative purposes, because a number of previous studies have used this
functional form.
12
is chosen (through a grid search) so as to maximize the regression’s adjusted R2
coefficient. For example, when only this threshold variable is used as a regressor (column
5, Table 3), the optimal threshold is found to be $4,500, and this univariate regression
yields an R2 of 0.83. The estimated slope coefficient suggests that a 1 percentage point
increase in the share of the population with income above $4,500 leads to an increase in
car ownership by 4.3 cars per thousand inhabitants. When further control variables are
introduced (columns 6–11), the optimal threshold remains at US$4,500–5,000.
The threshold approach fits the data well despite its simplicity. While this threshold
variable by itself does slightly worse in terms of fitting the data than log(GDP), Gini and
its interaction, its coefficient still remains significant and quantitatively important even
when those other three variables are included. We focus on the threshold variable despite
the slightly worse fit for a number of reasons. The threshold approach naturally delivers
the observed S-shaped pattern for the relationship between car ownership and income.6
The more “reduced form” approach of adding income, inequality and its interaction risks
“overfitting” the data. The income threshold approach, on the other hand, imposes more
structure in the model, and if that is indeed the relevant channel through which income
and inequality affect car ownership, the estimated relationships are less likely to “break
down” over time, particularly in a long-term horizon where average income is expected to
increase several-fold in key countries. Thus, it should prove more appropriate for the
extrapolation exercises conducted in this paper.
6
If income has a bell-shaped distribution, growth will cause an increasingly large mass of households to
cross an income threshold that lies above the average income (since we are moving from the tail to the fat
part of the distribution). Conversely, once the average income is above that threshold, further growth will
bring an increasingly small mass of households above the threshold (since we are moving from the fat part
of the bell to its tail).
Box 1. The Income ‘Threshold’ Approach
In this paper, we emphasize the lumpiness of cars and argue that this plays an important role in explaining why car
ownership rates are low and somewhat insensitive to increases in countrywide per capita income levels among poor
countries, whereas per capita income becomes a major determinant of ownership beyond a certain “threshold,” which we
estimate. A key variable in our empirical analysis is the share of a country’s population that is above such threshold.
To analyze the implications of the lumpiness of cars for the relationship between income and car ownership, suppose that
there are only two goods: cars and widgets. (Despite the conceptual distinction between car ownership and the use of a
car, we treat these two concepts as essentially equivalent, because in practice the market for rental services has been a
small fraction of overall car usage.) A consumer i with income Y will choose the consumption bundle that maximizes
U i (cars, bread ) subject to Pcars cars + Pbread bread <= Y . Let bread be the numeraire (so Pbread = 1 ). We assume:
∂ U i ( cars , bread )
∂ 2U i ( cars , bread )
> 0,
<0
∂ bread
∂ bread 2
∂ U i ( cars , bread )
→ ∞ as bread → 0
∂ bread
U i ( cars + 1, bread ) − U i ( cars , bread ) > U i ( cars + 2, bread ) − U i ( cars + 1, bread )
U i (1, bread ) − U i (0, bread ) ≤ u
Thus, there are diminishing returns to consuming bread, but bread’s marginal utility becomes very large as its
consumption becomes very small. In contrast, the loss in utility from having no car is bounded (u is a finite number). (We
also assume that the marginal utility from owning a second car is lower than that from owning a first car.) This set up
implies that a household with a low income level will allocate all of its consumption to bread:
U i (0, Y ) > U i (1, Y − Pcars ) for sufficiently large Y
But diminishing returns to bread consumption ensure that a car is eventually purchased as income grows, i.e.:
U i (0, Y ) < U i (1, Y − Pcars ) for sufficiently large Y
This threshold approach naturally delivers the observed S-shaped pattern for the relationship between car ownership and
per capita income. If income has a bell-shaped distribution, growth will cause an increasingly large mass of households to
cross an income threshold that lies above the average income (since we are moving from the tail to the fat part of the
distribution). Conversely, once the average income is above that threshold, further growth will bring an increasingly
small mass of households above the threshold (since we are moving from the fat part of the bell to its tail). Inequality will
also play an important role in determining how many households are above this threshold-level. At low levels of average
income, higher inequality will bring more households above the critical threshold. But as average income rises above that
threshold, higher inequality will lower car ownership (by creating a larger tail of poor households that cannot afford a
car).
122
0.71
-525.8**
(38.6)
122
0.78
-237.2**
(48.4)
(2)
73.47**
(4.87)
-4.440**
(0.70)
122
0.87
-1098**
(90.0)
(3)
186.8**
(11.3)
18.82**
(1.98)
-3.161**
(0.27)
111
0.81
81.41
(74.4)
-0.799
(0.50)
-33.55**
(6.84)
-16.01**
(7.51)
(4)
63.60**
(7.42)
-4.171**
(0.74)
Robust standard errors in parentheses. See Data Appendix for sources.
* significant at 5%; ** significant at 1%
Estimated
optimal threshold
Observations
Adjusted R2
Constant
Log(road miles per capita)
Gasoline price
Log(population density)
Household size
Urbanization
I(Optimal threshold)
Log(GDP per capita) x Gini
Gini coefficient
Log(GDP per capita)
(1)
88.31**
(5.53)
111
0.83
40.22**
(12.0)
-3.739
(78.3)
-0.734
(0.50)
-24.45**
(6.64)
-3.167
(8.16)
(5)
52.96**
(7.77)
-3.939**
(0.74)
4500
122
0.83
6.618
(5.83)
429.5**
(19.9)
(6)
Table 3. Income, inequality and car ownership in a cross-section of countries
5000
122
0.83
-25.36
(48.8)
409.9**
(46.5)
(7)
5.858
(8.57)
5000
122
0.88
-582.9**
(130)
(8)
106.6**
(20.6)
11.32**
(2.35)
-2.041**
(0.36)
211.4**
(56.9)
5000
111
0.86
206.4**
(53.5)
352.3**
(29.9)
-0.0687
(0.36)
-33.03**
(7.99)
-5.715
(5.56)
(9)
5000
111
0.85
227.6**
(63.0)
364.2**
(48.0)
0.010
(0.44)
-33.31**
(7.93)
-5.497
(5.57)
(10)
-3.793
(9.28)
5000
99
0.87
271.2**
(63.1)
341.5**
(32.4)
-0.0440
(0.41)
-42.76**
(8.65)
-8.406
(5.70)
-0.206
(0.31)
(11)
5000
99
0.87
290.8**
(75.7)
352.6**
(52.0)
0.0233
(0.48)
-43.02**
(8.66)
-8.156
(5.70)
-0.226
(0.32)
(12)
-3.344
(9.65)
5500
111
0.88
41.03**
(10.6)
126.5*
(71.3)
342.0**
(44.6)
0.0661
(0.44)
-24.33**
(6.86)
7.275
(5.54)
(13)
-9.545
(9.18)
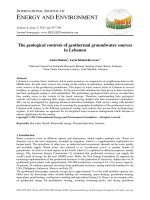
The implications of interaction of the income threshold effect and income inequality are
illustrated in Figure 4, which shows the evolution of car ownership rates as a function of
income per capita for three hypothetical countries: a high inequality country (whose Gini
coefficient is set to equal that of Brazil in 2000), an intermediate inequality country
(whose Gini coefficient is set to equal that of Turkey), and a low inequality country
(whose Gini coefficient is set to equal that of Sweden). At low levels of income, there are
more cars in the high inequality country. But as incomes rise, the low inequality country
will have a higher ownership rate, and reach a saturation level faster (at per capita income
levels well beyond those observed so far).
As for the other control variables, in principle the effect of household size on car
ownership is ambiguous. Households tend to be larger in poorer countries. Controlling for
income, larger households may be more likely to buy a car because it is a “public good“
within the household. But larger households may have a larger dependency ratio, lowering
the resources available for buying a car, and may also dilute per capita ownership if
households have a satiation point at one or two cars. In our estimates, household size has a
negative and significant effect on ownership. Population density (in logarithms, to reduce
the impact of outliers) and urbanization do not have much explanatory power.
Gasoline prices—which in the data display substantial cross-country variation, mostly
due to variation in taxes—do not have a statistically significant effect on ownership.
(They do have a negative and significant impact in a few specifications, but the results are
not robust). As we we will discuss in more detail when presenting our panel estimates
(Section 2.3), previous studies have shown that although higher fuel prices have a
significant impact on fuel consumption, the bulk of the effect occurs through a shift
toward vehicles characterized by greater fuel efficiency and a reduction in the number of
vehicle miles traveled.
The availability of roads (and railways) may also be expected to play an important role
in determining car ownership. The logarithm of the number of road miles per capita is
positively and significantly associated with car ownership. However, endogeneity issues
are likely to be a source of concern: in particular, the length of the road grid itself may be
determined by the size of the car fleet.7 To explore the possibility that railways might act
as a substitute, we also estimated the relationship between car ownership and the
logarithm of the ratio of total road miles to railway miles to the list of regressors. We
found a positive relationship, but not significant in most specifications (not shown, for the
sake of brevity).
In regressions (cross-section and panel) whose results are also not shown for the sake of
brevity, we also included the logarithm of the PPP index (both in isolation, and interacted
with the income threshold variable) as an additional control. The economic rationale is
7
In the United States, the number of new homes built in the suburbs increased dramatically in the immediate
aftermath of World War II; a couple of years later, the sale of cars took off rapidly; finally, again a couple of
years later, in response to traffic congestion, new roads started to be built linking the suburbs to the main
U.S. cities (Meyer and Gómez-Ibáñez, 1981). The sequence of events suggests that road building is
endogeneous to developments in car ownership.
15
that the PPP index is a proxy for how much non-tradable consumption economic agents
would need to forsake in order to purchase a car. In most specifications, the estimated
coefficients turned out to be small in magnitude, and the results were fragile to changes in
specification.
0
Number of cars per 1000 population
100
200
300
400
Figure 4. Impact of Income Growth on Car Ownership at Different Levels of Inequality
100
200
500
1000
2000
5000 10000 20000
GDP
Gini = 24 (Sweden)
Gini = 54 (Brazil)
50000 100000
Gini = 40 (Turkey)
Notes: Based on column 6, Table 3. Income measured on a logarithmic scale.
2.3. Panel Regressions
Moving from a single cross-section to a panel substantially increases the data available
for estimating the demand for cars and makes it possible to exploit the time-series
information in the data. But it also raises a number of issues related to the appropriate
specification, particularly for the threshold variable discussed above. We might wonder,
for example, whether the optimal income threshold for explaining car ownership and the
effect of crossing that threshold vary over time. Figure 5 plots the results of regressions of
car ownership on the threshold variable for repeated cross-sections over time (one crosssectional regression per year, beginning in the early 1960s). Figure 5A shows the income
threshold that maximizes the fit of the regression, and suggests that a constant threshold
around $5,000 would provide an adequate fit from 1970 onwards. Figure 5B shows the
corresponding effect on ownership of crossing that threshold, which has become stronger
over time. Finally, Figure 5C shows the constant coefficient in those regressions, and does
not suggest any significant trend over time.8 A formal test of the null hypothesis that (a)
8
The spikes for the unbalanced panel lines in the figures in the early 1990s in particular simply reflect the
introduction of new countries in the sample.
16
the threshold, (b) the impact of crossing the threshold and (c) the intercept are constant
over time rejects the null hypothesis for (a) and (c) but not for (b). (These results are
reported in the appendix.)
These changes over time may be driven, at least in part, by a trend decline in the relative
price of cars: the relative price of a new car in the US (measured as the CPI for new cars
divided by the overall CPI index) declined by 50% from 1970 to 2006. To make it
possible for our capture panel regressions to capture such coefficient changes over time,
we adopt two approaches. The first is to include the relative price of new cars in the
United States as an interaction term with the income threshold variable. (Unfortunately,
new price data for all countries were not available.) The second—which we use as our
baseline approach—is to take a more agnostic approach and include an interaction
between the income threshold variable and a time trend. As shown in Figure 6, however,
the relative price of new cars over the past three decades has declined at a fairly steady
pace, implying that the two approaches (interaction with car prices or interaction with a
time trend) yield similar messages.
17
Figure 5. Regressing car ownership on share of population above income threshold,
repeated cross-sections.
2000
Estimated threshold in 2000 USD
4000
6000
8000
10000
A. Optimal estimated threshold
1960
1970
Balanced, N = 62
1980
year
1990
Balanced, N = 34
2000
Unbalanced
.2
.3
Elasticity
.4
.5
B. Impact of crossing optimal threshold on car ownership
1960
1970
Balanced, N = 62
1980
year
1990
Balanced, N = 34
2000
Unbalanced
-.1
-.05
Constant
0
.05
.1
C. Intercept of regression
1960
1970
Balanced, N = 62
1980
year
Balanced, N = 34
1990
2000
Unbalanced
Notes: The unbalanced sample uses all available data. The 62-country balanced sample has data since
1995. The 34-country balanced sample has data since 1975.
18
-.2
Log(Relative Price New Car)
0
.2
.4
.6
Figure 6. Relative Price of New Cars in the United States
1960
1970
1980
Year of observation
1990
2000
Note: The data are drawn from the U.S. Bureau of Labor Statistics, and refer to the logarithm of the
consumer price index for new cars as a ratio to the overall consumer price index.
We are now ready to present our main panel results. Table 4 regresses the number of
cars per 1,000 people on the share of population above a certain income threshold, the
interaction of that share with time, and controls for urbanization, average household size
and population density. Our preferred specification includes country fixed effects, the
controls mentioned above, and a time trend for the effect of crossing the income threshold
on ownership. Country specific factors accounted for by the fixed effects might include,
for example, differences in car taxation, trade restrictions, or distribution arrangements. In
that preferred specification, the threshold value that maximizes the R2 is $4,500. A
1 percentage point increase in the share of the population above that threshold would
increase vehicle ownership in 2005 by 4.6 cars per thousand inhabitants. In 1970 the
increase would have been by 2 cars per thousand inhabitants.
Factors other than income (or its distribution) have either an insignificant or a small
impact on car ownership. The coefficient on urbanization is small and not statistically
significant when country fixed effects are considered. In our estimates, household size has
a small negative effect on car ownership without country fixed effects, which becomes
positive once fixed effects are included (a one standard deviation in household size would
raise ownership rates by 5 percent). Finally, population density has a negative, though
small effect on car ownership: in the regressions without fixed effects, moving from the
25th to the 75th percentile of population density in 2005 would lower car ownership by 17
cars per thousand people; in the regressions with country fixed effects, increasing the
logarithim of population density by one standard deviation of its within-country variation
would lower car ownership by 4 cars per thousand people.
19
Note that since the effect of crossing the income threshold is allowed to vary over time,
the relationship between car ownership and income will no longer completely “level off”
at high levels of income. Although it will still follow an “S-shape,” the relationship will
exhibit a positive slope even at high levels of income. This may help explain why satiation
does not seem to have been reached even in the most advanced countries.
Our use of a time trend reflects an agnostic approach to the factors underlying changes
over time. A reasonable guess is that those changes may reflect the secular decline in the
relative price of cars, illustrated in Figure 6. To explore this possibility, we ran the panel
regressions using the logarithm of the price of new cars relative to the overall consumer
price index for the United States. We find that indeed declining car prices falling have
played a significant role, and probably underlie much of the explanatory power of the
more agnostic trend variable. This said, in regressions that include not only an interaction
with car prices but also an interaction with a trend (Table 4, column 8), both remain
statistically significant, suggesting that falling prices of cars do not account for the full
explanatory power of the more agnostic trend variable. A further reason why we use the
results with a trend, rather than new car prices, as our baseline is that when moving to
projections of car ownership, we would have little information to guide us in projecting
car prices and would probably end up simply extrapolating a continued downward trend in
car prices—which is essentially equivalent to our baseline approach.
Table 4. Determinants of car ownership in a panel of countries
I(Optimal threshold)
No fixed effects
(1)
(2)
(3)
386.34
455.67
396.4
(20.2)** (17.2)** (23.8)**
I(Optimal threshold) x
(year-2000)
6.72
(0.70)**
(4)
616.98
(11.8)**
6.84
(0.69)**
(5)
395.66
(12.0)**
7.35
(0.18)**
Fixed effects
(6)
409.2
(12.2)**
7.36
(0.16)**
Log(new US car rel. price)
Urbanization
13.26
(4.30)**
7000
3255
2.83
(3.83)*
5000
3255
0.25
(0.29)
-21.07
(6.17)**
-9.46
(4.97)**
140.7
(43.5)**
5500
2967
0.79
0.84
0.85
Household size
Population density
Estimated optimal threshold
Observations
R-squared
(8)
335.3
(15.0)**
4.09
(0.48)**
-17.00
(2.81)**
I(Optimal threshold) x
Log(new US car price)
Constant
(7)
288.8
(13.7)**
0.64
(2.22)
11500
3255
25.20
(4.38)**
5000
3255
0.76
(0.20)**
45.86
(4.22)**
-25.64
(4.01)**
-125.0
(19.7)**
4500
2967
0.72
0.83
0.84
-411.5
(11.1)**
-204.3
(28.0)**
34.15
(4.29)**
5500
31.57
(4.40)**
5000
3255
0.83
Note: Robust clustered (by country) standard errors in parentheses. R-squared is adjusted R-squared for no fixed effects, and
within R-squared for fixed effects. See Data Appendix for sources. * significant at 5%; ** significant at 1%
20
The regressions reported in Table 4 did not include gasoline prices as a control, because
that variable is only available for 365 observations (about 11% of our panel, covering 102
countries). Table 5 shows the estimated effect of gasoline prices on car ownership in the
sub-sample for which data are available. The estimated effect is not statistically
significant, and the economic magnitude is rather small. In our data set, most of the
variation in gasoline prices is cross-sectional: the variation in gasoline prices across
countries in a given year is larger than the typical variation over time for a given country.
But the effect of gasoline prices on car ownership seems to remain negligible even when
we do not include country fixed effects or, as shown above, when we run the regression in
a single cross-section. To the extent that cross-sectional variation in gasoline prices
captures “permanent” differences (e.g., gasoline in the United Kingdom being multiple
times as expensive as in the United States), our results do not uncover a statistically
significant impact of gasoline prices on vehicle ownership rates even in the long-run.
While these results might at first seem surprising, they are in line with previous studies.
For example, based on a panel of 12 advanced countries for 1973–92, Johansson and
Schipper (1997) estimate the long-run elasticity of vehicle ownership with respect to fuel
prices at -0.1: the bulk of the estimated impact of fuel price changes on fuel usage comes
instead through changes in the type of cars driven and in the number of vehicle miles
traveled. Storchmann (2005) reports similar findings based on a panel of 90 countries in
1990–97. The results are also consistent with longer time-series studies based on data for a
single country or a limited number of countries (see Graham and Gleister, 2002, for a
comprehensive survey).
Table 5. Gasoline prices and car ownership
(1)
I(Optimal threshold)
No fixed effects
(2)
(3)
424.56
(20.1)**
431.71
(22.7)**
Threshold
Observations
2.21
(6.7)
4000
365
-0.19
(0.21)
11.64
(13.14)
4000
365
R-squared
0.84
0.84
I(Optimal threshold) x year
Gasoline Price
Constant
440.14
(19.8)**
11.39
(2.62)**
(4)
Fixed effects
(5)
(6)
294.64
(63.6)**
8.52
(0.79)**
3.96
(6.63)
4000
365
448.92
(22.4)**
11.56
(2.57)**
-0.22
(0.22)
15.24
(13.4)
4000
365
48.06
(24.2)**
3500
365
299.65
(63.3)**
8.50
(0.80)**
-0.04
(0.09)
49.03
(24.06)**
3500
365
0.85
0.85
0.59
0.59
Note: Robust clustered (by country) standard errors in parentheses. R-squared is adjusted R-squared
for no fixed effects, and within R-squared for fixed effects. *significant at 5%; **significant at 1%.
21
Although gasoline prices seem to have a limited impact on vehicle ownership, many
previous studies have found a significant response of fuel consumption to fuel prices (see
Box 2). In particular, higher gasoline prices seem to affect the type of vehicles used and
distances driven. That is, all else equal, higher gasoline prices will not cause Europeans to
own fewer cars than their American counterparts, but may cause them to buy small cars
instead of gas-guzzling (and, occasionally, military-looking) vehicles, and to travel by car
for a lower number of total miles. Unfortunately, direct tests of this hypothesis using our
data set are prevented by the limited availability of information on fuel efficiency on a
comparable basis across countries: IRF has data on fuel use, but those data are only
available for the entire fleet of vehicles. Previous studies that have painstakingly
constructed measures of fuel intensity and driving distances show a sizable effect of
gasoline prices on those variables. For example, Johansson and Schipper (1997) estimate
the elasticity of fuel intensity with respect to prices to be -0.4, and the elasticity of driving
distances with respect to fuel price to be -0.2. (By comparison, the elasticities of fuel
intensity and driving distances with respect to income are estimated to be 0.0 and 0.2,
respectively.)
Our finding that gasoline prices do not seem to have a statistically significant impact on
the overall number of cars, combined with previous evidence that higher gasoline prices
may lead consumers to choose more fuel-efficient cars and to drive shorter distances,
would seem to have potentially important normative implications. The fact that
adjustment to higher gasoline prices seems to take place in the “intensive” rather than in
the “extensive” margin suggests a smaller welfare cost for increases in gasoline taxation:
people can still own a car—but a smaller one—and use it for a lower number of vehicle
miles traveled. As we will see in Section 5, some externalities depend on the number of
vehicles, others on total miles traveled, and others still on average fuel efficiency.
22
Box 2. Estimates of the Elasticity of Demand for Automobile Fuel with respect to Fuel Prices
A host of existing studies have estimated the response of motorists to fuel price changes, both in the
long run and in the short run. Surveying the literature, Graham and Gleister (2002) report that most
studies of the elasticity of demand for automobile fuel with respect to fuel prices on OECD countries
find short-run elasticities ranging between -0.2 and -0.4, and long-run elasticities ranging
between -0.6 and -1.1.
Considering various studies on U.S. data undertaken at different times over the past couple of
decades, Parry, Walls and Harrington (2007) observe that more recent studies find a somewhat
smaller response of fuel consumption to changes in fuel prices than was the case in earlier studies.
The authors suggest that the decline in elasticity may reflect a fall in fuel costs relative to the value of
travel time, as wages increase. They also decompose the factors underlying the long-run response of
fuel consumption to increases in fuel prices, suggesting that roughly a third of gasoline demand
elasticity is accounted for by changes in vehicle miles traveled, whereas the remaining two thirds
reflect long-run changes in average fleet fuel economy, as manufacturers incorporate fuel-saving
technologies into new vehicles and consumers choose smaller vehicles. More generally, Graham and
Gleister (2002) report that estimated elasticities of traffic levels with respect to fuel prices—both in
the short run and the long run—are lower than is the case for elasticities of fuel usage.
Studies on developing countries are less abundant, perhaps owing in part to lower rates of car
ownership. They find fuel demand elasticities with respect to fuel prices that are, for the most part, at
the lower end of the spectrum identified by studies based on advanced economies: -0.2 in the short
run and (a perhaps surprisingly small) -0.3 in the long run for India (Ramanathan, 1999); -0.1/-0.2 in
the short run and -0.6/-0.8 for Indonesia (Dahl, 2001); and -0.1 in the short run and -0.5 for Sri Lanka
(Chandrasiri, 2006). Estimates based on a panel of states for Mexico yield far higher elasticities: -0.6
in the short run and -1.1/-1.2 in the long run (Eskeland and Feyzioglu, 1997). It is not clear why, on
the whole, own price elasticities of fuel are estimated to be on the relatively low side in developing
countries, where one would perhaps expect gasoline expenditures to be a relatively large item in total
expenditures of those households that own a car. It is possible that those households that own cars
are the richest, and their behavior is therefore insensitive to variation in gasoline prices. More likely,
changes in other determinants of car ownership (including changes in per capita incomes, but also
factors that are difficult to control for and act as omitted variables) have major implications for car
ownership, so that the impact of changes in gas prices is hard to detect.
23
3. HOUSEHOLD-LEVEL ESTIMATES FOR CHINA AND INDIA
This section of the paper presents results based on a household-level estimation of car
ownership rates in China and India. While car ownership remains relatively rare in these
countries, household-level data make it possible to obtain valuable information about the
level of income at which their households become more likely to own cars. By
understanding the consumption behavior of today’s well-off households, we can project
how the Chinese and Indian households will behave once economic growth brings the
average household to a similar level of affluence. Perhaps the main advantage of using
household-level data is that it may be able to capture factors specific to these countries
that could be otherwise missed in panel estimates.
3.1. China
Our estimates are based on a subset of the 2005 Urban Household Survey covering
21,846 households in 10 provinces/municipalities, which was made available through a
special collaboration agreement with China’s National Bureau of Statistics for a project
describing the evolution of income and consumption patterns in urban China (Chamon,
Chang, Chen, and Prasad, 2007). This section uses the results from that collaboration
agreement to predict the evolution of car ownership patterns over time.
In our sample, there were 3.68 cars per 100 households in 2005, with 3.55% of
households owning a car: only 0.10% owned two cars, and only 0.02% owned three cars.
In per capita terms, average ownership was 1.2 cars per 100 people, similar to the
ownership rate based on aggregate data and used in our panel estimates.9 Average per
capita disposable income in our sample is 10,950 RMB, that is, $1,335 dollars at 2005
exchange rates, or $1,132 dollars when deflated to 2000 constant dollars. This average
income is lower than GDP per capita, as expected.10
We use two regression methods to analyze the relationship between car ownership and
income: probit and non-parametric estimations. Ideally, we would like to estimate an
ordered probit for different levels of car ownership. But the very limited number of
households with more than one car do not allow for a meaningful ordered probit
9
Although one might expect the urban-household-based survey to yield a higher ownership rate than does
the aggregate data, because urban households are on average more than twice as rich as their rural
counterparts, the survey may face challenges in sampling the richest households, which are those most likely
to own a car, whereas the aggregate data can use information on vehicle registration.
10
As is well known, differences in the construction of GDP per capita compared with average household
income in survey data likely account for most of this discrepancy. For example, the bulk of gross capital
formation (which accounts for over 40% of GDP in the case of China) is not undertaken by the household
sector, and therefore is not captured in a household survey; the same applies to government expenditure and
net exports. Moreover, the rental value of owner-occupied housing is included in GDP but not in the
household income measure used. These discrepancies can also be compounded by possible under-sampling
of rich households and their capital income.
24
estimation. Instead, we estimate a probit for whether or not the household owns a car.
Given the limited variation in ownership, likely concentrated at the upper tail of the
income distribution, we also estimate that relationship non-parametrically as a robustness
check.11
Figure 7 presents the results. It also shows the distribution of income, and vertical lines
at the $2,500 and $5,000 per capita levels for illustration purposes. Both estimates indicate
very small ownership rates at low levels of income, which then steadily increase. Neither
estimate levels off at the upper tail of the distribution, suggesting substantial scope for
increases in ownership even among well-off households. There were not enough data to
meaningfully estimate the non-parametric regression at that range of income. But the nonparametric regression tracks the probit results quite closely for the income ranges where
both are available.
In order to project future car ownership rates, we assume the relationship between
ownership and income remains constant as incomes grow. We shift the distribution of
income to the right so as to raise average per capita income by 5.3% per year in 20052030.12 We are implicitly assuming that urban household disposable income will grow at
the same rate as per capita GDP during that period.13 By shifting the entire distribution by
the same amount, we are implicitly assuming that only its mean will change over time
(with the other moments of the distribution remaining constant). Note that while undersampling of rich households can lower the current car ownership rate in the survey, it will
have a very limited effect on our projections.14 The results are presented in Figure 8. A
sizable mass of the distribution is in the income range for which we cannot estimate car
ownership non-parametrically in the 2005 data. Thus, we will base our projections on the
probit estimates, whose extrapolation implies that 25.0% of households will own a car in
2030. If we continue extrapolating, 49.1% of households will own a car in 2050
(assuming a per capita income growth rate of 3.7% in 2030-2050).
Comparing these estimates based on household-level data with those based on aggregate
data involves a number of challenges. First, our sample only covers a subset of urban
households. Any mapping of these estimates to a national average would require an ad hoc
assumption regarding ownership rates for rural households, and the share of population
living in urban areas (currently at 43%). At present, car ownership rates are lower in rural
China, mainly because several rural areas remain on average very poor in absolute
11
We use a locally-weighted regression with quartic kernel weights.
See data appendix for sources of growth projections.
13
One could argue that the growth in household disposable income should be larger, because households’
share of GDP should be expected to increase over time (investment is unlikely to remain at 40% of GDP for
the next 20 years). Income growth for urban households may however be smaller than the national average
if there is convergence in urban-rural incomes, with the latter catching-up.
14
Adding a small mass to what currently is the very tail of the income distribution has a large effect on the
share of households that can afford a car today, but will have a small impact on the mass of households that
can afford a car in 2030.
12