Báo cáo hóa học DSP approach to the design of nonlinear optical devices geeta pasrija
Bạn đang xem bản rút gọn của tài liệu. Xem và tải ngay bản đầy đủ của tài liệu tại đây (1006.72 KB, 13 trang )
EURASIP Journal on Applied Signal Processing 2005:10, 1485–1497
c 2005 Geeta Pasrija et al.
DSP Approach to the Design of Nonlinear
Optical Devices
Geeta Pasrija
Department of Electrical and Computer Engineering, University of Utah, Salt Lake City, UT 84112, USA
Email:
Yan Chen
Department of Electrical and Computer Engineering, University of Utah, Salt Lake City, UT 84112, USA
Email:
Behrouz Farhang-Boroujeny
Department of Electrical and Computer Engineering, University of Utah, Salt Lake City, UT 84112, USA
Email:
Steve Blair
Department of Electrical and Computer Engineering, University of Utah, Salt Lake City, UT 84112, USA
Email:
Received 5 April 2004; Revised 19 October 2004
Discrete-time signal processing (DSP) tools have been used to analyze numerous optical filter configurations in order to optimize
their linear response. In this paper, we propose a DSP approach to design nonlinear optical devices by treating the desired nonlinear
response in the weak perturbation limit as a discrete-time filter. Optimized discrete-time filters can be designed and then mapped
onto a specific optical architecture to obtain the desired nonlinear response. This approach is systematic and intuitive for the
design of nonlinear optical devices. We demonstrate this approach by designing autoregressive (AR) and autoregressive moving
average (ARMA) lattice filters to obtain a nonlinear phase shift response.
Keywords and phrases: DSP tools, nonlinear optical devices, nonlinear phase shift.
1.
INTRODUCTION
In order to satisfy the ever-increasing demand for high bit
rates, next generation optical communication networks can
be made all-optical to overcome the electronic bottleneck
and more efficiently utilize the intrinsic broad bandwidth
of optical fibers. Currently, there are two possible technologies for achieving high transmission rate: optical time division multiplexing (OTDM) and dense wavelength division multiplexing (DWDM). However, neither the full potential of OTDM nor that of DWDM technology has been
realized due to lack of suitable nonlinear, all-optical devices
that can perform signal regeneration, ultrafast switching, encoding/decoding, and/or wavelength conversion efficiently.
This is an open access article distributed under the Creative Commons
Attribution License, which permits unrestricted use, distribution, and
reproduction in any medium, provided the original work is properly cited.
There are a number of problems with current nonlinear optical materials and devices.
There are two types of nonlinear optical materials from
which devices can be made: nonresonant and resonant. Nonresonant materials have a weak nonlinear response, but the
passage of light occurs with very low loss and the response is
broadband, typically exceeding 10 THz. However, because of
the weak nonlinear response, these devices tend to be bulky
and impose a long latency. Resonant materials have a very
strong nonlinear response, but at the expense of reduced
bandwidths and increased loss. Artificial resonances can be
used in optical architectures to overcome the limitations of
current nonlinear devices and materials [1]. In this paper, we
design nonlinear optical devices that exhibit enhanced nonlinear phase shift response using microring resonators constructed from nonresonant nonlinear material.
The nonlinear optical response of many artificial resonant structures has been studied previously, but most of the
1486
EURASIP Journal on Applied Signal Processing
c1
X1 (z)
L1
X1 (z)
X2 (z)
κ1
κ2
L2
z −1
− js1
Y1 (z)
− js1
Y2 (z)
X2 (z)
(a)
c2
Y1 (z)
c2
Y2 (z)
− js2
− js2
c1
(b)
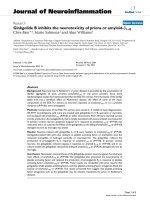
Figure 1: MZI device [2]. (a) Waveguide layout. (b) z-schematic.
studies have been limited to analyzing the nonlinear properties of specific architectures and do not provide a synthesis
approach to device design that can produce a specific nonlinear response. Discrete-time signal processing (DSP) provides
an easy to use mathematical framework, the z-transform, for
the description of discrete-time filters. The z-transform has
already been used to analyze numerous optical filter configurations in order to optimize their linear response [2]. We propose a similar approach to optimize the nonlinear response
by treating the nonlinear response in the weak perturbation
limit as a linear discrete-time filter. The field of discrete-time
filter design has been extensively researched and various algorithms are available for designing and optimizing discretetime filters. In this paper, we use existing discrete-time1 filter
design algorithms to design nonlinear optical devices.
This paper shows that the DSP approach is a systematic and intuitive way to design nonlinear optical devices. Six
steps are involved in designing a nonlinear optical device using the DSP approach. First, a prototype linear frequency response (in the weak perturbation limit) is selected for the desired nonlinear optical device. Next, the optical architecture’s
unit cell is selected and the multistage optical architecture is
analyzed using the z-transform. Then, an optimized discrete
filter is designed to give the same frequency response as the
prototype response desired from the optical architecture in
the weak perturbation limit. Next, a mapping algorithm is
derived to synthesize the parameters of the optical architecture from the discrete filter. The synthesized optical filter is
then simulated using electromagnetic models and its linear
response is verified to be the same as that of the discrete filter.
Finally, the optical device is simulated to evaluate the desired
nonlinear response and confirm the design.
This approach can be used to design optical devices to
obtain various nonlinear responses, for example, all-optical
switching [3, 4], nonlinear phase shift [5, 6, 7], secondharmonic generation [8], four-wave mixing [9, 10] (i.e., frequencies νm and νn mix to produce 2νm − νn and 2νn − νm ),
solitons [11, 12, 13] (which is a carrier of digital information), bistability [14, 15, 16] (which results in two stable,
switchable output states and can be used as a basis for logic
operations and thresholding with restoration), and amplification (which can overcome loss). The nonlinear phase shift
is a fundamental nonlinear process that enables many alloptical switching and logic devices, and is the process used
to demonstrate our approach. Artificial resonant structures
1 Henceforth,
discrete-time filters will be referred to as discrete filters.
are used in the devices to overcome the aforementioned traditional drawbacks.
The rest of this paper is organized as follows. Section 2
provides some background on optical filters in relation to
discrete-time filters. Section 3 explains the nonlinear phase
shift process. Section 4 describes the prototype linear response desired for the nonlinear phase shift. Section 5 discusses the selection of optical architectures. Section 6 details
the design procedure for AR and ARMA discrete filters. Sections 7 and 8 outline the mapping of discrete filters on to the
optical architectures and their optical response, respectively.
Sections 9 and 10 discuss an example and evaluation of AR
lattice filters and ARMA lattice filters, respectively, followed
by conclusions.
2.
OPTICAL FILTERS AND z-TRANSFORMS
Discrete filters are designed and analyzed using z-transforms.
In this section, we discuss the important aspects of optical filters in relation to discrete filters, and explain how ztransforms can be used to describe optical filters as well.
This section borrows heavily from Madsen and Zhao’s book
on optical filters [2]. Like discrete filters, optical filters are
completely described by their frequency response. Filters are
broadly classified into two categories: finite impulse response
(FIR) and infinite impulse response (IIR). FIR filters have no
feedback paths between the output and input and their transfer function has only zeros. These are also referred to as moving average (MA) filters. IIR filters have feedback paths and
their transfer functions have poles and may or may not have
zeros. When zeros are not present or all the zeros occur at the
origin, IIR filters are referred as autoregressive (AR) filters.
When both poles and nonorigin zeros are present, they are
referred to as autoregressive moving average (ARMA) filters.
Optical architectures can be of restricted type or general type. With restricted architectures, we cannot obtain
arbitrary frequency response, while general architectures,
like discrete filters, allow arbitrary frequency response to
be approximated over a frequency range of interest. To
approximate any arbitrary function in discrete-time signal
processing, a set of sinusoidal functions whose weighted sum
yields a Fourier series approximation is used. The optical
analog is found in interferometers. Interferometers come
in two general classes: (1) Mach-Zehnder interferometer
(MZI), and (2) Fabry-Perot interferometer (FPI). MZI is
shown in Figure 1a and has finite number of delays and no
recirculating (or feedback) delay paths. Therefore, these are
MA filters. FPI consists of a cavity surrounded by two partial
DSP Approach to the Design of Nonlinear Optical Devices
Y1 (z)
X2 (z)
1487
Y1 (z)
X2 (z)
√
z −1
− js2 − js2
L1
κ1
Lc1
Lc2
κ2
c1
c2
c1
c2
L2
− js1 − js1
√
z −1
X1 (z)
Y2 (z)
X1 (z)
Y2 (z)
(a)
(b)
Figure 2: Ring resonator. After [2]. (a) Waveguide layout. (b) z-schematic.
reflectors that are parallel to each other. The waveguide
analog of the FPI is the ring resonator shown in Figure 2a.
The output is the sum of delayed versions of the input
signal weighted by the roundtrip cavity transmission. The
transmission response is of AR type while the reflection
response is of ARMA type. The ring resonator is an example
of an artificial resonator.
The z-transform schematics for the MZI and FPI device
are shown in Figures 1b and 2b, respectively. κ is the
√ power
coupling ratio for each directional coupler, c = √1 − κ is
the through-port transmission term, and − js = − j κ is the
cross-port transmission term. Also, z = e jΩT , and ΩT = βŁu ,
where Lu is the smallest path length called the unit delay
length, T is the unit delay and is equal to Lu n/c, β is a propagation constant and is equal to 2πn/λ, n is the refractive index of the material, c is the speed of light in vaccum, and λ
is the wavelength of light. Propagation loss of a delay line is
accounted for by multiplying z−1 by γ = 10−αL/20 , where α
is the average loss per unit length in dB, and L is the delay
path length. Because delays are discrete values of the unit delay, the frequency response is periodic. One period is defined
as the free spectral range (FSR) and is given by FSR = 1/T.
The normalized frequency, f = ω/2π, is related to the optical frequency by f = (ν − νc )T, or f = (Ω − Ωc )T/2π.
The center frequency νc = c/λc is defined so that the product of refractive index and unit length is equal to an integer
number of wavelengths, that is, mλc = nLu , where m is an
integer.
To analyze the frequency response of the MZI, the unit
delay is set equal to the difference in path lengths, Lu = L1 −
L2 . The overall transfer function matrix of the MZI is the
product of the matrices:
z−1 0
0 −1
Y2 (z) = −s1 s2 γz−1 1 + c1 c2 γz−1 + c12 c22 γ2 z−2 + · · · X1 (z).
(2)
The infinite sum simplifies to the following expression for
the ring’s transfer function:
H21 (z) =
−1
Y2 (z) − κ1 κ2 γz
=
.
X1 (z) 1 − c1 c2 γz−1
(3)
Other responses for the ring resonator can similarly be obtained. Hence we see that optical resonances are represented
by poles in a filter transfer function. Therefore the filters built
using artificial resonances are IIR filters.
We have used the MZI and microring resonator as the
building blocks to design the nonlinear optical devices for
obtaining nonlinear phase shift in this paper. Detailed description of using z-transforms for analyzing single-stage and
multistage optical filters is provided in [2].
3.
NONLINEAR OPTICAL PROCESSES
Nonlinear optics is the study of phenomena that occur as a
consequence of the modification of the optical properties of
a material under intense illumination. Typically, only laser
light is sufficiently intense to modify the optical properties
of a material. Nonlinear optical phenomena are nonlinear in
the sense that the induced material polarization is nonlinear
in the electric field:
P=
o E+ o χ
(1)
: E+
oχ
(2)
linear PL
:: E · E+ o χ
(3)
::: E · E · E+ · · ·,
nonlinear PNL
(4)
ΦMZI = Φcplr κ2 Φdelay Φcplr κ1
c2 − js2
=
− js2 c2
by
c1 − js1
.
− js1 c1
(1)
For the ring resonator, the unit delay is equal to Lu =
L1 + L2 + Lc1 + Lc2 , where Lc1 and Lc2 are the coupling region
lengths for each coupler. The sum of all-optical paths is given
where dielectric dispersion is ignored. The optical Kerr effect
(i.e., nonlinear refraction index) results from the third-order
(3)
nonlinear susceptibility χ , which is a fourth-rank tensor.
An optical wave is a real quantity and is usually expressed
as
E(t) = Re E exp j(k · r + ωt) ,
(5)
1488
EURASIP Journal on Applied Signal Processing
or similarly as
Comparing (11) and (12), the nonlinear refractive index is
directly determined by the third-order susceptibility as
1
E(t) = E exp j(k · r + ωt) + cc,
2
(6)
n2 =
where cc represents the complex conjugate of the preceding
term. Thus, an x-polarized optical wave, propagating in zdirection in an isotropic medium, is represented mathematically as
1
E(t) = Ex x exp j(kz + ωt) + cc.
2
(7)
3.1. Nonlinear phase shift
The third-order polarization (mediated by χ (3) ) in a material leads to a nonlinear intensity dependent contribution to
its refractive index, that is, the refractive index of the material changes as the incident intensity on the material changes.
The susceptibility tensors in isotropic material can be fur(1)
ther simplified as χ = χ (1) , being a scalar quantity, and
(2)
χ = 0, due to inversion symmetry. The third-order nonlinear susceptibility will only have one contributing term
χxxxx since the light is x-polarized and there are no means
for sourcing additional polarization components. The linearand nonlinear-induced polarizations are
PL =
o
1 + χ (1) E,
P NL = P (3)
=
o χxxxx (ω; −ω, ω, ω)E
+
+
∗
EE
o χxxxx (ω; ω, −ω, ω)EE
∗
E
∗
o χxxxx (ω; ω, ω, −ω)EEE
(8)
= 3 o χxxxx |E|2 E
=
3
2
o χxxxx Ex E,
4
P = P L + P NL =
o
1 + χ (1) +
3
o χxxxx Ex
4
2
E.
(9)
The total dielectric constant is
tot
r
=
r
+ ∆ r.
(10)
Comparing with the expression for P, we obtain r = 1 +
χ (1) = n2o and ∆ = (3/4)χxxxx |Ex |2 . The refractive index is
related to the dielectric constant as
n=
r
+∆
r
≈
√
r
3χxxxx
∆
2
+ √ r = no +
Ex .
2 r
8no
(11)
The intensity dependent refractive index for a nonlinear material is given by
n = no + n2 | E | 2 .
(12)
(13)
which characterizes the strength of the optical nonlinearity.
The intensity I of an optical wave is proportional to |E|2 as
I = (1/2η)|E|2 where η is the impedance of the medium.
When comparing the optical response in the same medium,
I = |E|2 is taken for simplification.
This intensity dependent refractive index, in turn, results
in various processes, one of which is the nonlinear phase
shift. For a material with positive n2 , increasing the intensity
results in a red shift of the frequency response of an optical
filter. This can be explained using the equation nLu = mλc ⇒
(no + n2 |E|2 )Lu = mλc , where m is an integer. The product
nLu is called the optical path length. Increasing intensity I results in the increase of optical path length and wavelength λc ,
and hence a decrease in the center frequency νc causing a red
shift of the frequency response. When optical path length is
increased by varying Lu and keeping n constant, the red shift
will be perfect and the shape of the frequency response curve
will not change. In nonlinear materials, the refractive index
n as well as the loss in the material changes with changing
intensity and hence the red shift is not perfect.
As discussed, current nonlinear optical materials and devices either have weak nonlinear response (nonresonant materials) or have high loss (resonant materials). Using artificial resonances, for example, microring resonators made of
nonresonant nonlinear material, we can obtain strong nonlinear response with low loss [1]. Light circulates within the
resonator and coherent interference of multiple beams occurs, resulting in intracavity intensity build-up and group
delay enhancement which in turn enhances the nonlinear response.
4.
respectively. Hence,
3χxxxx
3χ (3)
=
,
8no
8no
PROTOTYPE RESPONSE FOR NONLINEAR
PHASE SHIFT
The nonlinear phase shift is a fundamental nonlinear process that enables many all-optical switching and logic devices
[5] that can be used in the next generation optical communication systems. An ideal nonlinear phase shifting element
has constant intensity transmission up to at least a π radian
phase shift upon increasing the incident intensity. The lesser
the intensity required to obtain a π phase shift, the better the
nonlinear performance.
The first step in the design approach is to select a linear
frequency response for the desired device. Figure 3 illustrates
the notion of producing a nonlinear phase shift response
through the nonlinear detuning of a periodic (discrete) filter.
To act as an ideal nonlinear phase shifter, in the weak perturbation limit, a flat magnitude response and steep linear phase
are desired within the passband.
Light incident on the filter (at a frequency νm , e.g.) will
be transmitted with efficiency given by the magnitude response, but will also experience a phase change due to the
DSP Approach to the Design of Nonlinear Optical Devices
1489
In
Iout /Iin
κ1
R = L/2π
νm−1
νm
νm+1
κ0
ν
Out
Figure 4: Single-pole structure.
Φ
∆Φ nonlinear phase shift
φr
In
νm−1
νm
νm+1
ν
Original
Red-shifted
Figure 3: Prototype linear response for nonlinear phase shift.
phase response. As the light intensity increases, the overall
filter response will red shift due to intensity-induced changes
in the filter components, which are themselves constructed
from (weakly) nonlinear materials. Ideally, under weak detuning, the transmitted intensity fraction will not change
(and hence the desire for a flat-topped magnitude response),
but the phase at the output will change due to a steep linear phase response within the filter passband. The slope of
the phase determines the group delay. Ripples in group delay
may result in bistability in the nonlinear response, and therefore, linear phase is desired in the passband to have constant
group delay. In effect, what this approach does is to amplify
the intrinsic nonlinearity of a material, where the efficiency
of the process improves with increasing the filter group delay. However, strong detuning in multiresonator systems can
result in distortions of the filter response.
The red-shifted response is shown by the dotted curve
in Figure 3. It can be seen that the transmitted output does
not change (in the weak perturbation limit) and a nonlinear
phase shift is obtained because of the shifted phase response.
An increase in the input intensity Iin results in greater red
shift and hence more nonlinear phase shift. The input intensity at which a π phase shift is obtained is denoted as Iπ . The
nonlinear phase shift response should be such that a phase
shift of π can be obtained at a lower input intensity, Iπ , than
that required for the bulk material. The lower the Iπ , the better the filter. Also, the transmission ratio at the intensity at
which π phase shift is obtained should be at least 0.5, for
maximum of 3 dB insertion loss.
5.
κr
κ
OPTICAL ARCHITECTURES FOR NONLINEAR
PHASE SHIFTER
The second step is to select the optical architecture’s unit cell
and analyze it using the z-transform. Artificial resonances
produced by ring resonators can be used to enhance the
nonlinear phase shift response of an optical device [1, 7].
κ
Out
φt
Figure 5: Independent pole-zero structure.
The presence of a ring resonator in the architecture implies
the presence of a pole in the filter’s transfer function. To select the optical architecture for obtaining a nonlinear phase
shift response, we analyze two ring resonator configurations
(1) single pole (2) single pole-zero with the pole and zero
independent of each other.
(i) Single-pole design. Figure 4 shows a single-pole architecture with a zero at the origin. The transfer function
for this architecture in the z-domain is given by
√
κ0 κ1 γe− jφ z−1
Eout (z)
=
.
Ein (z)
1 − c0 c1 γe− jφ z−1
(14)
The total phase change in the fundamental range −π ≤
ω ≤ π for this unit cell is equal to π. By cascading N
such unit cells, we can obtain a total phase change of
Nπ in the fundamental range.
(ii) Single pole-zero design with independent pole and
zero. Figure 5 shows a single pole-zero architecture
with the pole and zero independent of each other. The
transfer function for this architecture in the z-domain
is given by
c2 cr − s2 e− jφt − c2 e− jφr − s2 cr e− j(φr+φt ) z−1
Eout (z)
=
.
Ein (z)
1 − cr e− jφr z−1
(15)
The total phase change in the fundamental range −π ≤
ω ≤ π for this unit cell is equal to 2π if the filter
is maximum phase, and 0 if it is minimum phase.
We are interested in lowpass maximum phase systems
(|zero| > 1/ |pole|) since they have the maximum net
phase change and most of the phase change lies within
the passband. The architecture shown in Figure 5 can
be designed to be a lowpass maximum phase system
since the poles and zeros are independent of each
other. By cascading N such unit cells, we can obtain
a total phase change of 2Nπ in the fundamental range.
1490
EURASIP Journal on Applied Signal Processing
Ei2
R0
T0
Eo1
Ei2
c0
R0
√
φ1
c0
c1
σ
R1
κ1
√
σ
T2
√
σ
− js1
σ = γe− jφ z−1
φ2
R2
Eo1
− js0
κ0
T1
T0
c1
c2
√
c2
c3
√
σ
− js2
κ2
√
σ
φ3
Eo2
T3
R3
κ3
Ei1
σ
− js3
Eo2
Ei1
c3
Figure 6: AR lattice filter [2].
A third possible configuration is a ring resonator with
a single coupler. However, this is a pole-zero architecture
with dependent pole and zero and is always highpass for
a maximum phase system. The total phase change is equal
to 2π but most of the phase change is present in the stopband and hence, we cannot obtain the prototype response
of Figure 3 using this unit cell. Therefore, we decided to use
the first and second configurations as the unit cells for our
designs. Joining the first configuration unit cell in a lattice
structure gives us an AR lattice filter architecture shown in
Figure 6 and joining the second configuration unit cell in a
lattice structure gives us an ARMA lattice filter architecture
shown in Figure 7. Lattice structures are chosen since they
have low passband loss and can operate at significantly higher
component variations as compared to transversal or cascade
structures.
The next step is to obtain a z-transform description of
the multistage architecture obtained by joining the unit cells.
First, a DSP schematic is drawn for the architecture and then
it is analyzed to obtain a transfer function matrix. The AR
and ARMA lattice architecture’s DSP schematics and transfer functions are given below. The detailed derivations are
presented in [2].
(i) AR lattice filter. Figure 6 shows the waveguide layout
and DSP schematic of an AR lattice architecture. The
transfer matrix for this architecture is [2]
Tn+1 (z)
T0 (z)
= ΦN ΦN −1 · · · Φ1 Φ0
,
Rn+1 (z)
R0 (z)
(16)
Xn (z)
X0 (z)
= ΦN ΦN −1 · · · Φ1 Φ0
,
Yn (z)
Y0 (z)
1
− jsn γe− jφn+1 z−1
1
−cn
.
cn γe− jφn+1 z−1 −γe− jφn+1 z−1
(17)
(18)
where
Φn =
1
−cnt ARn (z)e− jφnr − jsnt An (z)e− jφnt
,
An (z) jsnt ARn (z)e− jφnr cnt An (z)e− jφnt
An = 1 − cnr e− jφnr z−1 ,
6.
ARn = −cnr + e− jφnr z−1 .
(19)
(20)
DESIGN OF ARMA AND AR DISCRETE FILTERS
The next step is to design discrete filters to be mapped onto
AR and ARMA lattice architectures with the response as
shown in Figure 3 (where the number of stages, i.e., poles
and zeros are given). For mapping onto the AR lattice architecture having N rings (unit cells), an Nth-order discrete
AR filter (N poles, no zeros) is designed. Similarly, for mapping onto the ARMA lattice architecture having N stages, an
Nth-order discrete ARMA filter (N poles and N zeros) is designed. The discrete filter design procedure for designing AR
and ARMA filters is described below. The design needs to
meet the constraints of linear phase within the passband with
as high group delay as possible, and flat magnitude response
with as large bandwidth as possible.
6.1.
where
Φn =
(ii) ARMA lattice filter. Figure 7 shows the waveguide layout and DSP schematic of an ARMA lattice architecture. The transfer matrix for this architecture is [2]
Design of AR discrete filters
Each stage of the AR optical architecture represents a pole
in the transfer function. Therefore, the discrete filter designed to be mapped on this architecture should have only
poles. To obtain the nonlinear phase shift, the AR discrete
filter should be designed to obtain the prototype response
DSP Approach to the Design of Nonlinear Optical Devices
X0
κ0t
Y0
X0
c0t
κ1r
φ2r
κ1t
κ2r
φ3r
κ3t
κ3r
φ1t
φ2t
φ3t
z−1
c1r
z−1
c2r
z−1
c3r
− js1r
c1t
− js2r
c1r − js1t
− js0t
Y0
φ1r
1491
c0t
c2t
c1t
X3
Y3
− js3r
c2r − js2t
κ4t
c3t
X3
c3t
Y3
c3r − js3t
c2t
Figure 7: ARMA lattice filter [2].
of Figure 3. The prototype response requires a flat passband
and linear phase within the passband. If H(z) is the transfer
function of the discrete filter, the condition to obtain linear
phase is H(z−1 ) = z−∆ H(z), where ∆ is a delay. In the case
of IIR filters, since all poles are inside the unit circle, satisfying the above condition requires that there are mirror image
poles outside the unit circle thereby making the filter unstable. Therefore, stable IIR filters can only approximate a linear
phase response.
In the next subsection, we formulate the problem of
ARMA discrete filter design as a least squares minimization problem. Since the case of AR filters can be thought as
a special case of ARMA filters with all zeros at origin, the
least squares formulation of ARMA filter design can be easily adopted to AR filters as well. However, unfortunately, numerical examples reveal that this approach results in either
unstable IIR filters or, if the poles of the filter are constrained
to the stable region, |z| < 1, the group delay of the resulting filter will be unsatisfactory. Therefore, other methods of
filter design have to be adopted. Selesnick and Burrus [17]
have proposed a generalized Butterworth discrete filter design procedure that allows arbitrary constraints to be imposed on the number of poles and nontrivial zeros, that is,
zeros other than those at the origin. Hence, it can be adopted
for designing AR filters. The designs satisfy the condition of
maximally flat magnitude response at the center of passband,
the Butterworth condition. This fulfills the required flat passband response. The filter’s group delay shows some variation
over the passband. However, it remains relatively flat over a
good portion of the passband, which, to some extent, satisfies
the constant group delay condition.
The generalized Butterworth filter design uses the mapping x = (1/2)(1 − cos(ω)) and provides formulas for
two real and nonnegative polynomials P(x) and Q(x) where
P(x)/Q(x) resembles a lowpass response, over the range x ∈
[0, 1] (equivalent to ω ∈ [0, π]). A stable IIR filter B(z)/A(z)
that satisfies
H e jω
2
=
P 1/2 − (1/2) cos ω
Q 1/2 − (1/2) cos ω
(21)
is then obtained. To this end, the spectral factorizations P(1/2 − (1/2) cos ω) = B(e jω )B(e− jω ) and Q(1/2 −
(1/2) cos ω) = A(e jω )A(e− jω ), from which the transfer functions B(z) and A(z) could be extracted, are performed. Note
that the latter factorizations are possible since P(x) and Q(x),
for x ∈ [0, 1], are real and nonnegative [18].
Reference [17] details the design process and provides the
closed form expressions for obtaining B(z) and A(z). The
routine maxflat provided in the Matlab’s signal processing
toolbox is an implementation of the generalized Butterworth
filter design procedure. We use this routine of Matlab to design the AR filters whose response matches the prototype response. The number of poles and the bandwidth are given as
parameters to the routine which delivers the desired transfer
function.
6.2.
Design of ARMA discrete filters
The generalized Butterworth filter design procedure that was
considered above for the design of AR filters could also be
adopted for the design of ARMA filters. However, our experiments have shown that better designs could be obtained by
adopting a least squares method. The idea is to find the coefficients of an IIR transfer function
B(z) b0 + b1 z−1 + · · · +bN z−N
=
A(z)
1 + a1 z−1 + · · · +aN z−N
H(z) =
(22)
such that its frequency response resembles that of a desired
response. Two approaches are commonly adopted [19]: (i)
the output error method, and (ii) the equation error method.
In the output error method, the coefficients of A(z) and B(z)
are chosen by minimizing the cost function
ξoe =
1
2π
2π
0
W(ω)
B e jω
− Ho e jω
A e jω
2
dω,
(23)
where W(ω) is a weighting function and Ho (e jω ) is the
desired (prototype filter) response. In the equation error
method, on the other hand, the coefficients of A(z) and B(z)
are chosen by minimizing the cost function
ξee =
1
2π
2π
0
W(ω) B e jω − A e jω Ho e jω
2
dω. (24)
1492
EURASIP Journal on Applied Signal Processing
In this paper, we choose the equation error method as it leads
to a closed form solution for the filter coefficients. The output error method leads to a nonlinear optimization procedure. It is thus much harder to solve. Moreover, any solution
that could be obtained from the output error method may
also be obtained from the equation error method by an appropriate selection of the weighting function W(ω).
The common approach of optimizing B(e jω ) and A(e jω )
in (24) is to first replace the integral (24) by the weighted sum
K
2
wi B e jωi − A e jωi ho,i ,
Jee =
(25)
i=1
8.
where ωi is a grid of dense frequencies over the range 0 ≤ ω ≤
2π and wi is the short-hand notation for W(ωi ). Defining the
column vectors
ei = 1 e jωi e j2ωi · · · e jNωi − ho,i e jωi − ho,i e j2ωi
· · · − ho,i e jNωi
H
,
(26)
b = [b0 b1 b2 · · · bN ]H , a = [a1 a2 · · · aN ]H , where
the superscript H denotes Hermitian, and c = ba , (25) can
be rearranged as
Jee = cH Ψc − θ H c − cH θ + η,
(27)
where
K
Ψ=
wi ei eH
i ,
i=1
K
θ=
(28)
wi ho,i ei ,
i=1
and η = Ki=1 wi |ho,i |2 .
The cost function (27) has a quadratic form whose solution is well known to be [19]
c = Ψ−1 θ.
(29)
Once c is obtained, one can easily extract the coefficients bi
and ai from it. This procedure was originally developed in
[20].
The routine invfreqz in Matlab signal processing tool box
can be used to find the coefficients A(z) and B(z) according
to the above procedure.
7.
each stage. Thus, the optical filter is synthesized from the discrete filter using a mapping algorithm. The AR discrete filter
designed in the previous section is mapped onto the AR lattice optical architecture using the recursion-based algorithm
developed by Madsen and Zhao [21]. The ARMA discrete
filter designed in the previous section is mapped onto the
ARMA lattice optical architecture using the recursion-based
algorithm developed by Jinguji [22]. These algorithms return
the coupling ratios and phase solutions for each stage of the
lattice architectures.
MAPPING DISCRETE FILTERS ONTO OPTICAL
ARCHITECTURES
The optical architectures were analyzed using the ztransform and their transfer functions were derived in
Section 5. The discrete filter’s transfer functions obtained in
the previous step are now set equal to the corresponding
optical filter’s transfer function. Backward relations are derived to calculate the optical architecture’s parameters for
FROM DISCRETE RESPONSE TO THE
OPTICAL RESPONSE
The optical filter designed using the above steps is now simulated for its linear response [23] using electromagnetic models. Also, the linear optical response is compared with the
discrete filter’s response. Both should have exactly the same
shape (different scales) since the optical filter was synthesized
from the discrete filter.
The discrete frequency response curve can be converted
to an optical frequency response curve once we know the optical parameters such as unit length and center frequency.
We had previously defined z = e jΩT with Ω = 2πν, and
T = Lu n/c where ν is the optical frequency, Lu is the unit
length, n is the refractive index, and c is the speed of light.
Also the FSR was defined to be equal to 1/T.
The discrete frequency response plotted over the fundamental range −π ≤ ω ≤ π or −1/2 ≤ f ≤ 1/2 which
is normalized to −1 ≤ fnorm ≤ 1 by Matlab’s freqz routine is equal to one optical FSR. The normalized frequency
fnorm = ωnorm /2π is related to the optical frequency by
fnorm = (ν − νc )T or fnorm = (Ω − Ωc )T/2π. To plot
the optical frequency response over one FSR directly using
freqz, the sampling frequency Fs can be set equal to the FSR
and the frequency response can be plotted from −Fs /2 to
Fs /2.
Since FSR = 1/T = c/nLu , we need to know the unit
length to know FSR. The unit length is chosen such that the
product of refractive index and unit length is equal to an integer number of wavelengths, that is, mλc = nLu where m is
an integer and λc is the desired central wavelength. The center frequency is then defined as νc = c/λc . It is the frequency
at which resonance occurs.
Once the linear response of the optical architecture is verified to be the same as that of the discrete filter, the optical filter is simulated to obtain the nonlinear phase shift response
[23].
9.
9.1.
EXAMPLE AND EVALUATION OF
AR LATTICE FILTERS
Design and synthesis example
In this section, we design an optical AR lattice filter and simulate it to obtain the nonlinear phase shift response. The filter is synthesized by designing discrete filters according to the
DSP Approach to the Design of Nonlinear Optical Devices
description in Section 6.1 and then using the mapping algorithm derived by Madsen and Zhao [21]. The circumference
of each microring in the AR lattice architecture is chosen as
the unit delay length and is equal to 50 µm. The center frequency corresponds to a wavelength of 500 nm.
1493
A generalized digital Butterworth filter with five poles is
designed using the procedure discussed in Section 6.1. Filter
bandwidth is set to be 0.16π in the fundamental range −π ≤
ω ≤ π. Assuming the loss in the material to be 1cm−1 , the
obtained filter transfer function is
Magnitude (dB)
N(z)
6.5941 × 10−4
=
.
D(z) 1.0000 − 4.1912z−1 + 7.0824z−2 − 6.0254z−3 + 2.5789z−4 − 0.4439z−5
100
64
62
60
50
−0.05 0 0.05
0
−50
−1 −0.8 −0.6 −0.4 −0.2
0
0.2 0.4 0.6
Normalized frequency (xπ rad/sample)
0.8
1
Φ(xπ)
5
0
−2
−4
−0.05 0 0.05
0
−5
−1 −0.8 −0.6 −0.4 −0.2
0
0.2
0.4
0.6
0.8
1
Group delay (samples)
Normalized frequency (xπ rad/sample)
30
30
20
10
20
−0.05 0 0.05
10
0
−1 −0.8 −0.6 −0.4 −0.2
0
0.2 0.4 0.6
Normalized frequency (xπ rad/sample)
0.8
1
Figure 8: Frequency response and group delay characteristic of 5thorder AR filter.
Table 1: Design values for a 5th-order AR lattice filter.
n=0
κn 0.7336
φn —
1
0.1416
0
2
0.0357
0
3
0.0198
0
4
0.0232
0
5
0.2488
0
The frequency response and the group delay characteristic
of this filter are presented in Figure 8 showing that the designed filter’s response matches with the ideal prototype response of Figure 3 for nonlinear phase shift. The magnitude
response is maximally flat as desired. Also, even though most
of the group delay is pushed towards the passband edges, the
group delay and magnitude response does not have ripples
and hence bistability is largely avoided.
(30)
This discrete filter is then mapped onto the optical AR
lattice architecture of Figure 6. Table 1 shows the coupling
ratios and phase values thus obtained for each stage of the
optical filter.
The linear response of the synthesized optical filter is the
same as that of the discrete filter for low input intensity. The
nonlinear phase shift response of the AR filter is shown in
Figure 9 as a function of the normalized input intensity n2 Iin ,
where n2 is the nonlinear coefficient of the underlying material and Iin is the input intensity. As can be seen from the figure, a π radian phase change is obtained at n2 Iπ = 9.0 × 10⁻⁵
and the transmission ratio at this input intensity is 0.66. The
nonlinear response is also plotted for incident frequencies at
νm ± δν/4 where νm is the center frequency. Because of the flat
magnitude response in the filter’s linear response, the nonlinear phase response (up to a π phase shift) is weakly sensitive
to frequency within the passband of the filter, as shown, allowing for a broadband nonlinearity. Also plotted for comparison is the phase shift produced by the underlying material of length L = kgd c/n ∼ 0.65 mm, which gives the same
group delay as that of the AR lattice architecture. The nonlinear phase shift produced by the designed AR filter is 5 times
better than that of the bulk material.
The allowable amount of parameter error is an important information for fabrication. Random errors were added
to each of the design parameters, that is, the coupling ratios
and the phase values, and the nonlinear response was obtained to determine the parameter sensitivity. The allowable
errors below which the nonlinear response is within 10% of
the original value are ±0.001π for κrn , and ±0.003π for φrn .
A detailed sensitivity analysis is presented in [24].
9.2.
Improving the nonlinear phase shift response
The nonlinear phase shift response improves upon increasing the group delay. This is because high group delay implies steeper phase response which results in greater nonlinear phase shift as the frequency response red shifts upon increasing input intensity. For a maximum phase discrete filter
with no poles at the origin, the total phase change across the
FSR is expressed by Φob + Φib = 2πNz , where Φob is the outof-band phase, Φib is the in-band phase, and Nz is the number of zeros in the discrete filter. This simple analysis shows
1494
EURASIP Journal on Applied Signal Processing
1
2
Iout /Iin
0.8
×10−3
0.6
1.5
0.4
0
10−8
10−7
10−6
10−5
10−4
n2 Iin
0.2
10−3
3
1
n2 Iin
νm
δν/4
ν−
m
νδν/4
m
Bulk
0.5
4
5
6
2
0
∆φ(xπ)
1.5
1
1.5
1
2.5
3
n2 Iπ/4
n2 Iπ
0.5
0
10−8
2
Group delay (ps)
10−7
10−6
10−5
10−4
10−3
n2 Iin
νm
δν/4
ν−
m
νδν/4
m
Bulk
Figure 9: Nonlinear response vsersus incident intensity n2 Iin .
that there are two means to increase the group delay (and
hence, the nonlinear response) within the passband:
(1) increase the in-band phase change Φib , and/or
(2) increase the filter order.
In general, the bandwidth, δν (along with the FSR)
should be a quantity chosen at the outset to match a specific application. For example, if the desired application were
to produce a phase shift on a single channel of a DWDM system, then δν ∼ δνch and FSR ∼ Nch δνch , where δνch is the
channel spacing and Nch is the number of channels.
Since AR filters are designed using the generalized Butterworth filter design, we do not have control over the in-band
phase to increase the group delay. We increase the group
delay by increasing the filter order, that is, the number of
stages in the architecture, which in turn increases the total
phase as well as the in-band phase. Figure 10 plots n2 Iπ as
a function of the group delay where the group delay is increased by increasing the filter order while keeping the band2.72
width constant. The quantity n2 Iπ scales as 1/kgd
and is
−4 −2.72
given by n2 Iπ = 19.55 × 10 kgd . The scaling of n2 Iπ with
group delay is not an accurate representation of the initial
design of the filter because by the time a π radian nonlinear phase shift is obtained, the filter characteristics change
(i.e., the new filter function is no longer just a shifted version of the initial function as assumed in the weak perturbation limit) because of increasing input intensity. Hence
n2 Iπ/4 is plotted as a function of group delay and is shown
0.82
in Figure 10. The quantity n2 Iπ/4 scales as 1/kgd
and is given
−5 −0.82
by n2 Iπ/4 = 12.46 × 10 kgd . This implies that in principle,
Figure 10: Improving nonlinear response by increasing the number
of stages and keeping BW = 0.12 FSR.
Table 2: Improving nonlinear response by increasing the AR filter
order with BW = 0.12 FSR.
Filter order
3
4
5
6
Group delay (ps)
1.36
1.77
2.19
2.64
n2 Iπ
1.03 × 10⁻³
3.20 × 10⁻⁴
2.01 × 10⁻⁴
1.70 × 10⁻⁴
n2 Iπ/4
9.59 × 10⁻⁵
7.89 × 10⁻⁵
6.56 × 10⁻⁵
5.54 × 10⁻⁵
the nonlinear response can be improved while maintaining
constant bandwidth by using higher-order filters. The filter
order, group delay, n2 Iπ , and n2 Iπ/4 are shown in Table 2 for
a bandwidth of 0.12FSR.
10.
10.1.
EXAMPLE AND EVALUATION OF
ARMA LATTICE FILTERS
Design and synthesis example
In this section, we design an optical ARMA lattice filter and
simulate it to obtain the nonlinear phase shift response. The
filter is synthesized by designing discrete filters according to
the description in Section 6.2 and then using the mapping
algorithm derived by Jinguji [22]. The circumference of each
microring in the ARMA lattice architecture is chosen as the
unit delay length and is equal to 50 µm. The center frequency
corresponds to a wavelength of 500 nm.
A maximum phase ARMA filter with four zeros and
four poles is designed using the procedure discussed in
Section 6.2. The filter bandwidth is set to be 0.05π in the fundamental range −π ≤ ω ≤ π. 4π out of the total 8π phase
change is allocated to the out-of-band phase change to maintain flat magnitude and linear phase response. Passband ripple is less than 0.1 dB and the stop-band magnitude is 18 dB.
10
−0.02
−10
−20
−1
Φ(xπ)
0
0.02
−0.5
0
0.5
Normalized frequency (xπ rad/sample)
1
−2
−4
−6
−0.02
−5
0
0.02
0
0.5
1
10−6
10−5
10−4
10−3
νδν/4
m
Bulk
3
2
1
85
80
75
50
4
∆φ(xπ)
Group delay (samples)
10−7
5
−0.5
100
−1
0
10−8
νm
δν/4
ν−
m
Normalized frequency (xπ rad/sample)
0
0.5
n2 Iin
0
−10
−1
1
0.2
0
−0.2
0
1495
Iout /Iin
Magnitude (dB)
DSP Approach to the Design of Nonlinear Optical Devices
−0.02
0
0
10−8
0.02
10−7
10−6
10−5
10−4
10−3
n2 Iin
−0.5
0
0.5
1
νm
δν/4
ν−
m
Normalized frequency (xπ rad/sample)
νδν/4
m
Bulk
Figure 11: Frequency response and group delay characteristic of a
4th-order real ARMA filter.
Figure 12: Nonlinear response versus incident intensity n2 Iin .
Table 3: Design values for a 4th-order real ARMA lattice filter.
ratio at this input intensity is 0.65. The nonlinear response
is also plotted for incident frequencies at νm ± δν/4 where
νm is the center frequency. As in the case of AR filter, the flat
magnitude response in the filter’s linear response allows for a
broadband nonlinearity. Also plotted for comparison is the
phase shift produced by the underlying material of length
L = kgd c/n ∼ 4 mm, which gives the same group delay as
that of the ARMA lattice architecture. The nonlinear phase
shift produced by the filter is 19 times better than the bulk
material [25]. The nonlinear phase shift enhancement over
bulk material is larger in the case of ARMA filters because of
two reasons. (1) The total phase change in the case of ARMA
filters is twice that of AR filters for equal number of stages.
This results in higher group delay in the case of ARMA filters and hence better nonlinear phase shift response. (2) The
group delay in case of AR filters is pushed towards the passband edges and hence, lower group delay at center frequency
results in lower nonlinear phase-shift enhancement.
As in the case of AR filters, random errors were added
to each of the design parameters, and the nonlinear response
was obtained to determine the parameter sensitivity. The allowable errors below which the nonlinear response is within
10% of the original value are ±0.001π for κrn , ±0.001π for
φrn , ±0.01π for κtn , and ±0.01π for φtn . A detailed sensitivity
analysis is presented in [24].
ktn
φtn
krn
φrn
n=0
0.1555
—
—
—
1
0.5513
2.9754
0.0594
0.0771
2
0.5289
-1.4868
0.0594
-0.0771
3
0.1733
1.3928
0.0784
0.0267
4
0.9418
2.0702
0.0784
-0.0267
Assuming the loss in the material to be 1cm−1 , the obtained
filter transfer function is
N(z)
D(z)
0.0656 − 0.3176z−1 +0.5661z−2 − 0.4424z−3 +0.1283z−4
=
.
1.0000 − 3.8531z−1 +5.5736z−2 − 3.5872z−3 +0.8667z−4
(31)
The frequency response and the group delay characteristic of
this filter are shown in Figure 11 showing that the designed
filter’s response matches with the ideal prototype response of
Figure 3 for the nonlinear phase shift.
This discrete filter is then mapped onto the optical
ARMA lattice architecture of Figure 7. Table 3 shows the coupling ratios and phase values thus obtained for each stage of
the optical filter.
The linear response of the synthesized optical filter is the
same as that of the discrete filter for low input intensity. The
nonlinear phase shift response of the ARMA filter is shown
in Figure 12 as a function of the normalized input intensity
n2 Iin , where n2 is the nonlinear coefficient of the underlying material and Iin is the input intensity. A π radian phase
change is obtained at n2 Iπ = 3.3 × 10⁻⁶ and the transmission
10.2.
Improving the nonlinear phase shift response
Similar to AR filters, the nonlinear phase shift response improves upon increasing the group delay and two means to
increase the group delay (aside from decreasing passband
width) are to either increase the in-band phase change Φib ,
and/or increase the filter order.
1496
EURASIP Journal on Applied Signal Processing
1.4
×10−3
6
×10−4
1.2
1
0.6
2π
2
0.4
4
6
4π
0.2
6π
0
2
n2 Iin
n2 Iin
4
0.8
1
2
3
4
5
Group delay (ps)
8
8π
6
7
0
8
1
2
3
4
5
6
7
8
Group delay (ps)
n2 Iπ
n2 Iπ/4
n2 Iπ
n2 Iπ/4
Figure 13: Improving nonlinear response by increasing the in-band
phase for a 6th-order ARMA filter with BW = 0.15 FSR.
Figure 14: Improving nonlinear response by increasing the number
of stages and keeping BW = 0.19 FSR, Φib /Φob = 0.5.
Table 4: Improving nonlinear response by increasing the in-band
phase for a 6th-order ARMA filter with BW = 0.15 FSR.
Table 5: Improving nonlinear response by increasing the ARMA
filter order with BW = 0.19 FSR, in-band to out-band phase ratio =
0.5.
In-band phase Φib Group delay (ps)
2π
1.67
4π
3.34
6π
4.99
8π
6.59
n2 I π
4.89 × 10⁻⁴
1.39 × 10⁻⁴
5.49 × 10⁻⁵
2.90 × 10⁻⁵
n2 Iπ/4
1.23 × 10⁻⁴
3.55 × 10⁻⁵
1.30 × 10⁻⁵
6.51 × 10⁻⁶
For a chosen bandwidth and fixed filter order, the first approach results in a trade-off between retaining the full phase
within the band and in-band ripple (there is also a trade-off
between Φib and rejection ratio, but, unlike for true bandpass
filters, here we are not concerned with having high rejection).
Therefore, a certain amount of the total phase change needs
to be allocated to Φob in order to reduce ripple. Figure 13
plots n2 Iin as a function of the group delay where group delay is increased by increasing the in-band phase in a 6thorder ARMA lattice filter while keeping a constant band1.90
width of 0.15FSR. The quantity n2 Iπ scales as 1/kgd
and is
−3 −1.90
given by n2 Iπ = 1.30 × 10 kgd . The quantity n2 Iπ/4 scales
1.92
−1.92
as 1/kgd
and is given by n2 Iπ/4 = 3.30 × 10⁻⁴ kgd
. The
in-band phase, group delay, n2 Iπ , and n2 Iπ/4 are shown in
Table 4.
The second approach increases the group delay by increasing the filter order, that is, the number of stages in the
architecture, which in turn increase the total phase as well
as the in-band phase. Figure 14 plots n2 Iin as a function of
the group delay where the group delay is increased by increasing the filter order while keeping the bandwidth and
Filter order
2
4
6
8
Group delay (ps)
1.27
2.62
3.95
5.27
n2 Iπ
3.71 × 10⁻⁴
1.48 × 10⁻⁴
8.80 × 10⁻⁵
6.01 × 10⁻⁵
n2 Iπ/4
8.27 × 10⁻⁵
3.73 × 10⁻⁵
2.23 × 10⁻⁵
1.50 × 10⁻⁵
1.28
the Φib /Φob ratio constant. The quantity n2 Iπ scales as 1/kgd
−4 −1.28
and is given by n2 Iπ = 5.10 × 10 kgd . The quantity n2 Iπ/4
1.15
−1.15
scales as 1/kgd
and is given by n2 Iπ/4 = 1.10 × 10⁻⁴ kgd
.
This implies that in principle, the nonlinear response can be
improved while maintaining constant bandwidth by using
higher-order filters. The filter order, group delay, n2 Iπ , and
n2 Iπ/4 are shown in Table 5 for a bandwidth of 0.19 FSR and
the in-band to out-band phase ratio of 0.5.
11.
CONCLUSIONS
In this paper, we have proposed that a discrete-time signal
processing approach can be used to design nonlinear optical devices by treating the desired nonlinear response in
the weak perturbation limit as a linear discrete filter. This
provides a systematic and intuitive method for the design
of nonlinear optical devices. We have demonstrated this approach by designing AR and ARMA filters to obtain a nonlinear phase shift response. This approach can be used for designing optical devices for various other nonlinear processes
as well.
DSP Approach to the Design of Nonlinear Optical Devices
REFERENCES
[1] S. Blair, J. E. Heebner, and R. W. Boyd, “Beyond the
absorption-limited nonlinear phase shift with microring resonators,” Optics Letters, vol. 27, no. 5, pp. 357–359, 2002.
[2] C. K. Madsen and J. H. Zhao, Optical Filter Design and Analysis: A Signal Processing Approach, Wiley, New York, NY, USA,
1999.
[3] T. A. Ibrahim, V. Van, and P.-T. Ho, “All-optical time-division
demultiplexing and spatial pulse routing with a GaAs AlGaAs
microring resonator,” Optics Letters, vol. 27, no. 10, pp. 803–
805, 2002.
[4] M. Soljacic, C. Luo, J. D. Joannopoulos, and S. Fan, “Nonlinear photonic crystal microcavities for optical integration,”
Optics Letters, vol. 28, no. 8, pp. 637–639, 2003.
[5] S. Blair, Optical soliton-based logic gates, Ph.D. dissertation,
University of Colorado, Boulder, Colo, USA, 1998.
[6] M. Soljacic, S. G. Johnson, S. Fan, et al., “Photonic-crystal
slow-light enhancement of nonlinear phase sensitivity,” Journal of the Optical Society of America B, vol. 19, no. 9, pp. 2052–
2059, 2002.
[7] Y. Chen and S. Blair, “Nonlinear phase shift of cascaded microring resonators,” Journal of Optical Society of America B,
vol. 20, no. 10, pp. 2125–2132, 2003.
[8] W. Nakagawa, R.-C. Tyan, and Y. Fainman, “Analysis of enhanced second-harmonic generation in periodic nanostructures using modified rigorous coupled-wave analysis in the
undepleted-pump approximation,” Journal of the Optical Society of America A, vol. 19, no. 9, pp. 1919–1928, 2002.
[9] P. P. Absil, J. V. Hryniewicz, B. E. Little, et al., “Wavelength
conversion in GaAs micro-ring resonators,” Optics Letters,
vol. 25, no. 8, pp. 554–556, 2000.
[10] A. Melloni, F. Morichetti, and M. Martinelli, “Optical slow
wave structures,” Optics and Photonics News, vol. 14, no. 11,
pp. 44–48, 2003.
[11] A. Hasegawa and Y. Kodama, “Signal transmission by optical solitons in monomode fiber,” Proc. IEEE, vol. 69, no. 9,
pp. 1145–1150, 1981.
[12] A. Melloni, F. Morichetti, and M. Martinelli, “Linear and nonlinear pulse propagation in coupled resonator slow-wave optical structures,” Optical and Quantum Electronics, vol. 35,
no. 4-5, pp. 365–379, 2003.
[13] J. E. Heebner and R. W. Boyd, “SCISSOR solitons and other
novel propagation effects in microresonator-modified waveguides,” Journal of the Optical Society of America B, vol. 19,
no. 4, pp. 722–731, 2002.
[14] D. A. B. Miller, S. D. Smith, and A. Johnston, “Optical bistability and signal amplification in a semiconductor crystal: applications of new low-power nonlinear effects in InSb,” Applied
Physics Letters, vol. 35, no. 9, pp. 658–660, 1979.
[15] H. M. Gibbs, Optical Bistability: Controlling Light with Light,
Academic Press, Orlando, Fla, USA, 1985.
[16] M. Soljacic, M. Ibanescu, S. G. Johnson, Y. Fink, and J. D.
Joannopoulos, “Optimal bistable switching in nonlinear photonic crystals,” Physical Review E, vol. 66, no. 5, pp. 055601-1–
055601-4, 2002.
[17] I. W. Selesnick and C. S. Burrus, “Generalized digital butterworth filter design,” in Proc. IEEE Int. Conf. Acoustics, Speech,
Signal Processing (ICASSP ’99), vol. 3, pp. 90–95, Phoenix,
Ariz, USA, May 1999.
[18] P. P. Vaidyanathan, Multirate Systems and Filter Banks, Prentice Hall, Englewood Cliffs, NJ, USA, 1993.
[19] B. Farhang-Boroujeny, Adaptive Filters: Theory and Applications, John Wiley & Sons, Chichester, UK, 1998.
1497
[20] E. C. Levi, “Complex-curve fitting,” IRE Transactions on Automatic Control, vol. 4, pp. 37–44, 1959.
[21] C. K. Madsen and J. H. Zhao, “A general planar waveguide autoregressive optical filter,” J. Lightwave Technol., vol. 14, no. 3,
pp. 437–447, 1996.
[22] K. Jinguji, “Synthesis of coherent two-port optical delay line
circuits with ring waveguides,” J. Lightwave Technol., vol. 14,
no. 8, pp. 1882–1898, 1996.
[23] Y. Chen, Nonlinear optical process enhancement by artificial
resonant structures, Ph.D. dissertation, University of Utah, Salt
Lake City, Utah, USA, 2004.
[24] G. Pasrija, “Discrete-time signal processing approach to the
design of nonlinear optical devices,” M.S. thesis, University of
Utah, Salt Lake City, Utah, USA, 2004.
[25] Y. Chen, G. Pasrija, B. Farhang-Boroujeny, and S. Blair, “Engineering the nonlinear phase shift,” Optics Letters, vol. 28,
no. 20, pp. 1945–1947, 2003.
Geeta Pasrija received her M.S. degree in
electrical engineering from the University of
Utah in 2004. Currently, she is working at
SR Technologies Inc., and is involved in the
design of a software-defined radio for satellite communications.
Yan Chen received her Ph.D. degree in
electrical engineering from the University
of Utah in 2004. From 1997 to 1999, she
worked at Optical Memory National Engineering Research Center China, as a Research Assistant and Lecturer. Currently, she
is working in the area of semiconductor
lithography software development for Timbre Technologies Inc.
Behrouz Farhang-Boroujeny received his
Ph.D. degree from Imperial College, University of London, UK, in 1981. From 1981
to 1989 he was at Isfahan University of Technology, Isfahan, Iran. From 1989 to 2000
he was at the National University of Singapore. Since August 2000, he has been with
the University of Utah. He is an expert in the
general area of signal processing. His current scientific interests are in adaptive filters, multicarrier communications, detection techniques for spacetime coded systems, and signal processing applications to optical
devices.
Steve Blair received his Ph.D. degree from
the University of Colorado at Boulder in
1998. He has been an Assistant Professor
in the Electrical and Computer Engineering
Department at the University of Utah since
then. His research interests include slowlight nonlinear optics, nanoscale photonics,
and real-time molecular detection arrays.