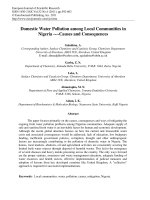
household debt in korea causes and policy responses
Bạn đang xem bản rút gọn của tài liệu. Xem và tải ngay bản đầy đủ của tài liệu tại đây (801.5 KB, 46 trang )
Household Debt in Korea:
Causes and Policy Responses
2015. 11. 07.
CAU MBA
Chang-Gyun Park (Chung-Ang University)
Introduction
Household debt is regarded as one of the most serious risk
factors that can threaten the stability of financial system.
started to increase from early 2000’s after the foreign exchange
crisis in 1997.
showed explosive growth between 2000 and 2002 with average
annual growth rate of 25%.
stabilized after “credit card crisis” in 2002/03 with average annual
growth rate of 7.8%, still higher than growth rate of income.
The concern on household debt emerged as the primary
policy concern after the global financial crisis in 2007/08.
Korean household sector was able to avert a serious turbulence
through the crisis.
became the center of attention as prolonged recession and
stagnant real estate market after the crisis.
Introduction
Two episodes: credit card crisis and accumulation of
mortgage loan
Credit card crisis: textbook example of regulatory failure
Outstanding credit card debt: 13.6 trill.(‘99) → 50.6 trill.(’02) → 17.6 trill.
(‘05)
Violent crash lending in 2002/03
Accumulation of mortgage loan: risk factor but managed
Mortgage loan accounts for almost 50% of total household debt and
majority(70%) stays in the balance sheets of commercial banks.
Short term adjustable rate baloon loan takes up more than 70% of total
mortgage loan balance.
The structure is very vulnerable to external shocks, especially housing
price shock.
Policy efforts focuses on restructuring the mortgage loan structure
replacing baloon loans with long term fixed rate amortizing loans.
Household Debt in Korea
Three phases in growth of household debt
1st phase(1997~1999): slump after the FX crisis in 1997
The FX crisis was followed by tumultuous restructuring of financial
market and the recession largely induced by tight monetary policy to
defend balance of payment.
2nd phase (2000~2002): fast accumulation of debt
outstanding balance: 211 trill.(‘97) → 184 trill.(‘98) → 214 trill.(’99)
outstanding balance: 267. till.(‘00) → 342. till.(‘01) → 417 trill.(‘02)
Restructuring of financial sector enabled banks to enter consumer
credit market and large scale de-regulation allowed financial
institutions to take excessive.
Mortgage loan by bank and credit card loan led the explosive debt
accumulation.
3rd phase (2003~ ): steady increase of debt burden
Average annual growth rate ‘03~’13: 7.8%
Boom in housing market drove debt growth rate up to 10% between
2005 and 2008.
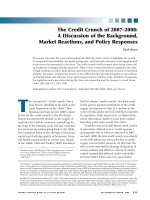
Trend in Household Debt
Housing market
boom
Mortgage loan
and Credit card
debt led the
boom.
Source: Bank of Korea
Debt Burden
Debt burden is already relatively heavy.
Debt-to-(net) disposable income ratio was 160% in 2012.
Ranked 8th among 27 OECD countries and far higher than OECD
average of 132%.
Source: OECD
Debt Burden
Debt-to-income ratio was low in early
2000’s relative to other OECD
countries.
Trend in Debt-to-Disposable Income among Selected OECD Countries
Debt-to-disposable income: 81%(‘99) →
120%(‘03) → 139%(‘07) → 151%(’10) →
160%(‘12)
started the new millennium with
relatively low debt burden
steady increase in debt burden – debt
accumulation has been consistently
faster than increase in disposable
income.
became one of the most indebted
countries among OECD members
Source: OECD
Debt Distribution: Probability of Debt Holding
Probability of debt holding across age and income
Probability of debt holding is highest among people of age 40-49,
recorded the largest increase among people of age 50-59.
Probability of debt holding is positively correlated with income
and so is the increase in the probability of debt holding.
Age
-29
30-39
40-49
50-59
60-
Total
2001
0.3338
0.5683
0.5655
0.4460
0.2418
0.4664
2013
0.5562
0.7369
0.7704
0.7363
0.4499
0.6507
Difference
0.2224
0.1686
0.2049
0.2903
0.2081
0.1843
Income
Quintile
1
2
3
4
5
Total
2001
0.2720
0.4402
0.5142
0.5756
0.5307
0.4664
2013
0.3077
0.6075
0.7325
0.7921
0.8172
0.6507
Difference
0.0356
0.1673
0.2182
0.2165
0.2865
0.1843
Debt Distribution: Debt Burden
Debt-to-disposable income ratio distribution across age and
income.
Debt burden reached the peak at the 40’s and is negatively
correlated with income level.
Increase in debt burden is conspicuous among old/low income
household.
Age
-29
30-39
40-49
50-59
60-
Total
2001
0.1693
0.4387
0.6272
0.5329
0.4010
0.4775
2013
0.6815
1.0635
1.5207
1.4279
1.3885
1.6071
Difference
0.5122
0.6248
0.8936
0.8950
0.9875
1.1296
Income
Quintile
1
2
3
4
5
Total
2001
0.9603
0.4062
0.3884
0.3490
0.2840
0.4775
2013
3.0652
1.3643
1.1242
1.1770
1.2509
1.6071
Difference
2.1049
0.9581
0.7748
0.8280
0.9670
1.1296
Debt Distribution: Solvency
Debt-to-financial asset ratio distribution across age and income.
On average, accumulate financial assets are not enough to pay out
debt.
Inadequate liquidity/solvency is negatively correlated with income
and solvency deteriorated most among the 50’s and lowest income
quintile families.
Age
-29
30-39
40-49
50-59
60-
Total
2001
0.7332
1.1319
1.1935
0.8230
0.9158
1.2336
2013
0.4364
1.0149
1.0180
1.2655
1.0532
1.0702
Difference
-0.2968
-0.1170
-0.9171
0.4425
0.1374
-0.1634
Income
Quintile
1
2
3
4
5
Total
2001
2.0931
1.9935
1.7082
0.2732
0.1760
1.2336
2013
3.8272
2.4904
0.3433
0.2147
0.1891
1.0702
Difference
1.7341
-1.2506
-1.3650
-0.0585
0.0132
-0.1634
Determinant of Debt Holding/Burden
Heckman selection model
Debt holding equation:
Explanatory variables: log(income), family size, marriage, education,
age, self-employed, homeownership + net financial asset
Debt burden equation: log(income), family size, marriage,
education, age, self-employed, homeownership
Dependent variable: dummy for debt holding
Dependent variable: debt/disposable income
Explanatory variables: log(income), family size, marriage, education,
age, self-employed, homeownership
Household Finance and Welfare Survey 2006, 8275 observations,
ML estimation
Determinant of Debt Holding/Burden
Debt
holding
equation
Ex. Var
Coefficient
(S.E.)
log(income)
0.182***
(0.004)
log(Net Asset)
0.001***
(0.0002)
Family size
Debt
burden
equation
Ex. Var
Coefficient
(S.E.)
log(income)
1.113***
(0.082)
0.007***
(0.001)
Family size
0.095***
(0.007)
Marriage
(married=1)
0.014***
(0.003)
Marriage
(married=1)
0.134***
(0.018)
Education 1
(high school =1)
0.015***
(0.003)
Education 1
(high school =1)
0.161***
(0.018)
Education2
(college=1)
0.016***
(0.003)
Education2
(college=1)
0.171***
(0.020)
Age(45-54)
-0.005
(0.003)
Age(45-54)
-0.056***
(0.023)
Age(55-64)
-0.012
(0.004)
Age(55-64)
-0.154**
(0.026)
Age (65-)
-0.047***
(0.005)
Age (65-)
-0.515***
(0.029)
Self Employed
0.017***
(0.004)
Self Employed
0.180***
(0.022)
Unemployed
0.003
(0.004)
Unemployed
0.012
(0.022)
Home ownership
0.053***
(0.004)
Home ownership
0.588***
(0.014)
Composition of Debt Suppliers
Banks have been the biggest credit supplier to the household
sector and their market share had increased up until mid-2000’s.
Before 2000, non-bank deposit taking institutions (NBDI) such as
savings banks, credit unions, and cooperatives were the biggest
lender in consumer credit market.
NBDIs were hit hard by the FX crisis in 1997 and subsequent restructuring of
financial sector.
NBDIs’ role in consumer credit market started to increase only after mid2000’s when restructuring of the sector was in most part completed.
The increase in banks’ market share was mostly due to growth of
mortgage loans.
The proportion of mortgage loan in total bank loans to the household sector
was 47.8 percent at the end of 2000, it had continuously risen to reach 62.4
percent in 2005.
From 2001 to 2005, 71% of consumer credit increase provided by banks was
attributable to increases in mortgage loans.
Composition of Debt Suppliers
Another major contributor to consumer credit increase after
1999 was credit card companies.
Credit card companies were subsidiaries of commercial banks or
big industrial conglomerates.
Ill-advised de-regulation and lack of risk management system
caused credit card companies to get involved in reckless
competition to secure larger market share.
Credit card debt increased by 270% from 1999 to 2002.
Regulatory intervention to curb explosive increase of credit card
debt exposed structural weakness of the industry and the market
contracted even faster than the speed it expanded.
By the third quarter of 2005, the outstanding balance of credit
card debt reached the level in 1999.
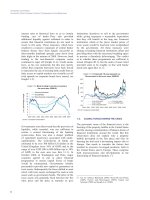
Composition of Debt Suppliers
Source: BOK
Credit Card Debts
Source: Financial Supervisory Service.
Notes: The bar chart indicates quarter-to-quarter change in outstanding balance and should be read by the
scale on the right-hand side. Scale is in trillion Korean Won. The line graph indicates the outstanding balance
at the end of each quarter and should be read by the scale on the left-hand side. Scale is in percentage.
Cause 1: Deregulation of Financial Sector
FX crisis in 1997 changed the way financial institutions,
especially commercial banks, were operated in a
fundamental way.
Under the old regime, banks were regarded as instrumental agents to
mobilize savings and channel them to strategically selected industries and
profitability of individual banks was not a primary concern as long as
banks served to meet the policy goals set by the government.
Under the new regime, efficiency in the allocation of credit resources
became the primary concern of financial regulation, and price
mechanism replaced the government as the main player in credit
resource allocation.
Implicit but strong restrictions on interest rate and service fees were abolished,
Foreign banks were allowed to enter the market. Financial Holding Company Act
was legislated to promote competition.
Banks were set free to enter consumer credit market and led
the market as the largest supplier.
Cause 2: Profitability of Household Loans
Free from government intervention,
commercial bank concentrated on
household loans that brought higher
interest rate and lower default rate
than corporate loans
Household Loan vs. Corporate Loan
Household Loan
Year
Corporate Loan
Interest
rate
Default
rate
Interest
rate
Default
rate
1999
10.85
3.2
8.91
4.4
2000
9.88
2.4
8.18
3.4
2001
8.20
1.3
7.49
2.1
2002
6.92
1.5
6.50
2.0
2003
6.50
1.8
6.17
2.1
2004
5.88
1.8
5.92
2.1
2005
5.49
1.2
5.65
1.5
Financial institutions including banks
among themselves were involved in
ever escalating competition to
acquire size advantage by
accumulating more assets.
In the absence of properly working risk
management system, lenders are
likely to ask enough collaterals, which
mortgage borrowers are ready to
comply.
Cause 3: Low Interest Rate and increasing Housing Price
Low interest rate stimulated asset
price and offers favorable
environments for borrowers.
Trend in Interest Rates during 2000’s
Increase in housing prices spurred
expectation on capital gains and
boosted home purchase
Housing Price Index
Cause 4: Diminished Loan Demand from Corporate Sector
Free from government intervention,
commercial bank concentrated on
household loans that brought higher
interest rate and lower default rate
than corporate loans
Household Loan vs. Corporate Loan
Household Loan
Year
Corporate Loan
Interest
rate
Default
rate
Interest
rate
Default
rate
1999
10.85
3.2
8.91
4.4
2000
9.88
2.4
8.18
3.4
2001
8.20
1.3
7.49
2.1
2002
6.92
1.5
6.50
2.0
2003
6.50
1.8
6.17
2.1
2004
5.88
1.8
5.92
2.1
2005
5.49
1.2
5.65
1.5
Financial institutions including banks
among themselves were involved in
ever escalating competition to
acquire size advantage by
accumulating more assets.
In the absence of properly working risk
management system, lenders are
likely to ask enough collaterals, which
mortgage borrowers are ready to
comply.
Cause 4: Diminished Loan Demand from Corporate Sector
Financing pattern of the (large) corporate sector changed in
a fundamental way.
Before FX crisis, large conglomerates largely relied on bank loans
rather then capital market instruments in securing investment
capital.
The structural fragility of the debt-driven development
became obvious when sudden and massive capital outflow
forced large conglomerates to declare bankruptcy or resort
to restructuring procedures to survive.
Policy makers accepted the reality by requiring the corporate
sector to strengthen the financial structure by reducing debt
and injecting more equity capital.
The largest demander for bank loan, large conglomerates,
suddenly disappeared.
An Analysis
VAR analysis of four-variable system;
average consumer loan rate, housing(apartment) price growth
rate, GDP growth rate, growth rate of household debt
All variables are in real terms and quarterly data from 2000 to 2013.
IRF and FEVD
Housing
price →
credit
growth
credit
growth →
credit
growth
GDP growth
→ credit
growth
Interest rate
→ credit
growth
Development of Credit Card Crisis
Spectacular growth of credit card use and debt
The number of merchants accepting credit cards was less than
one million in 1992, and increased to 17 million in 2003.
credit cards per person: 1(‘93) → 2(‘98) → 4.6(‘02)
private consumption paid by credit cards: 15.5%(‘99) → 51%(‘02)
Outstanding credit card debt: 13.6 trill.(‘99) → 50.6 trill.(’02) → 17.6
trill. (‘05)
Fast Deterioration of Loan Quality
The overdue loan rate started to crawl up in the second half
of 2001 recording 10.9% at the end of 2002.
It seemed that the steep increase in the overdue rate was
temporarily halted during the first half of 2003, which was seriously
misleading.
Confronted with mounting overdue loans, credit card companies
tried to window-dress the quality of their loan portfolios by
replacing overdue loans with additional credit to debtors in
serious arrears.
Classifying replaced loans as overdue ones, the actual overdue
rate was twice as high as the rate excluding replacing loans.
Profitability and quality of loan portfolios by credit card
companies sent strong warning signs from the second half of
2002.