Potential Challenges Faced by the U.S. Chemicals Industry under a Carbon Policy
Bạn đang xem bản rút gọn của tài liệu. Xem và tải ngay bản đầy đủ của tài liệu tại đây (319.16 KB, 20 trang )
Sustainability 2009, 1, 592-611; doi:10.3390/su1030592
OPEN ACCESS
sustainability
ISSN 2071-1050
www.mdpi.com/journal/sustainability
Article
Potential Challenges Faced by the U.S. Chemicals Industry
under a Carbon Policy
Andrea Bassi 1,2,* and Joel Yudken 3
1
2
3
Millennium Institute, 2111 Wilson Blvd, Suite 700, Arlington, VA 20001, USA
University of Bergen, Postboks 7800, 5020 Bergen, Norway
High Road Strategies / 104 N, Columbus Street, Arlington, VA 22203, USA;
E-Mail:
* Author to whom correspondence should be addressed; E-Mail: ;
Tel.: +1-703-351-5081; Fax: +1-703-351-9292.
Received: 29 July 2009 / Accepted: 31 August 2009 / Published: 3 September 2009
Abstract: Chemicals have become the backbone of manufacturing within industrialized
economies. Being energy-intensive materials to produce, this sector is threatened by
policies aimed at combating and adapting to climate change. This study examines the
worst-case scenario for the U.S. chemicals industry when a medium CO 2 price policy is
employed. After examining possible industry responses, the study goes on to identify and
provide a preliminary evaluation of potential opportunities to mitigate these impacts. If
climate regulations are applied only in the United States, and no action is taken to invest in
advanced low- and no-carbon technologies to mitigate the impacts of rising energy costs,
the examination shows that climate policies that put a price on carbon could have
substantial impacts on the competiveness of the U.S. chemicals industry over the next two
decades. In the long run, there exist technologies that are available to enable the chemicals
sector to achieve sufficient efficiency gains to offset and manage the additional energy
costs arising from a climate policy.
Keywords: chemicals; petrochemical; chlorine; alkaline; climate policy; dynamic
modeling; industry competitiveness; cap and trade
Sustainability 2009, 1
593
1. Introduction
With the growing use of chemicals in the manufacturing of goods within the economy, comes an
equally large increase in the amount of energy used in the process. The chemicals industry covers a
broad spectrum of bases and products used in everyday items, and the energy usage of the sector is
often overlooked. When attempting to analyze such a large entity with so many facets, it becomes
difficult to develop projections of future impacts of external forces. One shift that will have
ramifications on this industry is the move towards carbon pricing and attempts to mitigate the negative
impacts of anthropogenic emissions on the climate. When artificial costs are imposed on the industry,
it is difficult to predict the outcome.
When the U.S. Department of Energy’s Energy Information Administration analyzes different
pieces of climate legislation it mostly calculates projected impacts on broad economic indicators, such
as GDP, total consumer spending, and industrial output [1-4]. Many other studies, by
environmentalists and academic economists, use general equilibrium models that also mostly yield
economy-wide impacts, though some contain industrial input-out (I-O) modules, which can calculate
distributional effects, mainly at a high level of sector aggregation [5].
In recognition of these challenges, the present study, which uses the Integrated Industry Model—
Carbon Policy (IIM-CP), examines the carbon permits system’s impacts (e.g., energy price changes
resulting from a carbon-pricing policy) on the competitiveness of the U.S. chemical sector, which
produces among the most energy-intensive products, and its participation in the international market. It
further examines possible industry responses, and identifies and provides a preliminary evaluation of
potential opportunities to mitigate these impacts.
Since the new administration has made public that it intends to approve climate legislation before
the Conference of Parties (COP15) to be held in December 2009, the main body of the study proposes
what can be considered the worst case scenario for the U.S. chemical industry. This is due to the
boundaries of the analysis and the assumptions underlying various scenarios.
Furthermore, this partial equilibrium study hopes to build on the general equilibrium analyses
already available [2-4] by researching the impacts of climate legislation on selected four to six digits
NAICS (North American Industry Classification System), while avoiding the study of the broader
economy-wide policy repercussions (both positive and negative).
Employing a computer-based, System Dynamics modeling approach, supplemented by econometric
and qualitative analyses, the study investigates three questions:
How will climate policy-driven energy price increases affect the production costs and
profitability of manufacturers in the chemical sector?
In the face of energy-driven cost increases, and constraints on manufacturers’ ability to pass
these costs along to consumers, how will international competition affect the industry’s
competitiveness (i.e., profitability and market share)?
How could manufacturers respond to the energy price increases and possible threats to
their competitiveness?
These questions have been examined for a selected energy price increase associated with the
Climate Security Act of 2007 (S. 2191) [6], a ―Mid-CO2 Price Policy‖ case, introduced by Senators
Joseph Lieberman (I-CT) and John Warner (R-VA). EIA’s analysis of the ―Mid-CO2 Price Policy‖
Sustainability 2009, 1
594
projects the inflation-adjusted (USD 2006) allowance price to be $30 per metric ton of CO 2-equivalent
by 2020 and $61 by 2030 [2]. The AEO 2008 projects the highest price increases by 2030, under the
Mid-CO2 Price Policy case, for carbon intensive energy sources, such as coal coke and metallurgical
coal (+180%), followed by residual fuel oil (+43%), natural gas (+39%) and distillate fuel oil (+24%).
Finally, electricity and liquefied petroleum gas will incur small and no increases, +13.1%
and –0.1% respectively [2].
2. Chemicals Industry Overview
Chemicals manufacturing is one of the largest manufacturing industries in the U.S. economy. In
2006, it shipped a total of more than $637 billion (109) worth of goods and employed 869,000
workers [7]. In 2005, there were over 9,500 firms with 13,200 establishments that manufacture
chemical products, located in every state in the union. These include businesses of every size,
including 1,425 medium-sized manufacturing plants with 100–500 employees, and 3,405 large
facilities with more than 500 employees, which employ more than 85 percent of workers in the
industry. Chemicals manufacturing is also the largest exporting sector in the U.S. economy. In 2006,
the U.S. chemicals industry exported $135.1 billion and imported $142.8 billion producing a trade
deficit of $7.7 billion [7].
The chemicals industry produces over 70,000 products used in every sector of the economy. It is a
primary supplier of intermediate inputs to agriculture, other manufacturing industries, construction,
and service industries, as well as thousands of consumer goods. Major manufacturing sector customers
include rubber and plastic products, textiles, apparel, petroleum refining, pulp and paper, and primary
metals. It also consumes 26 percent of its own output to produce downstream products that are
intermediate goods used in other industries or in end-use products.
Chemicals manufacturing (NAICS 325) has five major divisions. Its largest sector, basic chemicals
(NAICS 3251), which accounted for more than a third of the total dollar output of the chemicals
industry [7], consists of several smaller industrial sectors. These include inorganic chemicals
(including alkalies and chlorine, industrial gases, acids and inorganic pigments), petrochemicals and
derivatives (including organics), and synthetic materials, such as plastic resins, synthetic rubber, and
man-made fibers.
In this study, we examined two important and highly energy intensive industries within the basic
chemicals sector: petrochemical manufacturing (32511) which includes establishments that
manufacture acyclic (aliphatic) hydrocarbons (ethylene, propylene, and butylenes), and cyclic aromatic
hydrocarbons (benzene, toluene, styrene, xylene, ethyl benzene, and cumene) made from refined
petroleum or liquid hydrocarbons; and, alkalies and chlorine (chlor-alkali) manufacturing (325181),
comprised of establishments primarily engaged in manufacturing chlorine, sodium hydroxide (i.e.,
caustic soda), and other alkalies [8].
Sustainability 2009, 1
595
Table 1. Energy intensity*† for selected energy sectors, 2006. Industries in bold are
examined in the study.
NAICS Code
1-33
325
3251
Industry Sector
Manufacturing
Chemicals Manufacturing
Basic Chemicals
Energy Intensity* [Percent]
2.9
5.6
10.2
32511
Petrochemicals
8.0
325181
331
322
Alkalies and Chlorine
Primary Metals
Paper Manufacturing
38.9
6.4
7.3
* Energy intensity is calculated as the share of total energy expenditures (fuel
and electricity) as a share of total operating expenditures (roughly equal to
sum of materials costs, labor compensation and new capital expenditures in
the Census Bureau's Annual Survey of Manufactures, 2006);
† Does not include expenditures on energy fuels used as manufacturing
feedstock (e.g., natural gas used in petrochemical production; coke used in
steel production).
2.1. Petrochemical Manufacturing
According to 2005 Census Bureau data [9], the U.S. petrochemical industry is comprised of 34
firms with 45 establishments employing nearly 7,400 workers, including 24 large manufacturing
facilities with more than 500 employees. About 70 percent of petrochemicals and downstream
derivatives are produced in facilities located in the Gulf Coast region. Because the refining industry is
the major supplier of raw materials for ethylene production, more than 50 percent of all ethylene plants
are located at petroleum refineries.
In 2006, U.S. petrochemical manufacturers produced 127.5 billion pounds and shipped $60.8 billion
worth of goods [10]. Ethylene is the largest volume product made by the industry. Others include
propylene and benzene. These products are feedstock used in the production of a very large number of
derivative chemical products, many in turn used to produce further downstream products that are
inputs for many different industries. For example, ethylene is used to produce ethylene dichloride, used
in turn to produce vinyl chloride, and then polyvinylchloride (PVC) used in pipes, siding, windows,
pool liners and other construction items.
The U.S. petrochemical industry ended 2007 with a net trade deficit, with 3.1 million metric tons
(mmt) or $2.8 billion worth of imports, exports of 1.5 mmt tons ($1.6 billion) and net imports of
1.6 mmt ($1.2 billion). Trade flows between U.S. and Canadian buyers and sellers far outpaced trade
with any other country. Canada is an especially large net exporter of petrochemicals to the United
States. Other major trade partners include South Africa, Mexico, Norway and Belgium.
Sustainability 2009, 1
596
2.2. Chlor-Alkali Manufacturing
The chlor-alkali industry has 29 firms with 47 establishments employing nearly 7,800 workers,
including 25 establishments with over 500 employees [9]. The vast majority of chlorine production
takes place in the South, where companies are located to take advantage of low electricity prices and
reasonable labor costs. Chlor-alkali plants in the United States are aging. A 2000 Lawrence Berkeley
National Laboratory report indicates that most U.S. chlor-alkali plants were 20–25 years old at the
time, and some were considerably older [11].
U.S. chlor-alkali firms produced 32.5 million short tons, valued at $6.4 billion [10]. Chlorine is
used in downstream products (e.g., vinyl, phosphene, HCL, solvents), in water treatment and in other
industrial processes, such as in pulp and paper manufacturing. Caustic soda finds applications in the
production of organic chemicals, pulp and paper, inorganic chemicals, alumina refining, soaps and
detergents, textiles, water treatment, food industry, among others.
The chlor-alkali industry has a large positive trade balance, with net exports of 7.2 mmt, worth
$1.1 billion. In both industries, trade flows between U.S. and Canadian buyers and sellers far outpaced
trade with any other country. Canada is a net importer of U.S. chlorine and alkaline products. Other
major trade partners include Mexico, Brazil, Japan, and Australia.
3. Literature Review
There is increasing scientific evidence indicating that the climate is going through anthropogenicinduced changes; and policymakers are beginning to take action. One of the biggest fears is the effect
that an artificial rise in energy costs would have on energy-intensive manufacturing sectors. This study
aims at quantifying the worst-case scenario for the chemicals industry and to evaluate whether the
concerns expressed over climate legislation during the last few years are well founded.
One of the main motivations for this study is the acknowledgment that until recently the economic
debate on climate policies has been supported by general equilibrium studies, and limited to
macroeconomic impacts of climate policies, which investigate the broader economic impacts of a
policy intervention. When the U.S. Department of Energy (DOE-EIA), and most other
environmentalists and academic economists, analyze different pieces of climate legislation, they
generally calculate projected impacts on GDP, total consumer spending, and industrial output [1-4].
Some other studies contain industrial input-out (I-O) modules, which can calculate distributional
effects, mainly at a high level of sector aggregation [5]. The modest climate policy impacts observed—
for example, from a fraction of a percent to only a couple of percent declines in GDP by 2020 or
2030—indicate that climate policies will have small or minimal impacts on a nation’s economy [4,12].
At worst, they show that GHG policies are likely to have significant direct impacts on coal and other
domestic energy industries [2].
A relatively small number of studies have attempted to examine climate policies and their
implications for manufacturing industries in much depth. One set of studies are largely qualitative—
they don’t quantify policy impacts on industry sectors, but include in-depth industry profiles, and
evaluate different energy and climate policy options in light of industry analyses [3,12,13]. Another set
of studies apply modeling tools in attempts to quantify these impacts [5,14-20]. Among others, the
Sustainability 2009, 1
597
latter category include Resources for the Future (RFF) ongoing studies aimed at understanding how
carbon-dioxide charges affect industrial competitiveness, measured as impacts on operating costs,
profits, and production output [5,15]. In addition, two detailed studies of the impacts of the European
Union Emissions Trading Scheme (EU ETS) on the competitiveness of European manufacturing
industries provide a good degree of detail. Their focus on the other hand was on narrower, more
energy-intensive industrial categories than traditional economic studies usually evaluate [16,21].
Important insights and lessons emerge from these studies, as a RFF paper notes, ―the impact of a
CO2 price on domestics industries is fundamentally tied to the energy (and more specifically carbon)
intensity of those industries, the degree to which they can pass costs on to the consumers of their
products (often other industries), and the resulting effect on U.S. production‖ [15]. Another concern is
the carbon leakage problem: increased U.S. production costs cause energy-intensive manufacturers to
shift their operations to nations that have weaker to, or do not adopt, GHG limiting policies,
undermining the environmental objectives of the domestic policy.
Only a few studies over the past decade have attempted to evaluate climate policies and their impact
on the manufacturing sector, especially on energy-intensive industries, using dynamic modeling
tools [16-20]. This study is a new addition to this small group.
4. Research Approach
The research methodology employed utilized historical economic data and the construction of a
substantial, System Dynamics partial equilibrium industry sector model to develop detailed economic
and energy profiles of the chemical industry. Accompanied by group model building sessions, more
robust modeling techniques could be developed, which in turn led to stronger and more
relevant conclusions.
The System Dynamics methodology supports the representation of the context in which policies are
formulated and evaluated, using feedback loops, non-linearity and delays [22]. Such properties of
complex systems are explicitly analyzed and accounted for in the partial equilibrium model hereby
proposed. This is particularly advised when considering that the enactment of a climate policy has no
precedents in history and may trigger feedback loops generating unprecedented and unexpected
behavior [23]. For this reason optimization tools, econometrics and Computable General Equilibrium
(CGE) models may generate an analysis limited to historical experience, narrow boundaries and
detailed complexity [23]. The IIM-CP model customized to the iron and steel sector is intended to
complement existing general equilibrium studies, assessing the impacts of climate policies on selected
industry segments at a level of detail (four to six digits NAICS) that cannot generally be addressed
with economy-wide models.
The modeling work proposed in this study followed a three-phased approach. First, we constructed
a basic production cost model for the chemicals industry. This was then extended and broadened to
enable modeling of market dynamic features, that accounted for international trade flows and their
impacts on the industry’s bottom-lines and outputs, under the different emissions pricing scenarios and
under different market assumptions (e.g., regarding cost pass along). Finally, results of the simulation
helped to inform our analyses of investment and policy options, the third leg of the study, for the
industry. However, although no direct modeling of investment issues was attempted, we did undertake
Sustainability 2009, 1
598
a preliminary modeling of an important policy alternative aimed at offsetting cost and market impacts
and we investigated needed energy efficiency improvements to offset increasing energy costs. Finally,
we carried out several sensitivity simulations using our models to examine variations in our results
from different assumptions about key model variables, notably materials costs, domestic and world
prices, elasticities of demand and energy efficiency improvement rates.
The main baseline assumptions used to calibrate the model are contained in Table 2 below. All
assumptions were discussed with industry representatives to fully incorporate their view and
understanding of the market/industry in the modeling work hereby presented. Many assumptions were
directly simulated and tested in real time during group modeling sessions and meetings.
Data were gathered from The U.S. Department of Energy’s Industrial Technologies Program
(ITP) [24] and the Manufacturing Energy Consumption Survey (MECS) [25], the U.S. Census
Bureau’s Annual Survey of Manufacturers (ASM) [10], the United States International Trade
Commission (USITC), the U.S. Geological Survey (USGS), and Global Insight (GI), which provided
data projections on market prices that were then used to define market prices and materials cost trends
in the II-CPM simulations [26].
Table 2. Main industry assumptions used in IIM-CP.
Market Price
(domestic and ROW)
Feedstock
Labor Costs
and Material Costs
Petrochemicals
Energy
GDP/Demand
Costs
Indexed to GI prices
Compensation:
Natural gas
Long-term trend:
projections,
Constant in real terms
and LPG
slowly decreasing ratio.
3% average growth
Labor Intensity:
feedstock
1.67% average growth
rate 2008/2030
long term trend then
rate 1992/2030
flattens in 2020
Alkalies & Chlorine
Indexed to GI prices
Compensation:
LPG
Long-term trend:
projections,
Constant in real terms
feedstock
slowly decreasing ratio.
2% average growth
Labor Intensity:
0% average growth rate
rate 2008/2030
constant
1992/2030, 0.2%
growth rate after 2007
Other Assumptions
and Specifications
Compensation: long term trend takes into account forecasted inflation (CBO/EIA) and
historical increase in compensation.
Energy Intensity: based on MECS 2002 and energy efficiency increasing by 0.25% per
year in reference case for future projections.
We simulated a variety of scenarios for the chemical industry, as summarized below:
Core Scenarios. Simulations estimating the impacts of the Mid-CO2 Price Case relative to BAU,
assuming no cost pass-along by the industry to its customers (NCPA).
Cost Pass-Along Scenarios. Simulations of the CO 2 price case relative to BAU assuming that 100%
of the additional energy costs are passed along by the industry (CPA).
Sustainability 2009, 1
599
Required Energy Efficiency Gains. Calculations of the energy efficiency gains required to offset the
increased energy costs associated with the climate policy case relative to BAU.
Allowance Allocation. Simulations of the impact of an allowance allocations equal to 90 percent
(diminishing by 2 percent per year) of the increased prices for energy consumed by the industry
resulting from the CO2 price case.
5. Climate Policy Impacts on Petrochemical Manufacturing
Petrochemical manufacturing is one of the most energy-intensive industries in the U.S. economy,
yet, according to the II-CPM simulations, the Mid-CO2 Price Policy would have very modest impacts
on the industry’s costs, operating surplus (profits), and operating margins (profit margins). These
results reflect assumptions and contingencies, such as market price projections, energy mix data and
energy price variations, and credit allocation for feedback energy use.
In any event, the U.S. petrochemical industry has long been concerned with energy costs, since its
primary feedstock is derived from hydrocarbon fuels (petroleum, natural gas). Although in recent years
the industry has been financially strong–at least until the current economic crisis–rising energy costs
(in particular, natural gas) have prompted some large manufacturers to explore making investments in
offshore facilities closer to cheaper and abundant energy supplies, rather than expanding their domestic
capacity. Hence, even an incremental increase in energy costs arising from a climate policy, which
would apply only the United States, could influence domestic producers’ future location and
investment decisions.
5.1. Production Cost Structure (BAU—Business As Usual)
In 2006, material costs accounted for two-thirds of total costs, energy costs for 30 percent, and labor
for only 3 percent. Energy feedstock accounts for the bulk of energy costs, fuel energy accounts for
just a fraction, and electricity costs are all but negligible.
Energy feedstock accounts for the largest share of the industry’s energy costs. As a share of total
production costs, total energy costs were about 30 percent in 2006. They were projected to fluctuate
around one-quarter of the total, most years thereafter, in the BAU scenario. Total energy costs are also
substantially larger than labor costs; they were about 2-3 times the latter from 1992 through 1999.
They would steadily climb to 17 times greater the labor costs by 2030. Energy costs were estimated to
grow from only about 30 percent to a third of materials costs in 2030. In contrast, the energy-labor
ratio in policy case would rise to over 19 times, and energy-materials to 35 percent, by 2030.
5.2. Energy and Production Cost Impacts
Table 3 summarizes the production cost impacts projected by the II-CPM simulations for the
petrochemical industry, assuming no mitigating actions to reduce energy costs and the implementation
of climate policies only in the U.S. The table shows the small cost increases above the BAU, which
would rise to only 1 percent in 2020 and 1.7 percent in 2030. Yet, the energy cost share of total
production costs for the industry, was 30 percent in 2006. But by 2020, it would fall to under a quarter
Sustainability 2009, 1
600
of the total, only about 1 percent greater than the BAU share, where it would remain through 2030.
This share would change very little under the policy case.
Feedstock accounts for the largest share of energy inputs–about 80 percent of total energy costs
in 2006, compared to 18 percent for energy fuels and 3 percent for electricity (see Table 3).
Under the Mid-CO2 Price Policy, overall energy costs would increase by a little over 4 percent
in 2020, relative to BAU, and by 7 percent in 2030. The feedstock role in the energy cost increase
under the climate policy would actually shrink over time, to 75 percent of total energy costs, in 2030,
only 1.2 percent over BAU. Fuel costs for heat and power would grow relatively and absolutely, under
the climate policy, to 33 percent higher than BAU and would be 21 percent of total costs in 2030.
Electricity would not grow relatively to other energy sources, but would be about 13 percent higher
than BAU, in 2030.
Table 3. Prduction costs, energy share and energy cost components for petrochemical
manufacturing.
Item
2006 2020
2030
Value Value % above BAU Value % above BAU
Production Costs (USD 2000/ton)
BAU
457
508
Mid-CO2 Price Case Above BAU –
5
Energy Share of Production Costs (Percent)
Mid-CO2 Price Case
29.6
23.2
Energy Cost Components (USD 2000/ton)
Mid-CO2 Price Case:
Total Energy Costs
135
119
Fuel Costs
24
23
Electricity Costs
4
4
Feedstock Costs
107
92
–
1.0
506
9
–
1.7
0.8
25.3
1.3
4.4
19.0
8.6
1.2
130
28
4
98
7.1
33.1
13.1
1.2
These results reflect assumptions about the energy source used as feedstock in petrochemical
manufacturing, based on the DOE’s Manufacturing Energy Consumption Survey (MECS) data, which
assumes that all but a small amount of energy fuel used as feedstock is liquid petroleum gas (LPG) or
natural liquid gas (NLG). The study therefore assumed that all the energy feedstock was LPG using
EIA price projections to characterize the climate policy impacts. A source at the American Chemistry
Council (ACC) suggested to us, however, that much if not most of the fuel used as feedstock may in
fact be NGL rather than LPG—especially ethane and propane–basic building blocks of ethylene and
other bulk petrochemical production in the pyrolysis process. We subsequently did a rough estimate of
what the cost impacts might be if it was assumed that a portion or all the feedstock energy consumed
as feedstock was in fact NGL. In particular, estimates of the impacts were done assuming that 10
percent, 50 percent and 100 percent of the feedstock was actually NGL, rather than LPG. The results
of this estimate showed that the changes in feedstock costs would result in increases in overall
production costs relative to BAU, but in cost declines in absolute terms, ranging from as low as
Sustainability 2009, 1
601
1.2 percent above BAU to a high of 3.2 percent in 2020, and a low of 2 percent to a high of 5.5 percent
in 2030. In short, if in fact U.S. petrochemical feedstock is in part, mostly or totally comprised of NGL
rather than LPG, the results would range from small to modestly higher cost increases compared to the
II-CPM results.
5.3. Operating Surplus and Margins (NCPA—No Cost Pass-Along)
Assuming NCPA seems reasonable for this sector due to its very large operating surplus and
margins probably caused by the high capital-intensiveness of petrochemicals. Not surprisingly, low
production costs under the climate policy would produce a small dent in industry’s operating surplus,
relative to BAU: there would be only a 1.2 percent reduction in the operating surplus relative to BAU
in 2020, and a slightly higher, 2.2 percent, reduction in 2030.
The operating margin change under the policy case also suggests very small impacts on industry’s
bottom line in the II-CPM simulations, under the assumptions about fuels and prices used in the study.
The modeling results showed only a 0.5 percent reduction in the operating margin in 2020 and a
1 percent reduction in 2030. In short, we should expect, at most, only a very modest reduction of the
industry’s profits and profit margins by 2030 as a result of a climate policy, given the feedstock energy
source assumptions used in the original II-CPM simulations.
If, however, the industry actually consumed NGL as feedstock, instead of or addition to LPG,
which appears likely according to industry sources, the resultant operating surplus reductions would be
somewhat larger. A 10 percent NGL—90 percent LPG split would increase the operating surplus and
operating margin impacts only slightly, even for the more volatile NGL price estimates. If we assume
a 50-50 split, the operating surplus reduction could rise to 4 percent by 2030, and if a 100 percent NGL
feedstock is assumed in lieu of LPG, the operating surplus reduction could grow to over 5 percent
relative to BAU. Significantly, the operating margin reduction could range from nearly 2 in the
50 percent NGL case by 2030 and to 3 percent for the 100 percent NGL case, in 2030. Nevertheless, in
absolute terms, the operating surplus and operating margin would be higher when using NGL, due to
its lower price, compared to the II-CPM original simulations of the BAU and Mid-CO2 Price
Policy cases.
5.4. Operating Surplus and Market Shares (CPA—Cost Pass-Along)
Under favorable market conditions, low cost and high operating surplus/margin under the Mid-CO2
Price Policy, petrochemical companies might decide to pass along some or all of the additional costs
(CPA) from the climate policy to their customers. The operating surplus, operating margin (and
therefore profit margin), and market share reductions would be very small and unlikely to threaten the
industry’s competitive position. Even if the NGL-LPG scenarios represent more realistic situations in
the industry, the operating surplus impacts, relative to BAU would still be relatively modest and CPA
may remain an option for petrochemical companies, depending on market conditions at the time. In
any case, whatever the impacts, under Mid-CO2 Price Policy (the core Lieberman-Warner proposal) it
is likely that a credit would be given to the petrochemical industry for feedstock energy use, which
would mitigate the economic impacts of the climate policy on the sector.
Sustainability 2009, 1
602
The extent to which the industry can pass along the added costs of feedstock and energy fuels under
a climate policy would depend on the strength of domestic and international demand, the intensity of
international competition, the extent of production oversupply, and the availability and price volatility
of the primary feedstock. The petrochemical manufacturing is a global industry, which is especially
sensitive to the availability and costs of raw materials, primarily hydrocarbons mostly sold on world
markets. The prices of petrochemical products are strongly correlated—some say as much as
80 percent—with the cost of crude oil. As a consequence, the industry is subject to a great deal of price
volatility, tied to the price fluctuations of petroleum and natural gas.
6. Technology and Policy Options—Petrochemicals
Given the relatively low economic impacts from the Mid-CO2 Price Policy on the petrochemical
industry projected by the II-CPM, even with different assumptions regarding feedstock use (i.e., NGL
versus LPG), the energy-efficiency requirements to offset these cost impacts would be modest–only
about 1 percent through 2030. Although, it remains in the industry’s interest to continue investigating
new energy-saving technology improvements, from short-term incremental improvements to longerterm advanced or alternative process technologies.
6.1. Technology Options
According to the ACC, the chemicals industry has made substantial improvements in energyefficiency over the past thirty years. One index indicates that the industry’s energy intensity has
declined by about 60 percent between 1974 and 2006, and a reduction in GHG intensity of about
40 percent in the same period. Further incremental improvements may be possible—and perhaps might
be sufficient to offset the climate policy cost impacts, as long as they are as small as indicated in the
II-CPM simulation results. Larger scale energy-efficiency improvements might require substantial
investments over a longer time period, in more advanced process technology improvements, and
perhaps prevalent in the substitution of existing petrochemical production processes with
low-carbon alternatives.
Some technologies that could be explored are Combined heat and power generation (CHP)—the
simultaneous generation of electricity and heat from a facility that is located very close to the
manufacturing facility—and the substitution of fossil-fuel feedstock by biomass.
6.2. Policy Options to Mitigate Impacts
The implementation of a 90 percent allocation allowance to offset energy price increases under the
climate policy would greatly alleviate any economic impacts of a climate policy on the petrochemical
industry. But with such low impacts projected by the II-CPM, it is not clear whether such an allocation
should be applied in this case. On the other hand, more research is needed to determine the actual mix
of feedstock energy sources used by the industry and the past and expected in the future, and make
new assessment of the cost impacts resulting from the climate policy. In any case, whether LPG or
NGL are used as feedstock, the carbon content would be sequestered in petrochemicals products,
Sustainability 2009, 1
603
rather than emitted as CO2, which under the Mid-Price Policy (Lieberman-Warner) would be
compensated with a credit to the industry, to offset the cost impacts.
7. Climate Policy Impacts on Chlor-Alkali Manufacturing
In contrast to petrochemical manufacturing, the chlor-alkali manufacturing industry is among the
most susceptible industries to the impacts of climate policy on its profits and competitiveness.
According to the II-CPM results, chlor-alkali would experience the second largest cost increase and
third largest operating surplus reduction relative to BAU, under the Mid-CO2 Price Policy. This
industry’s manufacturing processes are heavily reliant on both electricity and fuels for heat and power.
At the same time, it is the least sensitive to foreign imports–and the only industry with a consistent
trade surplus—and therefore possibly more able to pass the policy-driven costs along in efforts to
maintain its profitability.
On the other hand, basic chemicals, such as chlorine and caustic soda, produced in this industry are
often upstream raw materials used in the production of downstream chemical products by the same
company and at the same facilities. Manufacturers therefore would have to weigh whether it is more
cost-effective to continue internal production of an increasingly expensive feedstock, or look
elsewhere (i.e., offshore) for less expensive sources—or, alternatively, consider investment in newer,
more energy-efficient chlor-alkali production technologies (e.g., the membrane cell).
7.1. Production Cost Structure (BAU)
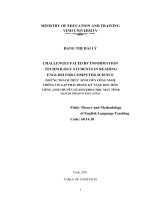
Figure 1 presents the historical trends and projections for the production cost components for the
chlor-alkali manufacturing processes in the BAU case. It also shows the additional energy costs that
the industry would have to bear if the Mid-CO2 Price Policy were enacted. As with the other industries,
materials costs constitute the largest share of total production costs–fluctuating around 40–45 percent
for the historical period and in the projections through 2030. But the share of energy costs, and to a
less extent of labor costs, also are sizable. The former have fluctuated around 40 percent historically,
but were projected to fall to a little over a third of total costs. The jump in labor costs in 2005
paralleled the rise in materials costs, and a comparable growth in energy costs, all of which were then
projected to remain somewhat higher than their values in prior years. Labor costs have historically
been around one-fifth of total costs, and were projected to remain at that level through 2030, for BAU.
The costs of energy for the BAU case are estimated to be in the range of double the costs of labor
through 2030, and nearly 2.5 times greater under the Mid-CO2 Price Policy. For the BAU case, energy
costs ranged from 80 percent to roughly equal materials costs from 1992 through 1999, and then
fluctuated between 100–150 percent through 2008. They then were projected to fall to, and stay at,
roughly three-quarters materials costs through 2030 for the BAU case. They would be a little higher
relative to materials costs under the climate policy, ranging between 80–100 percent between 2009
and 2030.
Sustainability 2009, 1
604
7.2. Energy and Production Cost Impacts
Energy cost increases under a climate policy would be fairly significant according to the II-CPM.
As Table 4 shows, total production costs would grow 5.5 percent by 2020 and nearly 10 percent by
2030, compared to BAU. The energy share of total production costs was 38 percent in 2006. It was
projected to remain roughly the same for BAU throughout the period when the Mid-CO2 Price Policy
would be in effect. However, the modeling results show that this share would grow nearly to
42 percent, 6 percent above BAU by 2030.
The role of the two main energy components responsible for this growth is externally purchased
fuel energy and electric power. Fuel costs would account for the larger portion of the rise in energy
costs and consequently the overall growth in production costs. They represent about 60 percent of total
energy costs and would increase by over a fifth by 2020 and over one-third by 2030, relative to BAU.
Natural gas is the primary fuel consumed in the industry, followed by coal and LPG. The large price
increases for the two former fuels under the climate policy are responsible for almost all the growth in
fuel costs for chlor-alkali relative to BAU. Electricity growth is much more modest, rising only by
13 percent above BAU by 2030. This reflects the relatively moderate price increases for that energy
source under the Mid-CO2 Price Policy.
Chlor-Alkali Real Unit Production Cost Components,
Figure 1. Chlor-Alkali real unit production cost components, business as usual, 1992–2030.
Business As Usua l, 1992-2030
120.0
Mid-CO2 Price Case Cost Increases
100.0
Electricity
USD 2000 per Metric Ton
80.0
Fuel
60.0
Labor
40.0
Materials
20.0
0.0
1992
1994
1996
1998
2000
2002
2004
2006
2008
2010
2012
2014
2016
2018
2020
2022
2024
2026
2028
2030
Source: HRS-MI
7.3. Operating Surplus and Margins (NCPA)
The chlor-alkali’s operating surplus, assuming NCPA, is quite large in the BAU case, but, it would
shrink by a sizable amount under the Mid-CO2 Price Policy. This is partly the result of projected
declining market price relative to the rapidly rising production cost curve under the climate policy.
Sustainability 2009, 1
605
The reduction in the industry’s operating surplus resulting from the Mid-CO2 Price Policy would be
substantial, 10 percent below BAU in 2020 and a shade under 20 percent in 2030. Operating margins
also would shrink, by 3.6 in 2020 and 6.6 percent in 2030. The growing scale of both the operating
surplus and operating margin reductions, over this period could begin to translate into a noticeable
diminishment in the industry’s profitability, leading chlor-alkali producers to seriously explore options
for containing their energy costs, contingent on its financial situation and market conditions.
Table 4. Production costs, energy share and energy cost components–chlor-alkali manufacturing.
Item
2006 2020
2030
Value Value % above BAU Value % above BAU
Production Costs (USD 2000/Mt)
BAU
104
102
Mid-CO2 Price Case Above BAU –
6
Energy Share of Production Costs (Percent)
Mid-CO2 Price Case
38.3
37.3
Energy Cost Components (USD 2000/Mt)
Mid-CO2 Price Case:
Total Energy Costs
40
40
Fuel Costs
26
25
Electricity Costs
14
15
–
5.5
104
10
–
9.9
3.5
41.6
5.8
16.3
21.3
8.6
47
32
16
27.8
36.6
13.1
Mt = Metric Ton [=1.102 Short Tons]
7.4. Operating Surplus and Market Shares (CPA)
Faced with diminishing profitability, the industry might also consider passing along the costs to
customers (CPA), to preserve its profit margins and minimize operating surplus reductions. But with
higher prices come lower market shares, as the lower cost of foreign imports replaces domestic
production and sales. Because the chlor-alkali industry currently enjoys a net trade surplus (exports
exceeds imports), the pressures of foreign competition may not be as great as for other industries, and
cost pass-along may be more of an option.
Under the cost basis CPA assumption, the industry would see a decline of less than 1 percent of its
domestic market share, which would still total around 90 percent, as a result a CPA choice under the
Mid-CO2 Price Policy. This is equivalent to a reduction in production of 270,000 metric tons of
chlor-alkali products, out of a total net domestic output of 34.6 million metric tons. The industry’s
operating surplus also would be diminished by less than 1 percent, which would translate into a
negligible impact on its profits.
Given the revenue reduction projected under a NCPA assumption, and the projected gains if costs
were passed along, manufacturers in the chlor-alkali industry may decide to pass along some or all
their additional costs, despite modest losses in market shares. Given the low import vulnerability of
this industry—up until now it has been a net exporter—cost pass-along may be a reasonable response
by chlor-alkali producers to offset and prevent future major economic harm. But market conditions
Sustainability 2009, 1
606
could greatly influence chlor-alkali companies’ decisions about passing along cost increases or
investment choices in response to them.
8. Technology and Policy Options—Chlor-Alkali
In the study, we reviewed some of the technology investment options and evaluated a public policy
option that could help the chlor-alkali industry mitigate the economic costs of a climate policy. We
first found that the industry would need to achieve fairly substantial energy-efficiency gains to offset
these costs.
At the same time, although there are incremental heat, power and process technologies and a major
process technology that the industry already is moving towards, which could greatly reduce the
industry’s energy costs, there remain barriers to their successful implementation. More research is
needed to evaluate these options, their potential for generating sufficient energy-savings, and the
timing, cost, and technical barriers to their successful implementation.
Finally, we found that a 90 percent allowance allocation policy would alleviate some of the shortto-mid-term cost pressures on U.S. chlor-alkali manufacturers, which could buy time, if not encourage
them to make the transition to new energy-saving technologies and advanced chlor-alkali
manufacturing processes.
8.1. Energy Efficiency Requirements
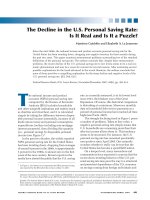
Figure 2 illustrates the energy efficiency gains that would be required in the chlor-alkali industry to
offset the production costs that would result from the Mid-CO2 Price Policy. The largest gains required
would be to offset fuel energy cost increases. These rise from a little over 10 percent in 2012,
immediately after the policy would go into effect, to about 19 percent in 2030. Electricity gains
required would be around 7 percent in 2020 and 10 percent in 2030. Because fuel costs are the primary
source of cost increases in the chlor-alkali industry, according to the II-CPM simulations, the primary
emphasis on energy-saving measures and technologies should be on making efficiency improvements
in the delivery and use of heat and power.
8.2. Technology Options
According to the International Energy Agency (IEA) [27], the best opportunity for reducing energy
use and costs of the chlor-alkali industry is to substitute membrane technologies for the mercury and
diaphragm production methods currently in place. Membranes are a chemical separation process that is
among the most energy-intensive operations in the chemical industry, which includes distillation and
extraction. They use up to 40 percent of all energy consumed in the chemical industry and can account
for more than 50 percent of plant operating costs. If the current membranes cells are replaced by more
advanced cells using new state-of-the-art technology (i.e., the oxygen-consuming cathode), energy
savings of at least 30 percent could be realized.
Sustainability 2009, 1
607
Figure 2. Chlor-Alkali
gains required to
Chlor-Alkali industry–cumulative
Industry ?Cumulativeyearly
Yearly energy
Energyefficiency
Efficiency Gains
offset climate policy costs. Required to Offset Climate Policy Costs
18.5
2030
Fuel
14.2
2020
10.5
2012
2030
Electricity
9.8
2020
6.6
No Allocation
2012
7.7
2030
Fuel
6.6
2020
3.0
1.2
2012
3.3
2030
Electricity
1.3
2020
90% Allocation
0.8
2012
0.0
2.0
4.0
6.0
8.0
10.0
12.0
14.0
16.0
18.0
20.0
Percent
HRS-MI
However, because of the relatively low cost of electricity in past years and the high capital
investment required, U.S. firms have been resistant to invest in the new energy-efficient chlor-alkali
process, unless there is a short-term boost to their competitiveness. At the same time, investments in
the new technology have already been made in Europe and Japan, where energy prices are higher and
environmental regulations stricter than in the United States (FY 2004). U.S. electricity prices,
however, have risen over the past decade, which would be augmented by a climate policy. Coupled
with sufficient investment incentives, this may provide some encouragement for U.S. chemical
companies to make the transition to new cell technologies.
8.3. Policy Options to Mitigate Impacts
Figure 2 also illustrates the potential mitigating benefits of the 90 percent allocation measure on the
economic impacts of the Mid-CO2 Price Policy on the industry. The cumulative energy efficiency
gains required for both fuel and electricity in the allocation case would be only about one-tenth than
that needed if there were no allocation, in 2012. By 2020, the requirements in the allocation case
would be one-fifth that of the no allocation case, and by 2030, the requirement would fall to one-third
the allocation case. The diminishing mitigating effects over time reflect the 2 percent annual reduction
in the allocation offset.
Similarly, results show the substantially lower cost increase and operating surplus reduction that
would result from implementing the allocation measure. The chlor-alkali industry would realize a
74 percent gain in 2020 and a 54 percent gain in 2030. By 2020, real unit production costs would fall
Sustainability 2009, 1
608
from 5.5 percent to 1.5 percent, above BAU, and operating surplus would diminish from 10 percent to
about 3 percent, below BAU. By 2030, production costs would shrink from 10 percent to 4.6 percent
above BAU, and operating surpluses would decline from nearly 20 percent to 9 percent, below BAU.
9. Conclusions
The II-CPM simulations results show that enactment of a mid-price climate policy would have
widely different impacts on the petrochemicals and chlor-alkali industries. Although both industries
are highly energy-intensive—the former heavily dependent on hydrocarbon-based feedstock, the latter
on natural gas and electricity—the different energy mixes and the projected price variations for their
primary energy sources under the climate policy result in, on the one hand, relatively small impacts on
the petrochemical industry, yet large and potentially troubling impacts on the chlor-alkali industry, on
the other.
Under the assumptions regarding the nature of the energy mix and prices used in the II-CPM
simulations and with no mitigating action being implemented to reduce the impact of a climate policy,
the petrochemical industry would experience very modest increases its production costs, which would
translate into only small reduction in its operating surpluses, operating margins, and ultimately its
profits. In contrast, the chlor-alkali industry would experience large impacts.
At the same time, because both industries are relatively less sensitive to import substitution, under
favorable market conditions, when demand is robust and prices for their goods are rising domestically
and internationally, they may more easily be able to pass-through their costs to users of their products.
However, both industries are more vertically integrated with producers of derivative and downstream
products that rely on the processing and incorporation of their products (e.g., PVCs), than other sectors
analyzed in this study. The downstream producers tend to be more price sensitive and perhaps less able
to pass-through new costs in the global markets they operate within, than their basic materials
suppliers. Therefore, to fully understand the implications of climate policy-driven energy cost
increases, it might be necessary to examine the ripple effect of petrochemical and chlor-alkali cost
increases, if they are passed through, on the profitability and competitiveness of their major
downstream customers.
Both industries are also very sensitive to the volatility of energy prices, in particular, natural gas,
which under conditions of weakened demand and falling product prices, have led some chemicals
firms—especially in petrochemicals—to consider building new capacity in, or sometimes shifting their
operations to, foreign locations with abundant and cheap energy supplies, rather than upgrading or
expanding their domestic facilities. Cost pass-along in these situations is less feasible, and even
incremental impacts on production costs and profits from a climate policy could influence firms’
location and investment decisions, in efforts to maintain their margins.
Our examination of technology and policy options found that corresponding to the II-CPM cost,
operating surplus, and profit margin findings, the petrochemical industry would require small energyefficiency gains to offset rising climate policy-driven energy costs. The required gains for the chloralkali industry, in any case, were estimated to be quite large, consistent with the substantial cost and
profit impacts projected by the II-CPM.
Sustainability 2009, 1
609
Both shorter and longer-run energy-saving technology options are available to the industries—and
being researched by them—but the usual financial, technical, and timing issues need to be addressed to
determine the economic feasibility of implementing these options, under the additional energy cost
pressures from a climate policy. Both industries could benefit from incremental improvements from
continued application of CHP, heat recovery, advanced sensors and process controls, and similar
energy-saving applications. These in principle could help offset the relatively projected modest cost
impacts in the petrochemical industry, and could help over the short-run if they were implemented in
the chlor-alkali industry.
However, the larger longer-term technology improvements–membrane cells in chlor-alkali, more
advanced cracking furnaces, biomass feedstock in petrochemical manufacturing–needed to offset the
industries’ more substantial profit reductions in later years, would require more research, development
and demonstration of their technical and commercial feasibility, before companies would be willing to
make the substantial investments required to replace their older, existing production facilities. At the
same time, because the domestic chlor-alkali industry reportedly is characterized by aging, and in
some cases very old, plants, the industry may be more ready to replace some or most existing capacity
with modernized, advanced membrane cells over the next decade or so, though other enabling policies
may also be needed.
Finally, the enactment of the 90 percent allowance allocation measure would greatly mitigate the
cost impacts of the Mid-CO2 Price Policy for both industries, though the issue is disputable if the
industry were to receive a credit for the carbon ―sequestered‖ in its products. The allocation policy also
would be important to mitigate short-to-medium term impacts on the chlor-alkali industry. In any
event, we believe that other, supplemental policies might be needed to encourage chemicals
manufacturers to adopt both incremental and advanced low-carbon and low-emissions process
technologies over the next 10-15 years, to help them cope with increasing energy prices.
References
1.
2.
3.
4.
5.
6.
7.
Paltsev, S.; Reilly, J.M.; Jacoby, H.D.; Gurgel, A.C.; Metcalf, G.E.; Sokolov, A.P.; Holak, J.F.
Assessment of U.S. Cap-and-Trade Proposals; MIT Joint Program on the Science and Policy of
Global Change: Boston, MA, USA, 2007; Report 146.
U.S. Department of Energy. Energy Market and Economic Impacts of S. 2191, the LiebermanWarner Climate Security Act of 2007; Energy Information Administration: Washington, DC,
USA, 2008.
U.S. Department of Energy. Energy Market and Economic Impacts of S. 1766, the Low Carbon
Economy Act of 2007; Energy Information Administration: Washington, DC, USA, 2007.
U.S. Department of Energy. Energy Market Impacts of Alternative Greenhouse Gas Intensity
Reduction Goals; Energy Information Administration: Washington, DC, USA, 2006.
Morgenstern, R.D.; Ho, M.; Shih, J.-S.; Zhang, X. The near-term impacts of carbon mitigation
policies on manufacturing industries. Energ. Policy 2004, 32, 1825-1841.
U.S. Congress. America's Climate Security Act of 2007; Washington, DC, USA, 2007.
American Chemistry Council (ACC). 2007 Guide to the Business of Chemistry; Washington, DC,
USA, 2007.
Sustainability 2009, 1
8.
9.
10.
11.
12.
13.
14.
15.
16.
17.
18.
19.
20.
21.
22.
23.
24.
25.
26.
610
Chlistunoff, J. FY 2004 Materials, Glass, and Sensors Project and Portfolio Review, Advanced
Chlor-Alkali Technology Project; Project Summary Form (CPS1797), Los Alamos National
Laboratory: Los Alamos, NM, USA, 2005.
U.S. Census Bureau. 2005 Statistics of U.S. Businesses (SUSB); Company Statistics Division:
Washington, DC, USA, 2005.
U.S. Census Bureau. Annual Survey of Manufactures: Statistics for Industry Groups and
Industries: 2006; ASM Industry Groupings: Washington, DC, USA, 2006.
Worrell, E.; Phylipsen, D.; Einstein, D.; Martin, N. Energy Use and Energy Intensity of the U.S.
Chemical Industry; Environmental Energy Technologies Division, Ernest Orlando Lawrence
Berkeley National Laboratory: Berkeley, CA, USA, 2000.
Hauser, T.; Bradley, R.; Childs, B.; Werksman, J.; Heilmayr, R. Leveling the Carbon Playing
Field: International Competition and US Climate Policy Design; Peterson Institute for
International Economics: Washington, DC, USA, 2008.
McKinsey Global Institute. Curbing Global Energy Demand Growth: The Energy Productivity
Opportunity; McKinsey&Company: San Francisco, CA, USA, 2007.
Davidsdottir, B.; Ruth, M. Pulp non-fiction: dynamic modeling of industrial systems. J. Ind. Ecol.
2005, 9, 191-211.
Morgenstern, R.D.; Aldy, J.E.; Herrnstadt, E.M.; Ho, M.; Pizer, W.A. Competitiveness Impacts on
Carbon Dioxide Pricing Policies on Manufacturing; Resources for the Future: Washington, DC,
USA, 2007.
Reinaud, J. Industrial Competitiveness under the European Union Emissions Trade Scheme;
International Energy Agency: Paris, France, 2005.
Ruth, M.; Amato, A.; Davidsdottir, B. Impacts of market-based climate change policy on the US
iron and steel industry. Energ. Source. 2000, 22, 269-280.
Ruth, M.; Amato, A.; Davidsdottir, B. Carbon emissions from US ethylene production under
climate change policies. Environ. Sci. Technol. 2002, 36, 119-124.
Ruth, M.; Amato, A.; Davidsdottir, B. Climate change policies and capital vintage effects: the
cases of US pulp and paper, iron and steel and ethylene. J. Environ. Manage. 2004, 7, 221-233.
Ruth, M.; Davidsdottir, B.; Laitner, S. Impacts of energy and carbon taxes on the US pulp and
paper industry. Energ. Policy 2000, 28, 259-270.
McKinsey & Company and Ecofys. EU ETS Review, Report on International Competitiveness;
European Commission, Directorate for Environment: Brussels, Belgium, 2006.
Sterman, J.D. Business Dynamics: Systems Thinking and Modeling for a Complex World;
Irwin/McGraw-Hill: Boston, MA, USA, 2000.
Sterman, J.D. A skeptic’s guide to computer models. In Managing a Nation: The Microcomputer
Software Catalog; Barney, G.O., Ed.; Westview Press: Boulder, CO, USA, 1988; pp. 209-229.
U.S. Department of Energy. DOE/ITP Industrial Technologies Program; Office of Energy
Efficiency and Renewable Energy: Washington, DC, USA, 2005.
U.S. Department of Energy. Manufacturing Energy Consumption Survey; Energy Information
Administration: Washington, DC, USA, 2002.
Global Insight. Producer Price Index (PPI), Iron and Steel, updated 06 September 2008.
Sustainability 2009, 1
611
27. International Energy Agency (IEA). Energy Technology Perspectives 2006, Scenarios &
Strategies to 2050; IEA: Paris, France, 2006.
© 2009 by the authors; licensee Molecular Diversity Preservation International, Basel, Switzerland.
This article is an open-access article distributed under the terms and conditions of the Creative
Commons Attribution license ( />