Stagflation in the u s
Bạn đang xem bản rút gọn của tài liệu. Xem và tải ngay bản đầy đủ của tài liệu tại đây (504.69 KB, 33 trang )
STAGFLATION IN U.S.
INTRODUCTION
An article from “The New York Times” published on Febuary 13 th, 2011
mentioned that:
“In the USA, CONGRESS has made a terrible mistake. Amid a
rhetorical debate centered on words like “crisis,” “emergency” and
“catastrophe,” it acted too fast. While arguments were made about the
stimulus bill’s specific components — taxpayer money for condoms,
new green cars and golf carts for federal bureaucrats, another round of
rebate checks — its more dangerous consequences were overlooked.
And now the package threatens a return to the kind of stagflation last
seen in the 1970s.
From a global perspective, the picture only looks worse. As we have
debated how much money to borrow and spend in hopes of jumpstarting our economy, we’ve ignored the worldwide stimulus binge.
China, Europe and Japan are all spending hundreds of billions of dollars
they don’t have in hopes of speeding up their economies, too. That
means the very countries we have relied on to buy our bonds, notably
China and Japan, are now putting their own bonds on the global credit
markets.
It seems that no one in Washington is discussing what happens when the
world begins this gargantuan borrowing spree. How high will interest
rates rise? And more fundamentally, who will have the money to buy
our bonds? It is possible that the Federal Reserve will succumb to
pressure to “monetize” our debt — that is, print new money to buy our
bonds. In fact, the Fed is already suggesting that it will buy long-term
[Type text]
Page 1
STAGFLATION IN U.S.
Treasury securities in order to lower borrowing costs. If it does, then our
money supply, which has already increased substantially over the past
year, will grow even faster.
To American families, inflation is a destroyer of savings, a killer of
wealth, a crusher of confidence. It calls into question the value of our
money. And while we all share in the pain, the people whom inflation
hits hardest are elderly people who live on fixed incomes, those in the
middle class who are struggling to save for retirement and college and
lower-income people who live paycheck to paycheck.
Combine high inflation and high unemployment and you have
stagflation. Hindsight shows how the pain of the late 1970s and early
1980s could have been avoided, yet we’re now again planning to borrow
and spend — and raise taxes — as President Jimmy Carter did. Soon we
may again find ourselves watching a rising “misery index” of inflation
and unemployment together. If that happens, individual earning power
will evaporate, and our standard of living will decline….”
Obviously, we are entering an era of high inflation, to judge by the
massive growth of the money supply in the United States, Europe and
Asia, and the stubbornness of central bankers who insist that high
unemployment demands the creation of even more money. The last time
the world went through a similar period was the 1970s. The term that
defined the era was "stagflation."
Thus because the 1970s stagflation did do great harm to the U.S.
economy and global economy as a whole, followed by a period of
recesssion and there are evidences that we are on our way to the replay
of stagflation nowadays, a thorough understanding of stagflation is
crucially important for individuals as well as policy-makers to make
reasonable decisions.
The urgency of this trend has led us to choose “Stagflation in the U.S.”
as the topic of our assignment. In this study, we will give a clear
[Type text]
Page 2
STAGFLATION IN U.S.
definiton of stagflation. Besides, a deep analyse is made on the factual
situation of the 1970s Great Stagflation and more recently, especially the
main causes that leads to stagflation in the period. Lastly, we will come
up with some recommendations for individual decisions and
implementation of government’s policies.
We hope that through the arguments and data in our paper, you could
gain comprehensive understanding, including basic and in-depth
knowledge, about the issue and be more confident, more active when
making decisions in today economic situation.
[Type text]
Page 3
STAGFLATION IN U.S.
CONTENTS
I.
Definition
II.
Facts
1. Facts of stagflation in the 1970s
2. Fears of stagflation return
III.
Causes
1. General causes
2. Causes of stagflation in the 1970s
3. Explanation for risks of stagflation return
IV. Recommendations
1. Increasing aggregate supply
2. Long-term stock pick
3. Commodity investment
4. International system of buffer stocks
[Type text]
Page 4
STAGFLATION IN U.S.
I.
DEFINITION
The generally agreed-upon stagflation definition is a state of the
economy that exhibits elevated unemployment rates and inflation at the
same time. Typically, stagflation presents serious problems for monetary
policymakers, since the remedies for high unemployment are nearly
directly opposed to the remedies available for inflationary cycles. Most
economists believe stagflation can be attributed to either failed economic
policies or to destructive or catastrophic events that seriously affect the
production capability of the overall economy. During the 1970s, for
instance, the United States experienced a prolonged period of stagflation
due primarily to shortages of raw materials. Livestock feed
manufacturing was significantly impacted by the loss of the Peruvian
anchovy fishery in 1972, but the most significant economic factor was
likely the oil crisis of 1973, when OPEC severely limited the
international oil supply in order to control prices and boost profits for
their members.
Regardless of its origins, stagflation is likely to cause significant and
prolonged economic problems that cannot be easily resolved. High
unemployment reduces the overall buying power of consumers and
companies, and increasing prices lessen that buying power even more.
This can put a financial squeeze on both the consumer and the corporate
sector and cause still more unemployment as companies try to
[Type text]
Page 5
STAGFLATION IN U.S.
compensate for lower profits, increasing expenses and the resulting
reduction in financial liquidity.
II.
1.
FACTS
STAGFLATION IN THE 1970s
People often refer to the 1970s stagflation as ‘the bad
old days’. When they think of the U.S. economy in
that time the following comes to mind first:
o Recession
o Inflation
o Unemployment
o High oil prices
In the following parts, we will look more closely into some economic
indicators, including Economic Growth Rate, Inflation Rate and
Unemployment Rate, in order to identify Stagflation in this period of US
history.
a. Historical Economic Growth
The 1970s were perhaps the worst decade of most industrialized
countries', including the U.S.’s economic performance since the Great
Depression. Although there was no severe economic depression as
witnessed in the 1930s, economic growth rates were considerably lower
than postwar decades between 1945 and 1973. U.S. manufacturing
industries began to decline as a result, with the US running its last trade
surplus (as of 2009) in 1975.
[Type text]
Page 6
STAGFLATION IN U.S.
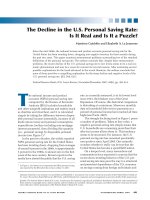
In this paper, Economic growth is measured by Gross Domestic Product
(GDP) in current dollars (i.e. Nominal GDP) and in year 2005 dollars
(i.e. Real GDP). As can be seen from the table and graph, in the 1970s
and 1980s, US economy experienced several periods of contraction:
1974 GDP contracted 0.55%, 1975: 0.21%, 1980: 0.28% and 1982:
1.94%. For the other years, real growth rate remained relatively small
(less than 6%), with an exception of 1984 with a rate of 7.19%,
indicating a period of slow growth and economic contraction.
Year
1960
1961
1962
1963
1964
1965
1966
1967
1968
1969
1970
1971
1972
1973
Annual Current-Dollar and "Real" Gross Domestic Product
1960-2000
GDP
GDP
GDP in
GDP in
GDP in
GDP in
billions
Real
billions
Real
billions
billions
of
Growth Year
of
Growth
of
of
chained
rate
chained
rate
current
current
2005
%
2005
%
dollars
dollars
dollars
dollars
526.4
2,828.5
1975 1,637.7 4,875.4 -0.21%
544.8
2,894.4 2.33% 1976 1,824.6 5,136.9 5.36%
585.7
3,069.8 6.06% 1977 2,030.1 5,373.1 4.60%
617.8
3,204.0 4.37% 1978 2,293.8 5,672.8 5.58%
663.6
3,389.4 5.79% 1979 2,562.2 5,850.1 3.13%
719.1
3,607.0 6.42% 1980 2,788.1 5,834.0 -0.28%
787.7
3,842.1 6.52% 1981 3,126.8 5,982.1 2.54%
832.4
3,939.2 2.53% 1982 3,253.2 5,865.9 -1.94%
909.8
4,129.9 4.84% 1983 3,534.6 6,130.9 4.52%
984.4
4,258.2 3.11% 1984 3,930.9 6,571.5 7.19%
1,038.3 4,266.3 0.19% 1985 4,217.5 6,843.4 4.14%
1,126.8 4,409.5 3.36% 1986 4,460.1 7,080.5 3.46%
1,237.9 4,643.8 5.31% 1987 4,736.4 7,307.0 3.20%
1,382.3 4,912.8 5.79% 1988 5,100.4 7,607.4 4.11%
[Type text]
Page 7
STAGFLATION IN U.S.
1974
1,499.5 4,885.7
-0.55% 1989
1990
5,482.1
5,800.5
7,879.2
8,027.1
3.57%
1.88%
Table 1: U.S. Annual Current-Dollar and "Real" Gross Domestic
Product (1960-2000)
Source: />
Figure 1: U.S. Annual Current-Dollar and "Real" Gross Domestic
Product (1960-2000)
b. Historical Inflation Rates
Table 2 shows Inflation Rate data for the USA during the time 19592000, including monthly and annual rates. Year over Year compares the
growth rate of the Consumer Price Index (CPI-U) from one period to the
same period a year earlier.
[Type text]
Page 8
STAGFLATION IN U.S.
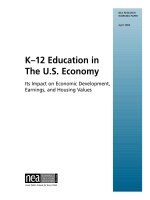
The oil shocks of 1973 and 1979 added to the existing ailments and
conjured high inflation throughout much of the world for the rest of the
decade. Before the year 1970, annual inflation rates mainly stayed below
3%. However, at the start of the new decade, the figure had more than
doubled itself 10 years earlier, then slowing down at around 4% in the
following 2 years. In 1974, there was a sharp rise in US inflation rate
when it reached its highest of 11.04% in the last 15-year period. The
buying power of money decreased remarkably and consumers were not
willing to buy anymore. From 1975 to 1978, the rate went between
relatively high levels of 7.6% and 9.1%, before reaching a double-digit
figure again in 1979, breaking the 1974 record and soar to a new peak of
13.5% in 1980. In late 1980s, the situation became stable with the rate
being kept under 5%.
Mar
Apr
May
Jun
Jul
Aug
Sep
Oct
Nov
1.2945% 1.6181% 1.6181% 1.9355% 1.6077% 1.9355% 1.6077% 1.9293% 1.6026
2.5559% 2.8662% 2.8662% 2.5316% 2.8481% 3.4810% 3.4810% 3.7855% 3.7855
2.8037% 2.4768% 2.7864% 2.7778% 2.7692% 2.4465% 2.7523% 2.4316% 2.7356
3.9394% 3.9275% 3.9157% 4.2042% 4.4910% 4.4776% 4.4643% 4.7478% 4.7337
5.2478% 5.5233% 5.5072% 5.4755% 5.4441% 5.7143% 5.6980% 5.6657% 5.9322
5.8172% 6.0606% 6.0440% 6.0109% 5.9783% 5.4054% 5.6604% 5.6300% 5.6000
4.7120% 4.1558% 4.4041% 4.6392% 4.3590% 4.6154% 4.0816% 3.8071% 3.2828
3.5000% 3.4913% 3.2258% 2.7094% 2.9484% 2.9412% 3.1863% 3.4230% 3.6675
4.5894% 5.0602% 5.5288% 5.9952% 5.7279% 7.3810% 7.3634% 7.8014% 8.2547
[Type text]
Page 9
STAGFLATION IN U.S.
% 10.3926% 10.0917% 10.7062% 10.8597% 11.5124% 10.8647% 11.9469% 12.0614% 12.200
% 10.2510% 10.2083% 9.4650% 9.3878% 9.7166% 8.6000% 7.9051% 7.4364% 7.3786
6.0721% 6.0491% 6.2030% 5.9701% 5.3506% 5.7090% 5.4945% 5.4645% 4.8825
6.4401% 6.9519% 6.7257% 6.8662% 6.8301% 6.6202% 6.5972% 6.3903% 6.7241
6.5546% 6.5000% 6.9652% 7.4135% 7.7049% 7.8431% 8.3062% 8.9286% 8.8853
10.0946% 10.4851% 10.8527% 10.8896% 11.2633% 11.8182% 12.1805% 12.0715% 12.611
% 14.7564% 14.7309% 14.4056% 14.3845% 13.1327% 12.8726% 12.6005% 12.7660% 12.648
% 10.4869% 10.0000% 9.7800% 9.5526% 10.7618% 10.8043% 10.9524% 10.1415% 9.5906
6.7797% 6.5095% 6.6815% 7.0640% 6.4410% 5.8505% 5.0429% 5.1392% 4.5891
3.5979% 3.8988% 3.5491% 2.5773% 2.4615% 2.5589% 2.8601% 2.8513% 3.2653
4.8008% 4.5639% 4.2339% 4.2211% 4.2042% 4.2914% 4.2701% 4.2574% 4.0514
3.7037% 3.6857% 3.7718% 3.7608% 3.5543% 3.3493% 3.1429% 3.2289% 3.5138
Table 2: U.S. Annual and Monthly Inflation Rates (1965-1985)
Source:
/>
[Type text]
Page 10
STAGFLATION IN U.S.
Figure 2: U.S. Annual Inflation Rate (1959-2000 Year-over-Year)
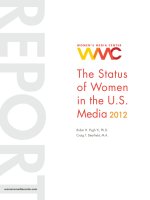
c. Unemployment Rate
Here's a look at the U.S. unemployment rate for people aging 16 and
over for selected years from 1960 to 2000.
Throughout the 1970s and 1980s, unemployment rate was quite high in
comparison with the percentage of 3.5% of 1969, which created a
significant social burden for the economy. This might be the result of
production contraction or reflected a level of minimum wage lower than
expected. The rate fluctuated continuously during the period, creating
ups and downs, however, was above 5% for most of the time. It kept
hitting new records: 8.5% in 1975, 9.7% in 1982 and 9.6% in 1983.
[Type text]
Page 11
STAGFLATION IN U.S.
Year
1960
1961
1962
1963
1964
1965
1966
1967
1968
1969
1970
1971
Unemployment Rate (%)
1960-2000
Rate
Year
Rate
Year
5.5
1972
5.6
1984
6.7
1973
4.9
1985
5.6
1974
5.6
1986
5.6
1975
8.5
1987
5.2
1976
7.7
1988
4.5
1977
7.1
1989
3.8
1978
6.1
1990
3.8
1979
5.9
1991
3.6
1980
7.2
1992
3.5
1981
7.6
1993
5.0
1982
9.7
1994
6.0
1983
9.6
1995
Rate
7.5
7.2
7.0
6.2
5.5
5.3
5.6
6.9
7.5
6.9
6.1
5.6
Table 3: U.S. Unemployment Rate (1960-1995)
Source: />
[Type text]
Page 12
STAGFLATION IN U.S.
Figure 3: U.S. Unemployment Rate (1960-2000)
As previously analyzed, we can see that the period of late 1970s and
early 1980s is a typical example of stagflation of the economy, which is
the combination of low growth rate, in other words the “stag”, together
with high inflation and unemployment rate, or the “flation” in the term.
By the time of 1980, when U.S. President Jimmy Carter was running
for re-election against Ronald Reagan, the misery index (the sum of the
unemployment rate and the inflation rate) had reached an all-time high
of 21.98%. The economic problems of the 1970s would result in a
sluggish cynicism replacing the optimistic attitudes of the 1950s and
1960s. Faith in government was at an all-time low in the aftermath of
Vietnam and Watergate, as exemplified by the low voter turnout in the
1976 United States presidential election.
[Type text]
Page 13
STAGFLATION IN U.S.
2. FEAR OF STAGFLATION RETURN
In the 1970s, stagflation shocked traditional Keynesian economists,
whose models said the economy could not suffer from both high
unemployment and rapid inflation at the same time. Unfortunately, the
Keynesians were wrong, because an economy obviously can experience
both evils simultaneously. The typical view is that an economy in a deep
recession is in no danger of price inflation. This belief is wrong both in
theory and in practice.
The worst bout of inflation during the postwar period occurred during
the economic slump of the late 1970s and early 1980s. More seriously,
there is a fear of stagflation return.
According to the The Wall Street Journal from February 2008, “The
U.S. is facing an unwelcome combination of looming recession and
persistent inflation that is reviving angst about stagflation, a condition
not seen since the 1970s”
At the beginning of 2008, inflation was rising. The Labor Department
said consumer prices in the U.S. jumped 0.4% in January and was up
4.3% over the past 12 months, near a 16-year high. Even stripping out
sharply rising food and energy costs, prices rose 0.3% in January, driven
by education, medical care, clothing and hotels. They was up by 2.5%
from the previous year, a 10-month high.
Some readers may remember the “misery index,” the sum of the
unemployment and inflation rates. The official unemployment rate in
2009 averaged 9.3 percent, for a total misery-index rating of 12.0. This
[Type text]
Page 14
STAGFLATION IN U.S.
is the highest misery rating in 26 years, going all the way back to 1983
when it was 13.4. Prices rose 2.7 percent during 2009, according to the
Bureau of Labor Statistics’ recent update of the Consumer Price Index
(CPI), signalling a return of “stagflation”, a merger of stagnation and
inflation.
More recently, in 2011, yet with prices on the rise and unemployment
still high, the U.S. economy again seems to be entering stagflation.
April's producer price index for finished goods, which excludes services
and falling home prices, rose 6.8%. The Bureau of Labor Statistics
reports that intermediate goods prices for April were rising at a 9.4%
annual clip. Meanwhile the official nationwide unemployment rate is
mired close to 9%, without counting a large backlog of discouraged
workers who are no longer officially in the labor force. So stagflation it
is.
The fact has shown that inflation for January showed an uptick that
could signal the return of stagflation (cost-push inflation during periods
of weak economic growth and slack demand). See the FRB of Cleveland
web site for a good discussion of measuring core inflation with an
explanation of the measures used in the graph below.
As can be seen from the graph, the misery index is simply the
unemployment rate added to the inflation rate. When either is high, there
is some level of distress in major sectors of the economy. Often,
however, when (demand-pull) inflation is up, unemployment is down.
[Type text]
Page 15
STAGFLATION IN U.S.
Figure 4: U.S. Inflation, year-over-year change, three measures
(1990 – 2011)
Figure 5: U.S. Unemployment Rate and Inflation (1960 – 2011)
[Type text]
Page 16
STAGFLATION IN U.S.
Although core measures of inflation (excluding food and energy) are
low, cost-push inflation is returning in the form of high commodity
prices, particularly energy. Transportation and food prices are the most
sensitive to energy prices. Energy prices are rising for two reasons. In
the short-run, energy demand is up following the world-wide recovery
from the recession. In the long-run, the rapid economic growth of China
and India along with the arrival of peak oil production, spell nothing but
higher energy costs. In other words, it is the return of stagflation.
Figure 6: Gasoline Price In 2011 Dollars
[Type text]
Page 17
STAGFLATION IN U.S.
Figure 7: Food-Price Index (1980 – 2010)
Since both Gasoline price and Food price are indexed to inflation, it is
necessary to compare the 1980 to 2010 period. While food prices are not
yet back to the all-time high of 1980 as energy prices almost are (with
the exception of the 2008 speculative bubble), just remember that it may
take a while for high energy prices to push up other prices.If peak oil
really has arrived, energy costs will act as a dead-weight drag on the
economy each time it recovers and demand returns.
III. CAUSES
1. GENERAL CAUSES
Economists offer two principal explanations for why stagflation occurs.
First, stagflation can result when the productive capacity of an economy
is reduced by an unfavorable supply shock, such as an increase in the
price of oil for an oil importing country. Such an unfavorable supply
shock tends to raise prices at the same time that it slows the economy by
making production more costly and less profitable.
[Type text]
Page 18
STAGFLATION IN U.S.
Second, both stagnation and inflation can result from inappropriate
macroeconomic policies. For example, central banks can cause inflation
by permitting excessive growth of the money supply, and the
government can cause stagnation by excessive regulation of goods
markets and labor markets, either of these factors can cause stagflation.
Excessive growth of the money supply taken to such an extreme that it
must be reversed abruptly can clearly be a cause. Both types of
explanations are offered in analyses of the global stagflation of the
1970s: it began with a huge rise in oil prices, but then continued as
central banks used excessively stimulative monetary policy to counteract
the resulting recession, causing a runaway wage-price spiral.
2.
CAUSES OF STAGFLATION IN THE 1970s
a. Relationship between inflation and unemployment
Until the 1970s, many economists believed that there was a stable
inverse relationship between inflation and unemployment. They believed
that inflation was tolerable because it meant the economy was growing
and unemployment would be low. Their general belief was that an
increase in the demand for goods would drive up prices, which in turn
would encourage firms to expand and hire additional employees.
This would then create additional demand throughout the economy.
According to this theory, if the economy slowed, unemployment would
rise, but inflation would fall. Therefore, to promote economic growth, a
country's central bank could increase the money supply to drive up
demand and prices without being terribly concerned about inflation.
According to this theory, the growth in money supply would increase
employment and promote economic growth. These beliefs were based
on the Keynesian school of economic thought, named after twentiethcentury
British
economist
John
Maynard
Keynes.
[Type text]
Page 19
STAGFLATION IN U.S.
Nevertheless, in the 1970s, Keynesian economists had to reconsider their
beliefs as the U.S. and other industrialized countries entered a period of
stagflation.
b.
High oil price in the 1970s
The 1973 oil crisis started in October 1973, when the members of the
OAPEC (consisting of the Arab members of OPEC, plus Egypt, Syria
and Tunisia) proclaimed an oil embargo. Figure 8 shows a history of oil
prices, including Nominal monthly average oil price and Inflationadjusted monthly average oil price as measured in 2007 dollars.
Figure 8: Nominal monthly Ave, Oil price and
Inflation adjusted monthly average oil price (19462008)
Source: InflationData.com as of 1/16/2008
[Type text]
Page 20
STAGFLATION IN U.S.
As illustrated, the period from 1946 to 1972 saw a stable trend in the
price of oil at around $20. Unexpectedly, oil price during the period
between 1972 and 1978 witnessed a 2.5 time increase, followed by a
soar in the following year to hit a new record of $100. However, the oil
price was off its peak of the year 1979, falling back by 80% to just $20
in 1986. The next years experienced a time of wild fluctuation and
instability.
Figure 9 shows year-over-year percentage changes in the core Consumer
Price Index (CPI) from 1958 to 2003, with a closer look on the late
1970s and early 1980s.
Figure 9: Inflation soared in the late 1970s and early
1980s
Source: Bureau of Labor Statistics
[Type text]
Page 21
STAGFLATION IN U.S.
This oil crisis in 1973 resulted in actual or relative scarcity of raw
materials. The price controls resulted in shortages at the point of
purchase, causing, for example, queues of consumers at fueling stations
and increased production costs for industry
c. Government’s policies
In July 1969, the Federal Reserve Board raised interest rates. Because
the United States had spent enormous amounts of money on the Cold
War, on the Vietnam War, on aid to less developed countries and, above
all, on President Johnson‘s welfare society, the resources of even the
mighty United States economy were stretched and prices were rising so
the Fed acted to slow the economy down
However, things turn out to be unexpected. Towards the end of 1969,
that is, less than six months after the Fed had acted, policies instituted by
the Nixon Administration began to push unemployment up. The
intention of these policies was to stop inflation by reducing demand.
Demand was to be reduced by reducing personal income, which was
assumed to be a function of increasing unemployment. But President
Nixon had already arranged in his message to Congress that ‚if
unemployment were to rise the programme of unemployment insurance
‚automatically would act to sustain personal income. He had therefore
undermined in advance his capacity to attack inflation through
increasing unemployment and reducing personal incomes.
For his policies, if they did not reduce incomes as much as the increase
in unemployment would have done in an earlier period, they did reduce
production. The number of unemployed shot up by more than one
million in less than a year. The rate of increase in the gross national
product dropped sharply.
[Type text]
Page 22
STAGFLATION IN U.S.
If it is socially unacceptable to move demand down far enough to
balance supply, then the only way of achieving balance in an
inflationary situation is to move supply up or, at least, keep it up to meet
demand. However, when insufficiency of supply started to cause
inflation, the United States have applied monetary and fiscal policies
that curtail certain areas of demand, including investment demand, and
that curtail production. This reduction of supply while demand
necessarily stays up under the pressure of government as well as of
private outlays, achieved those twin evils of more unemployment and
higher prices.
3. EXPLANATION FOR RISKS OF STAGFLATION RETURN
Although many forces buffet the U.S. economy, the near-zero interest
rate policy of the Federal Reserve is the prime contributor to the current
bout with stagflation.
Since 1945, most of the world has been on a dollar standard. Today, for
emerging markets outside of Europe, the dollar is used for invoicing
both exports and imports; it is the intermediary currency used by banks
for clearing international payments, and the intervention currency used
by governments. To avoid conflict in targeting exchange rates, the rule
of the game is that the U.S. remains passive without an exchange-rate
objective of its own.
Not having an exchange-rate constraint,
the Fed can conduct a more independent
monetary policy than other central banks
can. How it chooses to exercise this
independence is crucial to the stability of
the international monetary system as a
whole. For more than two years, the Fed
has chosen to keep short-term interest
rates on dollar assets close to zero and—over the past year—applied
[Type text]
Page 23
STAGFLATION IN U.S.
downward pressure on long rates through the so-called quantitative
easing measures to increase purchases of Treasury bonds. The result has
been a flood of hot money (i.e., volatile financial flows that are subject
to reversals) from the New York financial markets into emerging
markets on the dollar's periphery—particularly in Asia and Latin
America, where natural rates of interest are much higher.
Wanting to avoid sharp appreciations of their currencies and losses in
international competitiveness, many Asian and Latin American central
banks intervened to buy dollars with domestic base monies and lost
monetary control. This caused a surge in consumer price index (CPI)
inflation of more than 5% in major emerging markets such as China,
Brazil and Indonesia, with the dollar prices of primary commodities
rising more than 40% world-wide over the past year. So the proximate
cause of the rise in U.S. prices is inflation in emerging markets, but its
true origin is in Washington.
There is a second, purely domestic avenue by which near-zero interest
rates in U.S. interbank markets are constricting the economy. Since July
2008, the stock of so-called base money in the U.S. banking system has
virtually tripled. As part of its rescue mission in the crisis and to drive
interest rates down, the Fed has bought many nontraditional assets (e.g.,
mortgage-backed securities) as well as Treasurys. Yet these drastic
actions have not stimulated new bank lending. The huge increase in base
money is now lodged as excess reserves in large commercial banks.
In mid-2011, the supply of ordinary bank credit to firms and households
continues to fall from what it had been in mid-2008. Although large
corporate enterprises again have access to bond and equity financing,
bank credit is the principal source of finance for working capital for
small and medium-sized enterprises (SMEs) enabling them to purchase
labor and other supplies. In cyclical upswings, SMEs have traditionally
been the main engines for increasing employment, but not in the very
weak upswing of 2010-11, where employment gains have been meager
or nonexistent.
[Type text]
Page 24
STAGFLATION IN U.S.
Why should zero interest rates be causing a credit constraint? After all,
conventional thinking has it that the lower the interest rate the better
credit can expand. But this is only true when interest rates—particularly
interbank interest rates—are comfortably above zero. Banks with good
retail lending opportunities typically lend by opening credit lines to
nonbank customers. But these credit lines are open-ended in the sense
that the commercial borrower can choose when—and by how much—he
will actually draw on his credit line. This creates uncertainty for the
bank in not knowing what its future cash positions will be. An illiquid
bank could be in trouble if its customers simultaneously decided to draw
down their credit lines.
If the retail bank has easy access to the wholesale interbank market, its
liquidity is much improved. To cover unexpected liquidity shortfalls, it
can borrow from banks with excess reserves with little or no credit
checks. But if the prevailing interbank lending rate is close to zero (as it
is now), then large banks with surplus reserves become loath to part with
them for a derisory yield. And smaller banks, which collectively are the
biggest lenders to SMEs, cannot easily bid for funds at an interest rate
significantly above the prevailing interbank rate without inadvertently
signaling that they might be in trouble. Indeed, counterparty risk in
smaller banks remains substantial as almost 50 have failed so far this
year.
That the American system of bank intermediation is essentially broken is
reflected in the sharp fall in interbank lending: Interbank loans
outstanding in March 2011 were only a third of their level in May 2008,
just before the crisis hit. How to fix bank intermediation is a long story
for another time. But it is clear that the Fed's zero interest-rate policy has
worsened the situation. Without more lending to SMEs, domestic
economic stagnation will continue even though inflation is taking off.
The stagflation of the 1970s was brought on by unduly easy U.S.
monetary policy in conjunction with attempts to "talk" the dollar down,
leading to massive outflows of hot money that destabilized the monetary
[Type text]
Page 25