Factors affecting customer loyalty in mobile communication service in hanoi, vietnam
Bạn đang xem bản rút gọn của tài liệu. Xem và tải ngay bản đầy đủ của tài liệu tại đây (273.5 KB, 20 trang )
SUMMATION THESIS BY NGO ANH CUONG
PREFACE
Customers are invaluable assets of the business. Customer loyalty is significant
to the future development of a general company or the particular mobile service
providers. It contributes to maintain stable profits when the subscriber reaches the
saturation point, mature market and fierce competition.
In Vietnam, the mobile communication market has been transforming from a
monopolistic market to competitive market with participation more and more service
providers. Therefore, customers have many opportunities to choose services less
bound to the service provider. The change of service providers by customers becomes
phenomenal and increasing. Subscribers starts to layoff workers because they are
getting less and less number of customers to serve which showed that customers have
been not loyal to their providers.
To develop positively and sustainably for Vietnam’s mobile market, service
providers need to find ways to maintain valuable and loyal customer.
Chapter 1
INTRODUCTION
1.1 Background of the study
Research on factors affecting customer loyalty in mobile telecommunication
services in Viet Nam is significant to discover new scale and a new theoretical model
for managers. Research result will provide information for management to formulate
effective strategy for the use of telecommunications resources and helping suppliers
of mobile telecommunication services plan and implement more effective follow-up
market activities and customer care services.
1.2 Statement of the problem
To increase the competitiveness of the service providers as well as to increase
the market demand, the dissertation would like to seek answers to the following:
- Identify factors and quantify by scales to analyze factors affecting to
customer loyalty on mobile communication market in Hanoi.
- Research and analyze the factors affecting customer loyalty by statistical
methods: analyze the relationship between the different factors that affects customer
loyalty; to use regression and correlation method for assessing the impact of each
factor to customer loyalty;
1
- Survey to assess the customer loyalty for the suppliers of the mobile
communication services;
- Based on findings, the dissertation proposes some solutions to improve
customer loyalty for the mobile communication services of the supplies.
1.3 Hypotheses
H1: Service quality has a positive effect on customer satisfaction
H1.1: Increasing the call quality will increase the satisfaction level on service
quality;
H1.2: More reasonable price structure will increase the satisfaction level on
service quality;
H1.3: Increasing the value - added service quality will increase the satisfaction
level on service quality;
H1.4: More convenience in procedures will increase customer satisfaction
levels on service quality;
H1.5: Customer service is related to customer satisfaction on service quality.
H2: Customer satisfaction has a positive effect on loyalty
H3: Switching barriers has a positive effect on loyalty
H3.1: Loss cost affects the decision of the customer to change provider;
H3.2: Adapting cost is a switching barrier to the customer;
H3.3: Higher move – in cost is a switching barrier to the customer;
H3.4: Attractive offers of other providers are switching barrier to the
customers;
H3.5: Customer relationship is a switching barrier to the customer.
1.4. Significance of the study
Objectvie of the dissertation will be:
The dissertation will identify factors affecting customer loyalt.
The dissertation conduct to analyze relationship between demographic factors
with customer loyalty aims to provide practical information for administrators, new
service providers who want to join or maintain their position in the mobile
communication service market.
The disertation result can help service suppilers to indentify key factors related
to customer satisfaction and customer loyalty while helping service providers develop
and implement marketing stratergies to improve customer loyalty and limited
switching wave between service providers. The disdertation will also provide
2
important information for mobile service providers so they can formulate specific
strategies and plans for executing more effective marketing strategies and customer
care.
1.5. Scope and limitation
The scope of the study is the customers who have been using mobile in Hanoi.
It includes prepaid and postpaid. Factors affecting customer loyalty is mentioned in
this study as follows:demographics; quality services, switching barriers, etc.
1.6 Definition of terms
In this research, the dissertation will present some concepts related to research
content as follows: mobile telecommunications services prepaid the ground (prepaid
mobile service), mobile communication services provider, mrepaid subscriber,
postpaid subscriber, call quality, value – added service, monvenience in procedures,
price structure, customer services support, loss cost, adapting cost, move – in cost, ,
attractiveness of other providers, customer relationship.
Chapter 2
REVIEW OF RELATED LITERATURES AND STUDIES
2.1. Mobile telecommunication services
Mobile telecommunication services are clearly exhibiting signs of an abrupt
industry paradigm change and symptoms of a market in transition. Bolstered by the
rapid development of information and communication technologies (ICT) and high
demand from customers, the paradigm of mobile telecommunication services is now
shifting from voice-centered communication to a combination of high-speed data
communication and multimedia. Factors such as the growth of the wireless Internet
contribute to emphasize the appearance of a transition period in the mobile
telecommunication services market.
This change of paradigm and the symptoms of a market in transition are
driving the industry’s restructuring efforts and intensifying competition between
companies. Mobile carriers are coming to a full realization of the importance of a
customer-oriented business strategy as a condition for sustaining their competitive
edge and maintaining a stable profit level, and, indeed, for their very survival. When
the number of subscribers has reached its saturation point, creating and securing new
customers is not only difficult but also costly in terms of marketing. Hence, it is
becoming an industry-wide belief that the best core marketing strategy for the future
3
is to try to retain existing customers by heightening customer loyalty and customer
value.
2.2. Hanoi mobile communication services
In 2012, there were six providers about mobile communication service in
Hanoi with big three providers (Vinaphone, Viettel and Mobifone) and small three
providers (Gtel, Sfone and Vietnammobile).
* Viet Nam Telecom Services Company (Vinaphone)
As a member unit of Vietnam Post and Telecommunications Corporation
(VNPT), Currently VinaPhone provides services with 6 prefix numbers (091, 094,
0123, 0125, 0127, 0129) for about over 36 million of real subscribers.
* Viettel telecom company (Viettel)
Viettel Telecom Company (Viettel Telecom) is affiliated companies of the
Viettel telecom military corporation. Early in 2012, EVN Telecom has been merged
by Viettel, so Viettel has became a mobile communications provider with the largest
market share in Vietnam. Currently, Viettel is one of the leading mobile
communications suppliers in Vietnam with 10 subscriber numbers (098, 097, 096,
0163, 0164, 0165, 0166, 0167, 0168, 0169) and over 47,4 million subscribers.
* Viet Nam Mobile Telecom Services Company (VMS - Mobifone)
Vietnam Mobile Telecom Services Company - VMS, a state-owend company
under Vietnam Posts and Telecommunications Corporation. Currently Mobifone
provides services with 8 prefix numbers (090, 093, 0122, 0124, 0126, 0128, 0121,
0120) for about 21 million of real subscribers.
* Other suppliers
Other suppliers include SPT ( prefix number is 095); Gtel (prefix numbers are
099 and 0199) and Vietnamobile (prefix numbers are 092 and 0188). Three suppliers
have a very low market share so they are very difficult to compete the largest
suppliers.
2. 3. Customer loyalty
There are many concepts of customer loyalty.
Jim Novo (2011) described customer loyalty as a tendency of a customer to
choose a particular brand of business or product to fulfill their needs. And Reihchhed
and Detricf (2003) said that Customer loyalty is astrategy that creates mutual rewards
to benefit firms and customers.With loyalty customers, companies can maximize their
profit because loyal customers are willing to purchase more frequently, spend money
4
on trying new products or services, recommend products and services to others, and
give companies sincere suggestions.
2.4. Affecting factors to loyal customer
* Customer satisfaction
According to Spreng at al.1996, Customer satisfaction is the emotional state of
products and services have been used. Satisfaction can be obtained because of what
was expected. The empirical studies have shown that customer relationship and
service quality are distinct concept. And the customers’ own perceptions of service
quality are the main factor to effect customer satisfaction. And service quality is
determined as the customers’ satisfaction or dissatisfaction formed by their experience
of purchase and use of the service. In the mobile communication service quality has
been measured by call quality, pricing structure, mobile devices, value-added
services, convenience in procedures, and customer support (e.g., Kim, 2000; Gerpott
et al., 2001; Lee, Lee, & Freick, 2001).
* Switching Barriers
The switching barrier refers to the difficulty of switching to another provider
that is encountered by a customer who is dissatisfied with the existing service, or to
the financial, social and psychological burden felt by a customer when switching to a
new carrier. According to a previous study, the switching barrier is made up of
switching cost, the attractiveness of alternatives, and customer relationships.
* Demographic factors
In addition to the factors presented above, the customer loyalty may also be
affected by demographic factors: age, gender, occupation, education level ...
2.5. Customer loyalty models
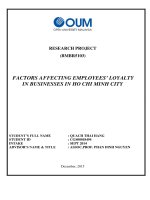
* Proposed integrated model of service Loyalty
Perceived
Service Quality
Customer
Satisfaction
Service
Loyalty
Figure 1: Proposed integrated model of service Loyalty
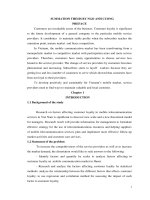
* Switching barrier model of customer loyalty
5
Customer loyalty
Customer Satisfation
Switching barrier
- Switching cost
- Customer relationship
- Attractive provider others
Figure 2: Switching barrier model of customer loyalty
2.6. Several topics related to mobilecommunication services
2.6.1. Some topics researched in Viet Nam
Ky Duc Pham and Hung Nguyen Bui (2007) have has built theoretical models,
test hypotheses and provide a new scale for mobile communication service market in
Viet Nam. According to authors, the service quality was the most important factor
affecting customer loyalty.
And when researching about assessment of customer satisfaction towad the
mobile telecom services in Hue, Thai Ha Thanh and Ton Duc Sau (2011) showed that
service quality was the most important factor effecting customer satisfaction.
Duong Tri Thao and Nguyen Hai Bien (2011) have studied based on
theoretical models of consumer loyalty and satisfaction, this study aims to consider
relationship between service quality and consumer satisfaction of mobile phone
service in Nha Trang city, Vietnam. Results of the research show that models of
consumer satisfaction fit well with the data, and consumer satisfaction of mobile
phone was influenced positively by five factors including call quality; value added
service; convenience; perceived price and consumer service.
2.6.2 Some topics researched Overseas
Figure 3: Customer loyalty about mobile communication service in American
Accepting
prices
Perception
quality
Perceived
value
Expecting
perception
Customer
complant
s
Customer
satisfaction
Buy back
capabilities
6
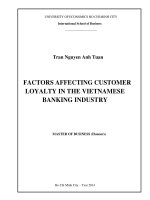
Figure 4: The model of impacting satisfaction and switching barrier to customer
loyalty the mobile communication service in Korea
Customer
loyalty
Satisfaction
Add –
value
service
Call
quality
Switching
barrier
Customer
support
Loss cost
Move in
cost
Customer
relationshi
p
Switching cost
Service quality
2.7. Conceptual framework
Quality services:
- Call quality
- Price structure
-Value add
services
Customer
satisfaction
-Convenience in
procedures
-Customer
services
Customer loyalty
Switching costs
- Loss cost
Recommendation
s to improve
customer loyalty
in mobile
communication
service market in
Hanoi area
- Adapting costs
- Move-in cost
Switching
barrier
Attractiveness of
other providers
Customer
relationship
7
Figure 5: The proposed model for mobile communication service in Hanoi
Source: the experimental model of customer loyalty in the communication
market in Ho Chi Minh city by Pham Duc ky and Bui Nguyen Hung, (2007)
Chapter 3
METHODOLOGY
3.1 Research design
The variables to determine customer loyalty were selected based from the
conceptual framework at figure 5. It includes:
The quality services included: calling quality with 5 variables; price structure
with 5 variables; value - add services with 5 variables; convenience in procedures
with 4 variables and customer support services with 5 variables.
And the switching barrier included: loss cost with 2 variables; adapting cost
with 2 variables; move – in cost with 2 variables; attractive offers of providers and
customer relationship with 4 variables.
In addition, the questionnaire also used 3 other factors: customer satisfaction
with 2 variables; switching barrier with 2 variables and customer loyalty with 2
variables.
3.2 Determination of sample size
Dissertation uses the Slovin’s formula to difine the sample size for the survey.
n=
N
1 Ne 2
where n : sample size
N: Population size that is 9.1 million mobile subscribers.
e: Probability of error committed due to the use of sample instead of
population. The error level in sample survey was chosen to be at 5%.
Thus, the minimum sample size to conduct the investigations would be:
n=
9100000
N
399,98 400
2
1 Ne
1 9100000 * (0,05) 2
(population)
Thus, the sample size of the survey is 400 respondents.
3.3 Sampling design and techniques
The sampling method was conducted using stratified random sampling but
based on several factors: the market share of service providers, demographic (gender,
age group and occupation) factors, types of services (post-paid and pre- paid).
8
3.4 Research instrument
To measure the factors that affect customer loyalty in mobile communication
services, the questionnaire using the Likert scale with five levels: 5: strongly agree; 4:
agree; 3: normal; 2: disagree and 1: strongly disagree.
The questionnaire was designed in two parts:
- Part one: The customer’s demographic profile which included the
information used to classify customer groups who are using mobile communication
service such as: name, gender, education level, occupation, and income.
- Part two: This part deals on the questions that measured the customer’s
loyalty using the selected variables or indicators.
3.5 Data gathering procedure
- Secondary data: the author collected data from the managing state agencies
related to mobile communication: Ministry of Information and Communications,
General Statistics Office, Hanoi Department of Information and Communication and
Hanoi Post Office.
- Primary data: were taken from the survey results of 400 respondents who
have been using the mobile communication service of providers.
3. 6 Data processing method
After information is collected, obtained were cleaned and processed using
SPSS 16.0.
3. 7 Statistical treatment
In this research, dissertation used some statistical method to analyze factors
affecting customer loyalty in the mobile communication service. Descriptive
statistics, Chi-square test were used to analyze relationship between demographic
factors with the customer loyalty.
For this research, linear regression analysis was used to test for the linear
relationship between the variables identified in hypotheses. Using correlation
coefficient (r) to test relationship between variables of hypo dissertation pairs.
Chapter 4
PRESENTATION ANALYSIS AND FINDINGS
NTERPRETATION OF DATA
4.1 Respondents profile
To gather sufficient information of 400 respondents, before importing data to
prepare data synthesis process and analysis, the survey questionnaire was cleaning
9
information, encryption. Results preliminary statistics of respondents was shown as
follows:
Table 4.4: The summary of the distributive sample by gender, age and type of service providers
Age groups
The vendor
Mobifone
Gender
Vinaphone
Gender
Viettel
Gender
Others
Gender
Services type
Total
18-24
25-34
35-44
45-54
Over 55
Postpaid
Prepaid
Male
43
4
16
13
8
2
13
30
Female
31
2
12
10
6
1
9
22
Male
72
5
27
23
14
3
29
43
Female
53
3
21
17
10
2
21
32
Male
99
6
38
33
18
4
30
69
Female
73
5
29
24
13
2
22
51
Male
17
1
6
5
4
1
4
13
Female
12
1
5
4
2
0
2
10
400
27
154
129
75
15
130
270
Total
4.2 Scale values test
The scale is a preliminary assessment through Cronbach Alpha coefficients.
Cronbach alpha coefficient is used to remove the waste variables. Variables were
excluded when the corrected Item –Total Correlation of Variables is less than 0.3 and
the standard value to assess the better scale when it has reliability alpha to be 0.6 or
higher (Nunnally & Burnstein 1994).
4.2.1 Services quality
Cronback’s alpha of “calling quality” is 0.775.
Cronbach alpha of the “Pricing structure” is 0.85.
The composition of “value added services” with Cronbach alpha is 0.794.
The composition of “Convenience in procedures’ with Cronbach alpha is
0.806.
The composition of “customer service supports” with Cronbach alpha is
0.738.
4.2.2 Switching Barriers
The Cronbach’s alpha of the component “loss cost” is 0.765
The Adapting cost component with Cronbach's alpha 0.684.
The Move – in cost with Cronbach’s alpha is 0.644
The Cronbach’s alpha of “attractiveness of other providers” is 0.915.
The Cronbach’s alpha of the “customer relationship” is 0.852.
10
4.3 Preliminary analysis of the component variables
4.3.1 Service quality
The mean value of the measured variable about quality mobile communication
services is considered fairly average. The highest value is “the pricing structure”
(mean = 3.5600) and the lowest is the “convenience in procedure” (mean = 3.2306).
Mean value of variables are higher than 3 and the Std. deviation is less 1 show that
customer evaluation has high consistency. However, mean value is less than 4 means
that customers do not agree with service quality than customers agree.
4.3.2 Switching barriers
Statistical results showed that, the elements of switching barriers did not
significantly affect satisfaction as well as long-term intention of customer to use
mobile communication the services of suppliers. The element “Loss cost” has the
highest average value (mean = 3.1437). The element “Customer relationship” has the
lowest average values (mean = 2.8875) shows that customers are not satisfied with the
customer services care of the providers.
4.4 Hypothesis test
H1: Service quality has a positive effect on customer satisfaction
H1.1: Increasing the call quality will increase the satisfaction level on service quality
The correlation coeficient between call quality with customer satisfaction is
0.526. It shows that the relationship between the calling quality and customer
satisfaction is directly proportional. The significance level is less 0.05 (Sig = 0.000) to
reflect meaningful relationships. Thus, this hypothesis is accepted.
H1.2: More reasonable price structure will increase the satisfaction level on service
quality
Statistical result showed that the correlation coeficient is 0.701. So, the ralasionship
between the price structure and customer satisfaction is directly proportional. The
significance level is less 0.05 (Sig = 0.000) to reflect meaningful relationships. Thus,
this hypothesis is accepted.
H1.3: Increasing the value - added service quality will increase the satisfaction level
on service quality
Statistical result showed that the correlation coeficient is 0.671. So, the relationship
between the value - added service quality and customer satisfaction is directly
proportional. The significance level is less 0.05 (Sig = 0.000) to reflect meaningful
relationships. Thus, this hypothesis is accepted.
11
H1.4: More convenience in procedures will increase customer satisfaction levels on
service quality
Statistical result showed that the correlation coefficient is 0.696. So, the relationship
between the convenience in procedures and customer satisfaction is directly
proportional. The significance level is less 0.05 (Sig = 0.000) to reflect meaningful
relationships. Thus, this hypothesis is accepted.
H1.5: Customer support service is related to customer satisfaction on service quality
Statistical result showed that the correlation coefficient is 0.290. So, the ralasionship
between the customer services and customer satisfaction is directly proportional. The
significance level is less 0.05 (Sig = 0.000) to reflect meaningful relationships. Thus,
this hypothesis is accepted.
H2: Customer satisfaction has a positive effect on loyalty
Statistical result showed that the correlation coefficient of “customer
satisfaction” and “customer loyalty” is 0.877. So, the relasionship between customer
satisfaction and the customer loyalty are directly proportional. The significance level
is less 0.05 (Sig = 0.000) to reflect meaningful relationships. Thus, this hypothesis is
accepted.
H3: Switching barriers has a positive effect on loyalty
H3.1: Loss cost affects the decision of the customer to change provider
The correlation coefficient of “loss cost” and “switching barriers” is 0.609. So, the
relationship between the loss costs and switching barrier are directly proportional. The
significance level is less 0.05 (Sig = 0.000) to reflect meaningful relationships. Thus,
this hypothesis is accepted.
H3.2: Adapting cost is a switching barrier to the customer
Statistical result showed that the correlation coefficient of “adapting cost” and
“switching barrier” is 0.312. So, the relationship between the adapting cost and
switching barrier are directly proportional. The significance level is less than 0.05
(Sig = 0.000) to reflect meaningful relationships. Thus, this hypothesis is accepted.
H3.3 Higher move – in cost is a switching barrier to the customer
The correlation coefficient of “move – in cost” and “switching barrier” is 0.014. And,
the significance level is higher than 0.05 (Sig = 0.786) to reflect between the move –
in cost and switching barrier is not the relationship. Thus, this hypothesis is not
accepted in this study.
H3.4: Attractive offers of other providers are switching barrier to the customers
12
The correlation coefficient of “attractiveness of
other providers” and
“switching barrier” is -0.549. So, the relasionship between the adapting cost and
switching barrier are inversely proportional. That is mean, adapting cost is more lower
and more greater switching barrier. The significance level is less 0.05 (Sig = 0.000) to
reflect meaningful relationships. Thus, this hypothesis is accepted.
H3.5: Customer relationship is a switching barrier to the customer
The correlation coefficient of “customer relationship” and “switching barrier”
is 0.620. So, the relasionship between” customer relationship” and the “switching
barrier” are directly proportional. That is mean, customer relationship is more
stronger and more greater switching barrier. The significance level is less 0.05 (Sig =
0.000) to reflect meaningful relationships. Thus, this hypothesis is accepted.
Statistical result showed that the correlation coefficient of “switching barrier”
and “customer loyalty” is 0.675. So, the ralasionship between switching barrier and
the customer loyalty are directly proportional. The significance level is less 0.05 (Sig
= 0.000) to reflect meaningful relationships. Thus, the hypothesis “switching barriers
has a positive effect on loyalty” is accepted.
4.5 Factors affecting customer loyalty
4.5.1 Analyzing relationship between demographics factors with service
providers.
* Gender
The result of Chi-square test indicated that, there is not relationship between
the gender of subscribers in choosing service providers due to the significance of the
test is greater than 0.05 (Sig = 0.999 ).
* Education level
Result of Chi-square test showed that there was relationship between the
education of subscriber in choosing service providers due to the value of the Chisquare test was less than 0.05 (Sig = 0.000).
* Occupation
The statistical result showed that there is not relationship between occupation
of subscribers with selection of service providers due to value of Chi-square is 0.546.
* Per average income
The analytical results show that there is relationship between income of
subscribers with service providers due to the significance of the Chi-square test is less
than 0.05 (Sig = 0.000).
13
4.5.2 Relationship beween factors affecting loyalty versus demographic
factors
* Gender
Analytical result showed that gender of subscribers have relationship with
“value – add service” and “adapting costs” due to values of Chi-square test are less
than 0.05 . The remaining factors affecting loyalty have no relationship with the
subscriber's gender due to values of Chi-square test are higher than 0.05. (Appendix
3.1)
* Occupation
The results of analysis showed that there are not relationship between
subscriber’s occupation with factors affecting loyalty as follows: “not losing when
your messages send and receive”, value – add service and move – in cost due to
significance level of Chi-square tests are higher than 0.05. The remaining factors are
relationship with occupational subscribers due to significane level of Chi-square tests
are less than 0.05 (appendix 3.2).
* Per average income
The results of analysis showed that there are not relationship between
subscriber’s income with factors affecting loyalty as follows: “not losing when your
messages send and receive”; convenience in procedure; value –add service, customer
suppot service and move – in cost due to significance level of these test are higher
than 0.05. The remaining factors affecting loyalty are relationship with subscriber’s
income due to significane level of Chi-square tests are less than 0.05. (appendix 3.3).
* Ages
The results of analysis showed that there are relationship between
subscriber’s ages with assess of subscriber in adapting cost of service providers due to
the significance level of Chi-square is 0.003. Remaining factors affecting loyalty are
not relationship with subscriber’s ages due to significane level of Chi-square tests are
higher than 0.05 (appendix 3.4).
* Education level
The results of analysis showed that there are relationship between
subscriber’s eduacation with factors affecting loyalty (calling quality is clear, not
without dropping the call when the call is done, the scope of coverage and the supplier
has service packages with different charges to suitable customer demands) due to the
14
significance level of Chi-square tests are less 0.05. Remaining factors affecting
loyalty are not relationship with subscriber’s education due to significane level of
Chi-square tests are higher than 0.05 (appendix 3.5).
4.5.3 Analyzing the Factors that Affect Customer Loyalty
The model of analysis affecting customer loyalty in mobile communication
services in HaNoi is reflected as follows:
CL = -0.404 + 0.173 * (CQ) + 0.163 *(PS) + 0.097 *(VAS) +0.162*CP+ 0.178 *(LC)
- 0.140 * (AOP) + 0.260 *(CR)
According to this model, there are 7 factors affecting customer loyalty. The impactive
level of factors are explaind as follows:
The regression coefficient of “customer relationship” is 0.260 (ß10 =0.260) so this
factor is strongest influence to customer loyalty. The “loss cost” is the second factor
affecting customer loyalty (ß6=0.178). The “calling quality” is thirth factor affecting
customer loyalty. The regression coefficient of “pricing structure” is 0.163 so This is
the fourth factor affecting customer loyalty. The fifth factor is “Convenience in
procedure”(ß4= 0.162). The “attractiveness of other providers” is the sixth factor
affecting customer loyalty (ß9 = -0.140). However, the negative regression coefficient
reflects inversely proportional relationship between “attractiveness of other providers”
with customer loyalty. The regression coefficient of “value – add services” is 0.097 so
this factor is the weakest influence to customer loyalty.
Chapter 5
SUMMARY, CONCLUSIONS AND RECOMMENDATIONS
5.1 Summary of results
The Cronback’alpha of results showed that some component variables (The
scope of coverage; The supplier has service packages with different charges to
suitable customer demands; Quick solving problem services; The staff are always
friendly with the custome) were not dissatisfaction with conditional test due to the
Cronback’alpha coefficient was less than 0.6 and the “Corrected Item-Total
Correlation” was less than 0.3. The component variables of the remaining factors
were accepted in this research due to the the Cronback’alpha coefficient was more
than 0.6 and the “Corrected Item-Total Correlation” was more than 0.3.
The test results of the hypothesis pairs confirmed that the test results for the
pair confirmed the hypothesis that there were positive relationship between service
15
quality with customer satisfaction; customer satisfaction with customer loyalty and
switching barriers with customer loyalty. However, the hypothesis “Higher move – in
cost is a switching barrier to the customer” were not accepted in this research.
Result of linear regression analysis showed that there are 7 factors affecting
customer loyalty as follows: customer relationship, loss cost, calling quality, pricing
structure, convenience in procedure, attractiveness of other providers, value – add
services.
5.2 Conclusions
Thus, the research has shown to be factors affecting customer loyalty in
mobile communication in Hanoi as follows:
With service providers, there were relationships between education level and
income of subscribers with choosing service providers.
With factors affecting loyalty, (1) gender of subscribers have relationship with
“value – add service” and “adapting costs”; (2) subscriber’s occupation have
relationship with factors affecting loyalty as follows: call quality, customer
relationship, attractiveness of other service provider, etc; (3) income of subscribers
have relationship with factors affecting loyalty as follows: call quality, lost cost,
adapting cost, attractiveness of other service providers, customer relationship, etc; (4)
age of subscribers are relationship with assess of subscriber in adapting cost of service
providers; (5) education level of subscriber are relationship with factors affecting
loyalty (calling quality is clear, not without dropping the call when the call is done,
the scope of coverage and the supplier has service packages with different charges to
suitable customer demands).
There were seven component factors affecting customer loyalty. In which, the
“service quality” had four component factors: calling quality, Pricing structure, value
– add services and Convenience in procedures. The “switching barrier” had three
component factors: loss cost, attractiveness of other suppliers and customer
relationship. According to Nguyen Duc Ky and Bui Nguyen Hung, the “calling
quality” was the strongest influential customer loyalty. However, this factor was only
thirth factor affecting customer loyalty after the “customer relationship” and the “loss
cost” in this research. The “customer loyalty” was the strongest influential custome
loyalty and the “value – add services” was the lowest influential customer loyalty.
5.3 Recommendations
5.3.1 Demographic factors
16
With small service providers, these providers should improve service quality
especially expanding coverage to enhance call quality to attract these customer groups.
With big service providers, their service quality are better but rates of service are often
higher than small service providers. So, in the future these providers should be
lowered rates to attract new subscribers (especially subscribers with low income, low
education level and unstable occupation)
In addition, service providers should have policies reasonable customer
segments to increase the new subcribers and maintain old subcribers aim to achieve
the highest business performance.
5.3.2 Service quality
Because of this, the quality service provider is constantly improving over time.
This is reflected in evaluating customer of the component factors of service quality
are greater than 3. However, the average point of the component elements are lower
than 4. This shows that the customer is not satisfied with the service quality of
provider. Therefore, service providers need to improve the quality of our services to
meet the diversified demand of customers.
5.3.2.1 Calling quality
Analytical results of factors affecting customer loyalty to suppliers in the
mobile communication market in Hanoi showed that the call quality is a factor impact
directly to loyalty customers. In recent years, the calling quality of the supplier has
improved a lot but the disconnected phenomena, network congestion or undeliverable
message still occurs when the communication needs of the client surged suddenly.
Therefore, service providers need to invest in facilities: network expansion and
upgrade the capacity ... to ensure calling quality is better.
5.3.2.2 Pricing structure
Results of regression analysis showed that rates are the one of the factors to
keep and attract customers using the services of the provider.
To improve customer loyalty, the small service providers should invest in
infrastructure to expand the scope of coverage. However, the loyalty of this client to
suppliers is not high. The reason is that the the scope of coverage is small so ability to
connect the calls are restricted. The current reality, a small number of providers still
have to depend on Vinaphone provider about infrastructure. Thus, they do not have
many advantages in infrastructure. This is cause for the scope of coverage to be
17
limited. Therefore, the government should have reasonable policies to they may be
compete on an equal footing with the major suppliers.
To maintain customer loyalty, suppliers should apply trade discount for
customers who paid high charges, loyal customer, longtime customer, older
subscribers, etc.
Results showed that occupation, per average income and using time are factors
that have relationship with customer loyalty. So, service providers should conduct
market segmentation and niche market development to attract new subscribers and
maintain old subscribers. For example, service providers should have suitable
packages for each customer groups: staff of organizations, worker in industrial parks,
students, etc.
5.3.2.3 Convenience in procedures
To enhance the loyalty of our customers, suppliers should improve enhance
the convenience in the process provides: extended form of payment (internet, ATM,
banking payment…); notification and sending bill on time; SIM Card replacement…
Contracting procedures need to simplify to attract more customers using postpaid
subscribers.
5.3.2.4 Value – add services
The needs of customers using the internet is increasing. The mobile phone
manufacturers have used high technology to enhance the features for mobile phones:
access to high speed internet, text editor, camera and video with high picture quality
next usual features of a mobile phone: listen, call and send messages, etc. So,
providers should often update the new added-value services to maintain subscribers
old and attract new subscribers.
Currently, there are many type of value – add services that have been provided
on the mobile communication service market by service providers. However, these
types of value – add services have similarities: speed of internet access, charges,
content of access, etc. So, service providers should make a difference and focus on
value-added services which they have an advantage.he
5.3.3 Switching barrier
The results of the factor analysis about customer loyalty showed that the
element switching costs have three factors directly impact loyal customer as customer
relationship, the attractiveness of other suppliers and loss cost.
18
5.3.3.1 Customer relationship
In the regression model, the factor was the most strong impact in customer
loyalty for providers. Results of describe statistical analysis showed that, evaluative
average of customers was than 3 . This reflects that customers are not satisfied on
issues customer relations of vendor.
Therefore, to improve customer loyalty, providers should increase the
exchange of information with customers, applying information technology (sent over
email) to send the list of call charges when customers have request; often organizing
training courses to enhance professional and communication skills with clients to
staff; public charging principles for different types of services ...
5.3.3.2 Attractiveness of other suppliers
These factors negatively affect customer loyalty to suppliers. The
attractiveness of the other service providers will make up for customer loyalty to
suppliers that they are using the service is reduced. This factor reflects the
competitiveness of suppliers.
To enhance the loyalty of subscribers, providers should make
some solutions:
improving the quality of services, building strategies specific to developing brand
(advertising, identity brand through the logo and slogan of the supplier), expanding
the store and the customer support center ...
5.3.3.3 Loss cost
Results of research showed that, customers have using long time, high income,
stable occupation, postpaid subscribers who usually are loyal with their service
providers. Result of depth interview showed that the reason of these customers get
loyal their service providers so they felt inconvenience when having to replace
number phone. Because, when they used new number phone they would take more
time and costs to inform their friends, family and their business partners.
Therefore, service providers should have suitable policies for these customer
groups as apply preferential tariff policy for customers to use services of suppliers
long time. Customers have more using time and more lower charge. Service providers
should use information technology to customers may be easy information for related
persons when these customers change phone number due to some reasons: lost old
phone number, to be broken SIM, change new phone number, etc.
19
Published project
Ngo Anh Cuong (2013), Factors affecting customer loyalty in mobile
communication service in Hanoi, Journal of Sience and Technology, ISSN 19593585, Hanoi University of Indusstry, No 16/06-2013, pages 83-87.
20