Bài mẫu band 9 IELTS WRITING
Bạn đang xem bản rút gọn của tài liệu. Xem và tải ngay bản đầy đủ của tài liệu tại đây (1.99 MB, 48 trang )
1
IELTS WRITING
TASK 1
TỔNG HỢP BÀI MẪU BAND 9
0169 201 4800
ieltstolinh.com
2
Nội dung:
I. Bar chart ................................................................................................................................. 4
II. Table .....................................................................................................................................14
III. Pie chart...............................................................................................................................20
IV. Line graph ...........................................................................................................................25
V. Map ......................................................................................................................................29
VI. Diagram ...............................................................................................................................34
VII. Cycle / process ...................................................................................................................39
VIII. Multiple chart .....................................................................................................................43
0169 201 4800
ieltstolinh.com
3
Lưu ý
1 - Để sử dụng tài liệu này hiệu quả, các bạn nên xem qua trước các bài sau đây:
1. Cấu trúc 1 bài viết IELTS Writing task 1 (Link)
2. Vocabulary cho graph topics (Link)
3. Ngôn ngữ so sánh (Link)
2 – Những điều bạn cần làm:
1. Không copy lại đề bài. Nội dung của phần introduction phải được paraphrase lại từ đề
bài.
2. Chia các phần của bài viết (đoạn văn) rõ ràng, đảm bảo đủ 4 phần.
3. Bạn muốn đạt điểm cao? Hãy có một đoạn summary/overview tốt.
4. Đừng mô tả đối tượng một cách riêng lẻ. Nói cách khác, đừng mô tả lần lượt từng đối
tượng một. Hãy luôn so sánh các đối tượng với nhau nếu có thể.
5. Nếu bạn có quá nhiều số liệu trong một graph, đừng đề cập đến tất cả. Chìa khóa thành
công ở task 1 nằm ở việc bạn chọn được thông tin chính, cần thiết và sau đó so sánh,
mô tả một cách chính xác.
6. Đừng dành hơn 20 phút cho task 1 vì task 2 nhiều điểm hơn task 1. Bạn hãy luyện tập
để mỗi đoạn văn ở task 1 chỉ lấy của bạn tầm 5 phút.
0169 201 4800
ieltstolinh.com
4
I. Bar chart
1 - The chart below shows the amount of time that 10 to 15-year-olds spend chatting on
the Internet and playing on games consoles on an average school day in the UK.
...
The bar chart compares the time spent by 10 to 15-year-olds in the UK on two activities, namely
chatting online and playing computer games.
Overall, we can see that playing computer games is marginally more popular than chatting on
the Internet. However, completely different trends can be seen if we look at the specific figures
for boys and girls.
Boys aged between 10 and 15 clearly favour playing on games consoles over chatting online.
According to the chart, while 85% of boys play computer games every day, only 55% chat
online daily. Furthermore, the majority of boys play on their consoles for more than one hour
each day, and 10% do this activity for four hours or more.
By contrast, girls prefer chatting online. Close to 70% of 10 to 15-year-old girls engage in online
conversation each day, compared to about 50% of this cohort who play computer games. Of the
girls who do play on consoles, most of them play for less than an hour, whereas most girls who
chat online do so for more than one hour, and nearly 10% chat for four hours or more.
0169 201 4800
ieltstolinh.com
5
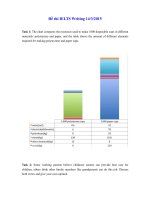
2 - The chart below shows the total number of minutes (in billions) of telephone calls in
the UK, divided into three categories, from 1995-2002.
The bar chart compares the amount of time spent by people in the UK on three different types of
phone call between 1995 and 2002.
It is clear that calls made via local, fixed lines were the most popular type, in terms of overall
usage, throughout the period shown. The lowest figures on the chart are for mobile calls, but
this category also saw the most dramatic increase in user minutes.
In 1995, people in the UK used fixed lines for a total of just over 70 billion minutes for local calls,
and about half of that amount of time for national or international calls. By contrast, mobile
phones were only used for around 4 billion minutes. Over the following four years, the figures for
all three types of phone call increased steadily.
By 1999, the amount of time spent on local calls using landlines had reached a peak at 90
billion minutes. Subsequently, the figure for this category fell, but the rise in the other two types
of phone call continued. In 2002, the number of minutes of national / international landline calls
passed 60 billion, while the figure for mobiles rose to around 45 billion minutes.
0169 201 4800
ieltstolinh.com
6
3 - The bar graph shows the global sales (in billions of dollars) of different types of digital
games between 2000 and 2006.
The bar chart compares the turnover in dollars from sales of video games for four different
platforms, namely mobile phones, online, consoles and handheld devices, from 2000 to 2006.
It is clear that sales of games for three out of the four platforms rose each year, leading to a
significant rise in total global turnover over the 7-year period. Sales figures for handheld games
were at least twice as high as those for any other platform in almost every year.
In 2000, worldwide sales of handheld games stood at around $11 billion, while console games
earned just under $6 billion. No figures are given for mobile or online games in that year. Over
the next 3 years, sales of handheld video games rose by about $4 billion, but the figure for
consoles decreased by $2 billion. Mobile phone and online games started to become popular,
with sales reaching around $3 billion in 2003.
In 2006, sales of handheld, online and mobile games reached peaks of 17, 9 and 7 billion
dollars respectively. By contrast, turnover from console games dropped to its lowest point, at
around $2.5 billion.
0169 201 4800
ieltstolinh.com
7
4 - Nathan’s Hot Dog Eating Contest
The bar chart shows the number of hot dogs and buns eaten in 15 minutes by the winners of
‘Nathan’s Hot Dog Eating Contest’ in Brooklyn, USA between 1980 and 2010.
It is noticeable that the number of hot dogs and buns eaten by winners of the contest increased
dramatically over the period shown. The majority of winners were American or Japanese, and
only one woman had ever won the contest.
Americans dominated the contest from 1980 to 1996, and the winning number of hot dogs and
buns consumed rose from only 8 to around 21 during that time. 1983 and 1984 were notable
exceptions to the trend for American winners. In 1983 a Mexican won the contest after eating
19.5 hot dogs, almost double the amount that any previous winner had eaten, and 1984 saw the
only female winner, Birgit Felden from Germany.
0169 201 4800
ieltstolinh.com
8
A Japanese contestant, Takeru Kobayashi, reigned as hot dog eating champion for six years
from 2001 to 2006. Kobayashi’s winning totals of around 50 hot dogs were roughly double the
amount that any previous winner had managed. However, the current champion, American Joey
Chestnut, took hot dog eating to new heights in 2009 when he consumed an incredible 68 hot
dogs and buns in the allotted 15 minutes.
5 - The chart below shows the total number of Olympic medals won by twelve different
countries.
The bar chart compares twelve countries in terms of the overall number of medals that they
have won at the Olympic Games.
It is clear that the USA is by far the most successful Olympic medal winning nation. It is also
noticeable that the figures for gold, silver and bronze medals won by any particular country tend
to be fairly similar.
The USA has won a total of around 2,300 Olympic medals, including approximately 900 gold
medals, 750 silver and 650 bronze. In second place on the all-time medals chart is the Soviet
Union, with just over 1,000 medals. Again, the number of gold medals won by this country is
slightly higher than the number of silver or bronze medals.
Only four other countries - the UK, France, Germany and Italy - have won more than 500
Olympic medals, all with similar proportions of each medal colour. Apart from the USA and the
Soviet Union, China is the only other country with a noticeably higher proportion of gold medals
(about 200) compared to silver and bronze (about 100 each).
0169 201 4800
ieltstolinh.com
9
6 - Temperature and precipitation comparison:
The chart compares average figures for temperature and precipitation over the course of a
calendar year in Kolkata.
It is noticeable that monthly figures for precipitation in Kolkata vary considerably, whereas
monthly temperatures remain relatively stable. Rainfall is highest from July to August, while
temperatures are highest in April and May.
Between the months of January and May, average temperatures in Kolkata rise from their
lowest point at around 20°C to a peak of just over 30°C. Average rainfall in the city also rises
over the same period, from approximately 20mm of rain in January to 100mm in May.
While temperatures stay roughly the same for the next four months, the amount of rainfall more
than doubles between May and June. Figures for precipitation remain above 250mm from June
to September, peaking at around 330mm in July. The final three months of the year see a
dramatic fall in precipitation, to a low of about 10mm in December, and a steady drop in
temperatures back to the January average.
0169 201 4800
ieltstolinh.com
10
7
The bar charts compare students of different ages in terms of why they are studying and
whether they are supported by an employer.
It is clear that the proportion of students who study for career purposes is far higher among the
younger age groups, while the oldest students are more likely to study for interest. Employer
support is more commonly given to younger students.
Around 80% of students aged under 26 study to further their careers, whereas only 10% study
purely out of interest. The gap between these two proportions narrows as students get older,
and the figures for those in their forties are the same, at about 40%. Students aged over 49
overwhelmingly study for interest (70%) rather than for professional reasons (less than 20%).
0169 201 4800
ieltstolinh.com
11
Just over 60% of students aged under 26 are supported by their employers. By contrast, the 3039 age group is the most self-sufficient, with only 30% being given time off and help with fees.
The figures rise slightly for students in their forties and for those aged 50 or more.
8 - The chart below shows numbers of incidents and injuries per 100 million passenger
miles travelled (PMT) by transportation type in 2002.
The bar chart compares the number of incidents and injuries for every 100 million passenger
miles travelled on five different types of public transport in 2002.
It is clear that the most incidents and injuries took place on demand-response vehicles. By
contrast, commuter rail services recorded by far the lowest figures.
A total of 225 incidents and 173 injuries, per 100 million passenger miles travelled, took place
on demand-response transport services. These figures were nearly three times as high as those
for the second highest category, bus services. There were 76 incidents and 66 people were
injured on buses.
Rail services experienced fewer problems. The number of incidents on light rail trains equalled
the figure recorded for buses, but there were significantly fewer injuries, at only 39. Heavy rail
services saw lower numbers of such events than light rail services, but commuter rail
passengers were even less likely to experience problems. In fact, only 20 incidents and 17
injuries occurred on commuter trains.
0169 201 4800
ieltstolinh.com
12
9 - The chart below shows information about changes in average house prices in five
different cities between 1990 and 2002 compared with the average house prices in 1989.
The bar chart compares the cost of an average house in five major cities over a period of 13
years from 1989.
We can see that house prices fell overall between 1990 and 1995, but most of the cities saw
rising prices between 1996 and 2002. London experienced by far the greatest changes in house
prices over the 13-year period.
Over the 5 years after 1989, the cost of average homes in Tokyo and London dropped by
around 7%, while New York house prices went down by 5%. By contrast, prices rose by
approximately 2% in both Madrid and Frankfurt.
Between 1996 and 2002, London house prices jumped to around 12% above the 1989 average.
Homebuyers in New York also had to pay significantly more, with prices rising to 5% above the
1989 average, but homes in Tokyo remained cheaper than they were in 1989. The cost of an
average home in Madrid rose by a further 2%, while prices in Frankfurt remained stable.
0169 201 4800
ieltstolinh.com
13
10 - The charts below compare the age structure of the populations of France and India
in 1984.
The two charts compare the populations of France and India in terms of age distribution
by gender in the year 1984.
It is clear that the population of India was younger than that of France in 1984, with a
noticeably larger proportion of people aged under 20. France, on the other hand, had a
significantly larger percentage of elderly inhabitants.
In India, close to 14% of people were aged 5 or under, and each five-year age bracket
above this contained an increasingly smaller proportion of the population. France’s
population, by contrast, was more evenly distributed across the age ranges, with similar
figures (around 7% to 8% of all people) for each five-year cohort between the ages of 0
and 40. Somewhere between 10% and 15% of all French people were aged 70 or older,
but the equivalent figure for India was only 2%.
Looking more closely at gender, there was a noticeably higher proportion of French
women than men in every cohort from age 50 upwards. For example, almost 3% of
French 70- to 75-year-olds were women, while just under 2% were men. No significant
gender differences can be seen on the Indian population chart.
0169 201 4800
ieltstolinh.com
14
II. Table
1 - The tables below give information about sales of Fairtrade*-labelled coffee and
bananas in 1999 and 2004 in five European countries.
The tables show the amount of money spent on Fairtrade coffee and bananas in two separate
years in the UK, Switzerland, Denmark, Belgium and Sweden.
It is clear that sales of Fairtrade coffee rose in all five European countries from 1999 to 2004,
but sales of Fairtrade bananas only went up in three out of the five countries. Overall, the UK
saw by far the highest levels of spending on the two products.
In 1999, Switzerland had the highest sales of Fairtrade coffee, at €3 million, while revenue from
Fairtrade bananas was highest in the UK, at €15 million. By 2004, however, sales of Fairtrade
coffee in the UK had risen to €20 million, and this was over three times higher than
Switzerland’s sales figure for Fairtrade coffee in that year. The year 2004 also saw dramatic
increases in the money spent on Fairtrade bananas in the UK and Switzerland, with revenues
rising by €32 million and €4.5 million respectively.
0169 201 4800
ieltstolinh.com
15
Sales of the two Fairtrade products were far lower in Denmark, Belgium and Sweden. Small
increases in sales of Fairtrade coffee can be seen, but revenue remained at €2 million or below
in all three countries in both years. Finally, it is noticeable that the money spent on Fairtrade
bananas actually fell in Belgium and Sweden.
2 - The table below shows the amount of waste production (in millions of tonnes) in six
different countries over a twenty-year period.
The chart compares the amounts of waste that were produced in six countries in the years
1980, 1990 and 2000.
In each of these years, the US produced more waste than Ireland, Japan, Korea, Poland and
Portugal combined. It is also noticeable that Korea was the only country that managed to reduce
its waste output by the year 2000.
Between 1980 and 2000, waste production in the US rose from 131 to 192 million tonnes, and
rising trends were also seen in Japan, Poland and Portugal. Japan’s waste output increased
from 28 to 53 million tonnes, while Poland and Portugal saw waste totals increase from 4 to 6.6
and from 2 to 5 million tonnes respectively.
The trends for Ireland and Korea were noticeably different from those described above. In
Ireland, waste production increased more than eightfold, from only 0.6 million tonnes in 1980 to
5 million tonnes in 2000. Korea, by contrast, cut its waste output by 12 million tonnes between
1990 and 2000.
0169 201 4800
ieltstolinh.com
16
3 - The table below shows changes in the numbers of residents cycling to work in
different areas of the UK between 2001 and 2011.
The table compares the numbers of people who cycled to work in twelve areas of the UK in the
years 2001 and 2011.
Overall, the number of UK commuters who travelled to work by bicycle rose considerably over
the 10-year period. Inner London had by far the highest number of cycling commuters in both
years.
In 2001, well over 43 thousand residents of inner London commuted by bicycle, and this figure
rose to more than 106 thousand in 2011, an increase of 144%. By contrast, although outer
London had the second highest number of cycling commuters in each year, the percentage
change, at only 45%, was the lowest of the twelve areas shown in the table.
Brighton and Hove saw the second biggest increase (109%) in the number of residents cycling
to work, but Bristol was the UK’s second city in terms of total numbers of cycling commuters,
with 8,108 in 2001 and 15,768 in 2011. Figures for the other eight areas were below the 10
thousand mark in both years.
0169 201 4800
ieltstolinh.com
17
4
The table compares the percentages of people using different functions of their mobile phones
between 2006 and 2010.
Throughout the period shown, the main reason why people used their mobile phones was to
make calls. However, there was a marked increase in the popularity of other mobile phone
features, particularly the Internet search feature.
In 2006, 100% of mobile phone owners used their phones to make calls, while the next most
popular functions were text messaging (73%) and taking photos (66%). By contrast, less than
20% of owners played games or music on their phones, and there were no figures for users
doing Internet searches or recording video.
Over the following 4 years, there was relatively little change in the figures for the top three
mobile phone features. However, the percentage of people using their phones to access the
Internet jumped to 41% in 2008 and then to 73% in 2010. There was also a significant rise in the
use of mobiles to play games and to record video, with figures reaching 41% and 35%
respectively in 2010.
0169 201 4800
ieltstolinh.com
18
5 - The table below gives information on consumer spending on different items in five
different countries in 2002.
Percentage of national consumer expenditure by category - 2002
The table shows percentages of consumer expenditure for three categories of products and
services in five countries in 2002.
It is clear that the largest proportion of consumer spending in each country went on food, drinks
and tobacco. On the other hand, the leisure/education category has the lowest percentages in
the table.
Out of the five countries, consumer spending on food, drinks and tobacco was noticeably higher
in Turkey, at 32.14%, and Ireland, at nearly 29%. The proportion of spending on leisure and
education was also highest in Turkey, at 4.35%, while expenditure on clothing and footwear was
significantly higher in Italy, at 9%, than in any of the other countries.
It can be seen that Sweden had the lowest percentages of national consumer expenditure for
food/drinks/tobacco and for clothing/footwear, at nearly 16% and just over 5% respectively.
Spain had slightly higher figures for these categories, but the lowest figure for leisure/education,
at only 1.98%.
0169 201 4800
ieltstolinh.com
19
6 - The table below shows the proportion of different categories of families living in
poverty in Australia in 1999.
The table gives information about poverty rates among six types of household in Australia in the
year 1999.
It is noticeable that levels of poverty were higher for single people than for couples, and people
with children were more likely to be poor than those without. Poverty rates were considerably
lower among elderly people.
Overall, 11% of Australians, or 1,837,000 people, were living in poverty in 1999. Aged people
were the least likely to be poor, with poverty levels of 6% and 4% for single aged people and
aged couples respectively.
Just over one fifth of single parents were living in poverty, whereas only 12% of parents living
with a partner were classed as poor. The same pattern can be seen for people with no children:
while 19% of single people in this group were living below the poverty line, the figure for couples
was much lower, at only 7%.
0169 201 4800
ieltstolinh.com
20
III. Pie chart
1
The charts compare Korea, Sweden and the UK in terms of the methods used in each country
to dispose of harmful waste.
It is clear that in both the UK and Sweden, the majority of dangerous waste products are buried
underground. By contrast, most hazardous materials in the Republic of Korea are recycled.
0169 201 4800
ieltstolinh.com
21
Looking at the information in more detail, we can see that 82% of the UK’s dangerous waste is
put into landfill sites. This disposal technique is used for 55% of the harmful waste in Sweden
and only 22% of similar waste in Korea. The latter country recycles 69% of hazardous materials,
which is far more than the other two nations.
While 25% of Sweden's dangerous waste is recycled, the UK does not recycle at all. Instead, it
dumps waste at sea or treats it chemically. These two methods are not employed in Korea or
Sweden, which favour incineration for 9% and 20% of dangerous waste respectively.
2 - The three pie charts below show the changes in annual spending by a particular UK
school in 1981, 1991 and 2001
0169 201 4800
ieltstolinh.com
22
The pie charts compare the expenditure of a school in the UK in three different years over a 20year period.
It is clear that teachers’ salaries made up the largest proportion of the school’s spending in all
three years (1981, 1991 and 2001). By contrast, insurance was the smallest cost in each year.
In 1981, 40% of the school’s budget went on teachers’ salaries. This figure rose to 50% in 1991,
but fell again by 5% in 2001. The proportion of spending on other workers’ wages fell steadily
over the 20-year period, from 28% of the budget in 1981 to only 15% in 2001.
Expenditure on insurance stood at only 2% of the total in 1981, but reached 8% in 2001. Finally,
the percentages for resources and furniture/equipment fluctuated. The figure for resources was
highest in 1991, at 20%, and the proportion of spending on furniture and equipment reached its
peak in 2001, at 23%.
3 - The pie charts below show units of electricity by fuel source in Australia and France
in 1980 and 2000
0169 201 4800
ieltstolinh.com
23
The pie charts compare the amount of electricity produced using five different sources of fuel in
two countries over two separate years.
Total electricity production increased dramatically from 1980 to 2000 in both Australia and
France. While the totals for both countries were similar, there were big differences in the fuel
sources used.
Coal was used to produce 50 of the total 100 units of electricity in Australia in 1980, rising to
130 out of 170 units in 2000. By contrast, nuclear power became the most important fuel source
in France in 2000, producing almost 75% of the country’s electricity.
Australia depended on hydro power for just under 25% of its electricity in both years, but the
amount of electricity produced using this type of power fell from 5 to only 2 units in France. Oil,
on the other hand, remained a relatively important fuel source in France, but its use declined in
Australia. Both countries relied on natural gas for electricity production significantly more in
1980 than in 2000.
4
0169 201 4800
ieltstolinh.com
24
The pie charts compare the proportions of people falling into three distinct age groups in Yemen
and Italy in two different years.
It is clear that Italy had the older population in the year 2000, and that the same is predicted for
the year 2050. The populations of both countries are expected to age over the fifty-year period.
In the year 2000, just over half of the population of Yemen was aged 14 or under, while most
Italians (61.6%) fell into the 15 to 59 age group, and only 14.3% were children under 15 years of
age. People aged 60 or over accounted for almost a quarter of the Italian population, but only
3.6% of the inhabitants of Yemen.
By 2050, the proportion of children under 15 is predicted to drop in both countries, most
noticeably in Yemen where the figure is expected to fall by 13.1%. On the other hand, the
figures for elderly people are expected to rise, by 2.1% in Yemen and a massive 18.2% in Italy.
Finally, it is anticipated that the 15 to 59 age group will grow by around 10% in Yemen, but
shrink by around 15% in Italy.
0169 201 4800
ieltstolinh.com
25
IV. Line graph
1 - The graph below shows the average number of UK commuters travelling each day by
car, bus or train between 1970 and 2030.
The line graph compares figures for daily travel by workers in the UK using three different forms
of transport over a period of 60 years.
It is clear that the car is by far the most popular means of transport for UK commuters
throughout the period shown. Also, while the numbers of people who use the car and train
increase gradually, the number of bus users falls steadily.
In 1970, around 5 million UK commuters travelled by car on a daily basis, while the bus and
train were used by about 4 million and 2 million people respectively. In the year 2000, the
number of those driving to work rose to 7 million and the number of commuting rail passengers
reached 3 million. However, there was a small drop of approximately 0.5 million in the number
of bus users.
By 2030, the number of people who commute by car is expected to reach almost 9 million, and
the number of train users is also predicted to rise, to nearly 5 million. By contrast, buses are
predicted to become a less popular choice, with only 3 million daily users.
0169 201 4800
ieltstolinh.com