Optimisation of sludge pretreatment by low frequency sonication under pressure = optimisation du prétraitement de boues par ultrasons à très basses fréquences et sous pression
Bạn đang xem bản rút gọn của tài liệu. Xem và tải ngay bản đầy đủ của tài liệu tại đây (7.07 MB, 200 trang )
1
2
2
2
2
2
En vue de l'obtention du
DOCTORAT DE L'UNIVERSITÉ DE TOULOUSE
Délivré par :
Institut National Polytechnique de Toulouse (INP Toulouse)
Discipline ou spécialité :
Génie des Procédés et de l'Environnement
Présentée et soutenue par :
M. NGOC TUAN LE
le lundi 9 décembre 2013
Titre :
OPTIMISATION OF SLUDGE PRETREATMENT BY LOW FREQUENCY
SONICATION UNDER PRESSURE.
Optimisation du prétraitement de boues par ultrasons à très basses
fréquences et sous pression.
Ecole doctorale :
Mécanique, Energétique, Génie civil, Procédés (MEGeP)
Unité de recherche :
Laboratoire de Génie Chimique (L.G.C.)
Directeur(s) de Thèse :
M. HENRI DELMAS
MME CARINE JULCOUR-LEBIGUE
Rapporteurs :
M. JEAN-YVES HIHN, UNIVERSITE DE BESANCON
Mme EVELYNE GONZE, INRA UNIVERSITE DE SAVOIE
Autre(s) membre(s) du jury :
M. IORDAN NIKOV, POLYTECH LILLE, Président
Mme HÉLÈNE CARRERE, INRA NARBONNE, Membre
M. PASCAL TIERCE, SINAPTEC, Membre
M. XAVIER LEFEBVRE, INSA TOULOUSE, Membre
Mme. LAURIE BARTHE, INP TOULOUSE, Invité
ACKNOWLEDGEMENTS
Apart from my efforts, the success of this work depends largely on the encouragement and
guidelines of many others.
Foremost, I would like to express my sincere gratitude to my supervisors Prof. Henri DELMAS
and Dr. Carine JULCOUR for the continuous support of my post-graduate work, for their
patience, motivation, enthusiasm, and immense knowledge. Their guidance helped me in all the
time of conducting the research and writing this thesis.
In addition, I would like to say a big thank you to the jury – Prof. Evelyne GONZE, Prof. Jean
Yves HIHN, Prof. Helène Carrère, Prof. Iordan NIKOV, Mr. Pascal TIERCE, Dr. Xavier
LEFEBVRE - for the precious time reading my thesis and valuable constructive comments.
I would like to acknowledge the financial support from the Ministry of Education and Training
of Vietnam and Institut National Polytechnique of Toulouse (France).
Besides, my sincere thanks also goes to Alexandrine BARTHE (Ginestous), Berthe
RATSIMBA, Laurie BARTHE, Ignace COGHE, Jean-Louis LABAT, Jean-Louis NADALIN,
Lahcen FARHI (LGC), Bernard GALY, Christine REY-ROUCH, Marie-line PERN, Sylvie
SCHETRITE (SAP, LGC), Xavier LEFEBVRE, Anil SHEWANI, Beatriz MORENTE, Delphine
DELAGNES (INSA), and SinapTec Company for their technical and analytical support.
I appreciate my friends: Ngoc Chau PHAM, Alain PHILIP, Fillipa VELICHKOVA, Imane,
BENHAMED, Benjamin BOISSIERE, Supaporn KHANGKHAM, Nicholas BRODU, Benjamin
BONFILS, and others for their help, encouragement, and insightful comments for the whole time
we were working together, and for all the fun we have had in the last three years.
Last but not the least, I would like to thank my parents LE Ut and NGUYEN Thi Chit for giving
birth to me and supporting me spiritually throughout my life, my brothers and sisters for
encouraging me, and my sweet love for everything.
LIST OF NOMENCLATURES AND ABBREVIATIONS
Label
Unit
Definition
A
m2
Surface area of the probe
AD
Anaerobic Digestion
BMP
Biochemical Methane Potential
BP
35 mm diameter probe (big probe)
c
m/s
Velocity of sound
CCOD
g/L
Colloidal Chemical Oxygen Demand
(concentration of supernatant liquid filtered between 0.2 μm and
1 μm pore size membrane)
Chemical oxygen demand
COD
CST
s
Capillary Suction Time
D[4,3]
µm
Volume moment mean particle diameter
DDCOD
%
Disintegration degree of sludge based on COD if not mentioned
otherwise
DDCOD = (SCOD – SCOD0) / (SCODNaOH – SCOD0) * 100 (%)
DeoxyriboNucleic Acid
DNA
DUS
(k)W/L
Ultrasonic density
DUS = PUS / V
Extracellular Polymeric Substances
EPS
ES
(k)J/kgTS
Specific energy input / Energy per total solid weight
ES = (PUS * t) / (V * TS)
FS
kHz
Sound frequency
γ
s-1
Shear rate
IUS
(k)W/Im2
Ultrasonic intensity
IUS = PUS / A
K
Pa.sn
Consistency coefficient (Herschel–Bulkley model)
µαpp
Pa.s
Apparent viscosity (τ / γ)
n
Flow behavior index (Herschel–Bulkley model)
OUR
Oxygen Utilization/Uptake Rate
P
bar (Pa)
Pressure in the bubble at its maximum size
Pa
bar (Pa)
Acoustic pressure
Pa = PA sin 2 π FS t
PA
bar (Pa)
Maximum amplitude of acoustic pressure
PA = (2 * IUS* c * ρ)1/2
Ph
bar (Pa)
Hydrostatic pressure
Pm
bar (Pa)
Total solution pressure at the moment of transient collapse
Particle Size Distribution
PSD
PUS
(k)W
Ultrasonic power input
PV
bar (Pa)
Vapour pressure of the liquid
ρ
kg/m3
Density of the medium
RiboNucleic Acid
RNA
SCOD
g/L
Soluble chemical oxygen demand in the supernatant after
treatment
(concentration of supernatant liquid filtered through 0.2 μm pore
size membrane)
SCOD0
g/L
Soluble chemical oxygen demand in the supernatant before
treatment
SCODNaOH
g/L
Soluble chemical oxygen demand after strong alkaline
disintegration of sludge
13 mm diameter probe (small probe)
SP
SRF
m/kg
Specific Resistance to Filtration
SS
g/L
Suspended Solids
STS
%
Solubilisation yield of Total Solids
SVS
%
Solubilisation yield of Volatile Solids
t
min
Sonication duration
τ
Pa
Shear stress
T
°C
Temperature
τ0
Pa
Yield stress
TCOD
g/L
Total Chemical Oxygen Demand
TDS
g/L
Total Dissolved Solids
TOC
g/L
Total organic carbon
TS
g/L
Total solids
UltraSonication / UltraSound irradiation
US
V
L
Volume of sludge
VS
g/L
Volatile solids
WAS
Waste Activated Sludge
WWTP
WasteWater Treatment Plants
TABLE OF CONTENTS
INTRODUCTION ......................................................................................................................... 1
CHAPTER 1 .................................................................................................................................. 3
LITERATURE REVIEW ............................................................................................................. 3
1.1. SLUDGE TYPES AND PROPERTIES ................................................................................................ 4
1.2. BRIEF BACKGROUND OF SONICATION ....................................................................................... 5
1.3. EVALUATION APPROACHES OF SLUDGE ULTRASONIC PRETREATMENT EFFICIENCY...
...................................................................................................................................................................... 9
1.3.1. Physical change-based evaluation of sludge US pretreatment efficiency ....................................12
1.3.1.1. Particle size reduction .........................................................................................................12
1.3.1.2. Sludge mass reduction or solubilisation ..............................................................................13
1.3.1.3. Dewaterability of sludge ......................................................................................................14
1.3.1.4. Settleability and Turbidity of sludge ....................................................................................15
1.3.1.5. Microscopic examination of sludge .....................................................................................16
1.3.2. Chemical change-based evaluation of sludge US pretreatment efficiency ..................................16
1.3.2.1. Degree of disintegration (DDCOD)........................................................................................17
1.3.2.2. Nucleic acid assessment .......................................................................................................17
1.3.2.3. Protein assessment ...............................................................................................................18
1.3.2.4. The release of ammonia and soluble organic nitrogen assessment .....................................18
1.3.2.5. TOC assessment ...................................................................................................................19
1.3.3. Biological change-based evaluation of sludge ultrasonic pretreatment efficiency ......................19
1.4. OPTIMIZATION OF ULTRASONIC PRETREATMENT OF SLUDGE ..........................................22
1.4.1. Ultrasonic frequency ....................................................................................................................22
1.4.2. Temperature .................................................................................................................................23
1.4.3. Hydrostatic Pressure.....................................................................................................................24
1.4.4. Energy aspects ..............................................................................................................................26
1.4.4.1. Ultrasonic power..................................................................................................................26
1.4.4.2. Ultrasonic intensity ..............................................................................................................27
1.4.4.3. Ultrasonic duration and specific energy input.....................................................................28
1.4.5. Sludge type, and total solid concentration of sludge ....................................................................28
1.4.6. pH of sludge .................................................................................................................................29
1.5. CONCLUSIONS ..................................................................................................................................30
CHAPTER 2 ................................................................................................................................ 31
RESEARCH METHODOLOGY............................................................................................... 31
2.1. INTRODUCTION ................................................................................................................................31
2.2. SLUDGE SAMPLES ...........................................................................................................................33
2.3. SONICATION APPARATUS .............................................................................................................37
2.4. ANALYTICAL METHODS ................................................................................................................41
2.4.1 Total solids (TS) and Volatile solids (VS) .....................................................................................41
2.4.2 Chemical oxygen demand (COD) and the degree of sludge disintegration (DDCOD) ...................42
2.4.3. Laser diffraction sizing analysis ...................................................................................................44
2.4.4. Microscope examination ..............................................................................................................45
2.4.5. Biochemical methane potential (BMP) ........................................................................................46
2.4.6. Rheology ......................................................................................................................................47
CHAPTER 3 ................................................................................................................................ 51
PRELIMINARY STUDY OF OPERATION PARAMETERS .............................................. 51
3.1. MATERIALS AND EXPERIMENTAL PROCEDURES ...................................................................51
3.1.1. Sludge samples .............................................................................................................................51
3.1.2. Experimental procedures ..............................................................................................................54
3.2. RESULTS AND DISCUSSION ..........................................................................................................54
3.2.1. DDCOD evolution...........................................................................................................................54
3.2.1.1. Effect of TS concentration ....................................................................................................55
3.2.1.2. Effect of stirrer speed ...........................................................................................................56
3.2.1.3. Effect of temperature rise under “adiabatic” conditions (without cooling) ........................57
3.2.1.4. Effect of sludge type .............................................................................................................59
3.2.1.5. Effect of alkaline addition prior to sonication .....................................................................61
3.2.2. Particle size reduction and evolution of sludge structures ...........................................................64
3.2.2.1 Analysis of laser diffraction measurements ..........................................................................64
3.2.2.2 Analysis of sludge particle images ........................................................................................71
3.2.3. Apparent viscosity and rheological behavior ...............................................................................74
3.2.4 Solubilisation of organic fractions ................................................................................................76
3.3. CONCLUSIONS ..................................................................................................................................78
CHAPTER 4 ................................................................................................................................ 79
EFFECT OF ULTRASOUND PARAMETERS ON SLUDGE PRETREATMENT BY
ISOTHERMAL SONICATION................................................................................................. 79
(POWER, INTENSITY, FREQUENCY) .................................................................................. 79
4.1. MATERIALS AND EXPERIMENTAL PROCEDURES ...................................................................80
4.1.1. Sludge samples .............................................................................................................................80
4.1.2. Experimental procedures ..............................................................................................................81
4.2. RESULTS AND DISCUSSION ..........................................................................................................82
4.2.1. Effect of PUS on sludge disintegration ..........................................................................................82
4.2.2 Effect of IUS on sludge disintegration ............................................................................................85
4.2.3. Effect of frequency on the efficacy of sludge sonication .............................................................88
4.2.4. Effect of sequential isothermal sonication on sludge disintegration ............................................90
4.3. CONCLUSIONS ..................................................................................................................................92
CHAPTER 5 ................................................................................................................................ 94
EFFECT OF HYDROSTATIC PRESSURE ............................................................................ 94
ON SLUDGE PRETREATMENT BY ISOTHERMAL SONICATION ............................... 94
5.1. MATERIALS AND EXPERIMENTAL PROCEDURES ...................................................................95
5.1.1. Sludge samples .............................................................................................................................95
5.1.2. Experimental procedures ..............................................................................................................96
5.2. RESULTS AND DISCUSSION ..........................................................................................................97
5.2.1. Effect of hydrostatic pressure on DDCOD for different ES values and sludge types .....................97
5.2.2. Effect of US power and intensity on the optimal pressure and subsequent DDCOD....................100
5.2.3. Effect of very low frequency on the optimum pressure and subsequent DDCOD........................103
5.3. CONCLUSIONS ................................................................................................................................105
CHAPTER 6 .............................................................................................................................. 106
OPTIMAL SONICATION FOR PRETREATMENT OF SLUDGE ................................... 106
6.1. MATERIALS AND EXPERIMENTAL PROCEDURES .................................................................107
6.1.1. Sludge samples ...........................................................................................................................107
6.1.2. Experimental procedures ............................................................................................................108
6.2. RESUTLS AND DISCUSSION ........................................................................................................108
6.2.1. Adiabatic sonication at atmospheric pressure ............................................................................108
6.2.2. Optimal pressure under adiabatic sonication..............................................................................112
6.2.3. Optimization of sludge sonication pretreatment ........................................................................113
6.2.4. Biochemical methane potential ..................................................................................................116
6.3. CONCLUSIONS ................................................................................................................................117
CONCLUSIONS........................................................................................................................ 119
REFERENCES .......................................................................................................................... 121
APPENDICES ........................................................................................................................... 134
APPENDIX 1 ............................................................................................................................................135
APPENDIX 2 ............................................................................................................................................136
APPENDIX 3 ............................................................................................................................................138
APPENDIX 4 ............................................................................................................................................143
APPENDIX 5 ............................................................................................................................................146
APPENDIX 6 ............................................................................................................................................148
APPENDIX 7 ............................................................................................................................................149
APPENDIX 8 ............................................................................................................................................150
LIST OF TABLES
Table 1.1: Expressions of US energy for sludge disintegration ................................................................... 8
Table 1.2: Full scale US applications ..........................................................................................................10
Table 2.1: Characteristics of sludge samples from first sampling (Oct. 2011) ...........................................34
Table 2.2: Characteristics of mixed sludge from second sampling (Jan. 2012) ..........................................34
Table 2.3: Characteristics of secondary sludge from third sampling (Oct. 2012) .......................................34
Table 2.4: Characteristics of secondary sludge from fourth sampling (Apr. 2013) ....................................34
Table 2.5: Limitations of the equipment .....................................................................................................40
Table 3.1: Characteristics of prepared samples from 1st sludge collection ................................................52
Table 3.2: Characteristics of prepared sample from 2nd sludge collection (mixed sludge)........................52
Table 3.3: Characteristics of prepared sample from 3rd sludge collection (secondary sludge) ..................53
Table 3.4: Characteristics of prepared sample from 4th sludge collection (secondary sludge) ..................53
Table 3.5: Alkaline pretreatment of mixed sludge (Table 3.2) at room temperature ..................................62
Table 3.6: Size parameters of raw and pretreated sludge samples (see legend of Fig. 3.14) ......................73
Table 3.7: Morphological parameters of raw and pretreated sludge samples (see legend of Fig. 3.14) .....74
Table 3.8: Apparent viscosity and parameters of Herschel-Bulkley model ................................................75
Table 3.9: Solubilisation of organic fractions .............................................................................................76
Table 4.1: Characteristics of prepared sample from 3rd sludge collection (secondary sludge, recalled from
Table 3.3) ....................................................................................................................................................80
Table 4.2: Characteristics of prepared sample from 4th sludge collection (secondary sludge, recalled from
Table 3.4) ....................................................................................................................................................80
Table 4.3: Test parameters and levels .........................................................................................................81
Table 5.1: Characteristics of prepared samples from 1st sludge collection (recalled from Table 3.1) ........95
Table 5.2: Characteristics of prepared sample from 3rd sludge collection (secondary sludge, recalled from
Table 3.3) ....................................................................................................................................................95
Table 5.3: Characteristics of prepared sample from 4th sludge collection (secondary sludge, recalled from
Table 3.4) ....................................................................................................................................................96
Table 5.4: Amplitude of acoustic pressure corresponding to each PUS and probe size ...............................97
Table 6.1: Characteristics of prepared sample from 3rd sludge collection (secondary sludge, recalled from
Table 3.3) ..................................................................................................................................................107
Table 6.2: Characteristics of prepared sample from 4th sludge collection (secondary sludge, recalled from
Table 3.4) ..................................................................................................................................................107
LIST OF FIGURES
Fig 1.1: Model of an activated sludge floc (Jorand et al., 1995) .................................................................. 5
Fig 1.2: Diagram of sonication range (Pilli et al., 2011) .............................................................................. 5
Fig 1.3: Formation and collapse process of a cavity .................................................................................... 7
Fig 1.4: Ultrasonic set-up (Kidak et al., 2009) ............................................................................................. 8
Fig 1.5: Integration of the US technology in WWTP (Ultrawaves GmbH - Water & Environmental
Technologies) ............................................................................................................................................... 9
Fig 1.6: Configurations of (a) Ultrawaves and (b) SonixTM reactor ..........................................................11
Fig 1.7: Relationship between sludge microbial activity and disintegration degree during ultrasonic
treatment (Li et al., 2009) ............................................................................................................................20
Fig 2.1: Outline of research plan .................................................................................................................32
Fig 2.2: Sampling points at Ginestous WWTP ............................................................................................33
Fig 2.3: Photos of sludge samples: ..............................................................................................................34
Fig 2.4: High pressure US reactor set-up.....................................................................................................37
Fig 2.5: (a) Closed and (b) opened cup-horn autoclave reactor ..................................................................38
Fig 2.6: Photos of the sonication devices: (1) 20 kHz, (2) 12 kHz, (3) 35 mm diameter probe, (4) 13 mm
diameter probe. ............................................................................................................................................39
Fig 2.7: NABERTHERM 30-3000 P330 furnace........................................................................................42
Fig 2.8: Equipment for COD measurement: (a) COD reactor, (b) Hach spectrophotometer ......................43
Fig 2.9: Malvern particle size analyzer (Mastersizer 2000, Malvern Inc.) .................................................45
Fig 2.10: Morphologi G3 equipment ...........................................................................................................46
Fig 2.11: Equipment for BMP tests: (a) sealed Pyrex bottle with sampling tube, (b) Heraeus oven, (c)
5890 series II gas chromatograph ................................................................................................................47
Fig 2.12: Flow curves of different fluids: (a) power law fluids, (b) Bingham plastic fluid ........................48
Fig 2.13: Rheometer AR 2000 (TA Instruments) .........................................................................................49
Fig 2.14: Rheological behavior of raw secondary sludge by Herschel–Bulkley model ..............................50
Fig 3.1: Effect of TS content on mixed sludge disintegration (DDCOD) vs. ES: PUS = 150 W, BP, FS = 20
kHz, TS = 28 g/L (other properties in Table 3.1), adiabatic condition, and atmospheric pressure .............55
Fig 3.2: Effect of stirrer speed on time-evolution of mixed sludge disintegration PUS = 150 W, BP, FS = 20
kHz, TS = 28 g/L (other properties in Table 3.1), T = 28±2°C, and atmospheric pressure .........................56
Fig 3.3: Effect of temperature profile* on time-evolution of sludge disintegration (DDCOD): PUS = 150 W,
BP, FS = 20 kHz, TS = 28 g/L, and atmospheric pressure. (a) Synthetic mixed sludge (Table 3.1), (b)
synthetic secondary sludge (Table 3.3). ......................................................................................................58
Fig 3.4: Effect of ES on US pretreatment efficacy of different sludge types (DDCOD based on SCODNaOH):
PUS = 150 W, BP, FS = 20 kHz, TS = 14 g/L (other properties in Table 3.1), and atmospheric pressure. (a)
T = 28±2°C and (b) adiabatic condition ......................................................................................................60
Fig 3.5: Effect of ES on US pretreatment efficacy of different sludge types with DDCOD based on TCOD*:
PUS = 150 W, BP, FS = 20 kHz, TS = 14 g/L (other properties in Table 3.1), and atmospheric pressure. (a)
T = 28±2°C and (b) adiabatic condition. .....................................................................................................61
Fig 3.6: Comparison of different methods for mixed sludge disintegration (TS = 28 g/L, other properties
in Table 3.2): FS = 20 kHz, PUS = 150 W, BP, sonication duration = 117 min, NaOH dose = 0-77
mgNaOH/gTS (holding time = 30 min), and atmospheric pressure. Final pH value after treatment is also
indicated on top of each corresponding bar .................................................................................................63
Fig 3.7: Mean particle (D[4,3]) size evolution of different types of sludge during US pretreatment: PUS =
150 W, BP, FS = 20 kHz, TS = 28 g/L (other properties in Table 3.1), and T = 28±2°C, atmospheric
pressure........................................................................................................................................................64
Fig 3.8: Evolution of particle size distribution of mixed sludge during US pretreatment: PUS = 150 W, BP,
FS = 20 kHz, TS = 28 g/L (other properties in Table 3.1), T = 28±2°C, and atmospheric pressure ............65
Fig 3.9: Mean particle size (D[4,3]) evolution of mixed sludge during the early stage of (alkali-) US
pretreatment: PUS = 150 W, BP, FS = 20 kHz, TS = 28 g/L (other properties in Table 3.2), T = 28±2°C,
and atmospheric pressure ............................................................................................................................66
Fig 3.10: Deconvolution of PSD of raw mixed sludge (Table 3.2) .............................................................67
Fig 3.11: Evolution of PSD of mixed sludge during short sonication: (a) contribution of each population
to PSD, (b) mean diameter of the populations (PUS = 150 W, BP, FS = 20 kHz, TS = 28 g/L (other
properties in Table 3.2), T = 28±2°C, and atmospheric pressure) ...............................................................68
Fig 3.12: Evolution of PSD of mixed sludge during short sonication after NaOH addition (40 mgNaOH/gTS):
(a) contribution of each population to PSD, (b) mean diameter of the populations (PUS = 150 W, BP, FS =
20 kHz, TS = 28 g/L (other properties in Table 3.2), T = 28±2°C, and atmospheric pressure) ...................69
Fig 3.13: Effect of short sonication time on mixed sludge disintegration: PUS = 150 W, BP, FS = 20 kHz,
TS = 28 g/L (other properties in Table 3.2), T = 28±2°C, and atmospheric pressure..................................71
Fig 3.14: Photographs of raw and pretreated secondary sludge (Table 3.3, 20 kHz, 1 bar): (a) Raw sludge
after defrosting (2.5×), (b) after 78 min of thermal hydrolysis up to 80oC (2.5×), (c) after 5 min of US
(150 W) + 73 min of thermal hydrolysis up to 80oC (2.5×), (d) after 78 min of adiabatic US (150 W) +
162 min of stirring (10×), (e) after 117 min of isothermal US 150 W (10×) ..............................................72
Fig 3.15: Apparent viscosity versus shear rate curves for raw and sonicated secondary sludge: PUS = 360
W, BP, FS = 20 kHz, TS = 28 g/L (other properties in Table 3.4), T = 28±2°C, and atmospheric pressure75
Fig 3.16: Effect of ES on SCOD/TCOD and CCOD/TCOD during US: PUS = 360 W, BP, FS = 20 kHz,
secondary sludge with TS = 28 g/L (other properties in Table 3.4), T = 28±2°C, and atmospheric pressure
.....................................................................................................................................................................77
Fig 4.1: Effect of ES and PUS on DDCOD: 20 kHz, TS = 28 g/L, T = 28±2°C, and atmospheric pressure: (a)
SP, secondary sludge (Table 4.1). (b) BP, secondary sludge (Table 4.1). (c) BP, mixed sludge (Table 3.1),
“limited PUS” generator (max.150 W) .........................................................................................................83
Fig 4.2: Evolution of secondary sludge mean particle size as a function of (a) high ES, (b) low ES and (c)
sonication time using different PUS and probe sizes: 20 kHz, T = 28±2°C, and atmospheric pressure .......85
Fig 4.3: Comparison of IUS (same PUS of 50W) and PUS (same probe) effects on DDCOD at different ES: TS
= 28 g/L, T = 28±2°C, and atmospheric pressure. (a) 20 kHz, secondary sludge (Table 4.1). (b) 12 kHz,
secondary sludge (Table 4.2).......................................................................................................................86
Fig 4.4: Effect of IUS (by changing PUS and sludge V proportionally with the same probe) on DDCOD
at different ES: 20 kHz, BP, DUS = 300 W/L, TS = 28 g/L (Table 4.2), T = 28±2°C, and atmospheric
pressure........................................................................................................................................................87
Fig 4.5: Effect of ES and sound frequency on sludge disintegration (DDCOD): BP, TS = 28 g/L, T =
28±2°C, and atmospheric pressure. (a) Secondary sludge given in Table 4.1. (b) Secondary sludge given
in Table 4.2. .................................................................................................................................................89
Fig 4. 6: Mean particle size reduction under sonication at different FS: PUS = 360 W, BP, TS = 28 g/L
(Table 4.2), T = 28±2°C, and atmospheric pressure....................................................................................90
Fig 4.7: Effect of isothermal sequential sonication on sludge disintegration: SP, ES = 35000 kJ/kgTS, 12
kHz, T = 28±2°C, and atmospheric pressure...............................................................................................91
Fig 4.8: Effect of isothermal sequential sonication on sludge disintegration: BP, ES = 35000 kJ/kgTS, 12
kHz, 1 and 3.25 bar of pressure ...................................................................................................................92
Fig 5.1: Effect of hydrostatic pressure on mixed sludge disintegration (DDCOD) for different final ES
values: PUS = 150 W, BP, FS = 20 kHz, TS = 28 g/L (Table 5.1), and T = 28±2°C. ...................................98
Fig 5.2: Effect of hydrostatic pressure on secondary sludge disintegration (DDCOD): PUS = 150 W, BP, ES
= 75000 kJ/kgTS, FS = 20 kHz, TS = 28 g/L (Table 5.1), and T = 28±2°C ..................................................99
Fig 5.3: Mean particle size evolution of different sludge type during US pretreatment (based on D[4,3]):
BP, PUS = 150 W, FS = 20 kHz, TS = 28 g/L (Table 5.1), and T = 28±2°C.................................................99
Fig 5.4: Effect of hydrostatic pressure on DDCOD of secondary sludge for different PUS and probe sizes (FS
= 20 kHz, ES = 50000 kJ/kgTS, T = 28°C - Table 5.2, and TS = 28 g/L): (a) 35 mm diameter probe (BP),
(b) 13 mm diameter probe (SP) and BP at same PUS .................................................................................100
Fig 5.5: Disintegration degree of secondary sludge as a function of ES at the optimal pressures of each
configuration (PUS, probe size): FS = 20 kHz, TS = 28 g/L - Table 5.2, and T = 28±2°C ........................101
Fig 5.6: Effect of ES, US intensity (at same PUS) and pressure on secondary sludge disintegration: FS = 20
kHz, TS = 28 g/L - Table 5.2, and T = 28±2°C .........................................................................................102
Fig 5.7: Effect of hydrostatic pressure on DDCOD of secondary sludge for different PUS: BP, ES = 35000
kJ/kgTS, FS = 12 kHz, TS = 28 g/L (Table 5.3), and T = 28°±2C ..............................................................103
Fig 5.8: Effect of ES and frequency on secondary sludge disintegration under optimum pressure (3.25
bar): PUS = 360 W, BP, T = 28°C, and TS = 28 g/L...................................................................................104
Fig 6.1: Effect of ES and PUS on DDCOD under adiabatic sonication (FS = 20 kHz, secondary sludge
solutions with TS = 28 g/L - Table 6.1, atmospheric pressure): (a) SP and (b) BP. Final temperatures of
adiabatic US are also given .......................................................................................................................109
Fig 6.2: Effect of temperature on DDCOD by isothermal US (20 kHz, PUS = 150 W, BP, secondary
sludge solutions with TS = 28 g/L – Table 6.2, and atmospheric pressure) and thermal hydrolysis. .......110
Fig 6.3 : Temperature evolutions for experiments with BP using “adiabatic” US at ES = 50000 kJ/kgTS
and stirring afterwards up to 240 min: FS = 20 kHz, secondary sludge solutions with TS = 28 g/L (Table
6.1), atmospheric pressure .........................................................................................................................111
Fig 6.4: Effect of ES and PUS on DDCOD under adiabatic US followed by stirring up to 240 min (same
conditions as in Fig. 6.3) ...........................................................................................................................111
Fig 6.5 : Effect of pressure on DDCOD under adiabatic sonication for different combinations of PUSprobe sizes: ES = 50000 kJ/kgTS, FS = 20 kHz, secondary sludge solutions with TS = 28 g/L (Table 6.1)
...................................................................................................................................................................112
Fig 6.6: Comparison of continuous and sequential sludge US disintegration at different pressures under
adiabatic conditions: BP, ES = 35000 kJ/kgTS, FS = 12 kHz, secondary sludge solutions with TS = 28
g/L (Table 6.2)...........................................................................................................................................114
Fig 6.7: Temperature evolutions of sequential sonication (same conditions as in Fig. 6.6) .....................115
Fig 6.8: BMP of pretreated sludge samples...............................................................................................116
INTRODUCTION
1. BACKGROUND OF THE PROBLEM
The activated sludge process is the most widely used biological treatment for eliminating organic
and nitrogen pollutants in domestic wastewater. At the end of the process, a large amount of
excess bacterial biomass (sludge) needs to be treated, e.g. more than a million tons of dry matter
per year in France. Therefore, sludge management is a major issue as it represents about 50-60%
of the total expense of wastewater treatment plants (WWTP) (Nowak, 2006; Banu et al., 2009).
Incineration, ocean discharge, land spreading, and composting are the most common sludge
disposal options used over the years, but no longer sustainable due to economic reasons or
negative impacts on environment. Therefore, anaerobic digestion (AD) has been applied as an
efficient and sustainable technology thanks to mass reduction, odor removal, pathogen decrease,
less energy use, and energy recovery in the form of methane (CH4). However, the first stage of
AD process, hydrolysis, is the rate-limiting step of microbial conversion and requires a
pretreatment that ruptures cell walls and facilitates the release of intracellular matters into the
aqueous phase.
There are some very popular techniques applied in sludge pretreatment, e.g. biological (aerobic
and anaerobic processes), mechanical (US pretreatment, lysis-centrifuge, liquid shear, grinding,
etc.), chemical (oxidation, alkali, acidic pretreatment, etc.), electrical methods, and thermal
hydrolysis (>100oC) (Carrère et al., 2010).
Pilli et al. (2011) reported in their review that ultrasonication (US) is a feasible and promising
mechanical disruption technique for sludge disintegration and microorganism lysis, with
improvement in sludge biodegradability (Khanal et al., 2007), increase in methane production
(Onyeche et al., 2002; Barber, 2005; Khanal et al., 2007), no need for chemical additives (Mao
et al., 2004), less sludge retention time (Tiehm et al., 1997), and sludge reduction (Onyeche et
al., 2002).
Many studies aiming at optimization of US efficiency have been conducted. However, there is
lack of researches on the individual and integrated effects of some key US parameters as well as
external conditions of sludge pretreatment, i.e. process conditions (stirrer speed, temperature,
pressure), US parameters (power -PUS, intensity -IUS, specific energy input -ES, and frequency FS), and sludge characteristics (sludge type, total solids TS concentration, sludge pH). The
objective of this work is therefore to optimize high-power low-frequency sonication pretreatment
1
of sludge, and especially to emphasize for the first time the effects of hydrostatic pressure and
frequency –down to audible range- which are expected to enhance sludge disintegration, to save
energy input, and to facilitate the anaerobic digestion. Sludge ultrasonic pretreatment is generally
assessed mainly based on disintegration degree (or solubilisation yield of chemical oxygen
demand). Here we also add examination of particle size reduction, morphology changes, and the
evolution of sludge viscosity.
2. ORGANIZATION OF THE STUDY
The Introductionpresents the background of the environmental problem due to sludge massive
production, and the potential use of ultrasound as sludge pretreatment. Literature review is
discussed in details in Chapter 1. In this chapter, sludge type is depicted first. Researches in
sludge US pretreatment field are collected and displayed in three main sections: brief background
of US pretreatment of sludge, approaches to assess its efficiency, and optimization efforts in
literature. Chapter 2 introduces Research methodology where outline of research plan, sludge
samples, sonication apparatus, and analytical methods are detailed. Findings of this work are
shown in the next chapters. Chapter 3 exhibits Preliminary study of operation parameters
whereat effects of solid concentration, sludge type, sludge pH (alkaline addition), stirrer speed,
and thermal effects are taken into consideration. In addition to COD solubilisation, the changes
of particle size distribution, morphology, and viscosity are investigated. Effect of ultrasound
parameters on sludge disintegration is presented in Chapter 4, including US power, intensity,
and frequency. For the first time Effect of hydrostatic pressure is taken into account and
reported in Chapter 5. This chapter aims at investigating the interaction between PUS, IUS, FS,
and pressure and their effects on isothermal sludge pretreatment. Optimal sonication
pretreatment of sludge is described in Chapter 6. Optimum conditions of PUS, IUS, FS, T,
pressure, TS, and sequential sonication are discussed. Long term AD runs of some pretreated
sludge are also carried out to quantify the effects of US pretreatment.
2
CHAPTER 1
LITERATURE REVIEW
Incineration, ocean discharge, land application, and composting are the common ways used for
sludge disposal over the years, but they are no longer sustainable due to high costs and/or
negative impacts on the environment. Therefore, anaerobic digestion (AD) of sludge has been
applied as an efficient and sustainable technology for sludge treatment, allowing mass reduction,
odor removal, pathogen decrease, and energy recovery in the form of methane.
AD of sludge is a complex and slow process requiring high retention time to convert degradable
organic compounds to CH4 and CO2 in the absence of oxygen through four stages: hydrolysis,
acidogenesis, acetogenesis, and methanogenesis. Hydrolysis is known as the rate-limiting step, in
which the intracellular biopolymers solubilize and convert to lower molecular weight
compounds. This low rate of microbial conversion requires a pretreatment of sludge which
ruptures the cell wall and facilitates the release of intracellular matter into the aqueous phase to
improve biodegradability and enhance AD.
There are some very popular techniques used in sludge pretreatment, such as biological, thermal,
mechanical, chemical, and electrical methods. Biological treatment provides a moderately better
performance over the mesophilic digestion with mild energy input. Mechanical methods (US
pretreatment, lysis centrifugation, liquid shear disruption, grinding, etc.) also provide a moderate
performance improvement with moderate electrical input. Meanwhile, thermal hydrolysis
(>100oC) provides a significant increase in performance with a substantial thermal energy
consumption. Chemical methods (oxidation, alkali, acidic pretreatment, etc.) are also applied in
sludge pretreatment (Carrère et al., 2010). Recent studies have taken intense electric fields into
account (Kopplow et al., 2004; Rittmann et al., 2008; Salerno et al., 2009; Keles et al., 2010;
Mahmoud et al., 2010; Pham, 2011; Rynkiewicz, 2011).
In their review, Pilli et al. (2011) claimed ultrasonic irradiation (US) to be a feasible and
promising mechanical disruption technique for sludge disintegration and microorganism lysis
according to the treatment time and power, equating to specific energy input (ES). Some positive
characteristics of this method are efficient sludge disintegration (Pilli et al., 2011), improvement
in biodegradability and bio-solid quality (Khanal et al., 2007), increase in biogas/methane
production (Onyeche et al., 2002; Barber et al., 2005; Khanal et al., 2007), no need for chemical
3
additives (Mao et al., 2004), less sludge retention time (Tiehm et al., 1997), and sludge reduction
(Onyeche et al., 2002).
1.1. SLUDGE TYPES AND PROPERTIES
Primary sludge is produced through the mechanical wastewater treatment process. It occurs
after the screen and the grit chamber and contains untreated wastewater contaminations. The
sludge amassing at the bottom of the primary clarifier is also called primary sludge. It is
decayable and must be stabilized before being disposed of (Liu and Liptak, 1999). The
composition of this sludge depends on the characteristics of the collecting area. Primary sludge is
easily biodegradable since it consists of more easily digestible carbohydrates and fats (faeces,
vegetables, fruits, textiles, paper, etc.). Biogas therefore is more easily produced from primary
sludge but the methane content of the gas is lower.
Activated sludge comes from the secondary wastewater treatment. In the secondary treatment,
different types of bacteria and microorganisms biodegrade the organic matter and consume
oxygen to live, grow and multiply. The resulting sludge from this process is called waste
activated sludge (WAS). Normally, a part of the WAS is returned back to the system (called return
activated sludge) and the remaining is removed at the bottom of the secondary clarifier (called
excess sludge or secondary sludge). Overall, the sludge has the same properties, but different
names regarding its usage. WAS consists largely of biological mass, i.e. proteins (30%),
carbohydrates (40%) and lipids (30%) in particulate form (Lin et al., 1999), as well as large
amount of pathogens. It causes odour problems and thus must be stabilized. Besides, activated
sludge is more difficult to digest than primary sludge.
Activated sludge floc is a heterogeneous mixture of particles, microorganisms, colloids, organic
polymers and cations whose composition depends on the origins (Forster 1976; Urbain et al.,
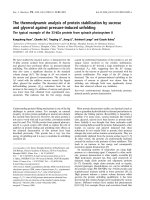
1993). Flocs have three structural levels (Fig. 1.1): microflocs, which are primarily particles of
2.5 μm in size, secondary particles (13 μm) linked together by exo-polymers and forming tertiary
structures having a mean diameter of 125 μm (Jorand et al.,1995; Chu et al., 2001).
4
Fig 1.1: Model of an activated sludge floc (Jorand et al., 1995)
Digested sludge is the residual product after AD of primary and activated sludge. The digested
sludge is reduced in mass, less odorous, and safer in the aspect of pathogens and easier
dewatered than the primary and activated sludge types (Liu and Liptak, 1999).
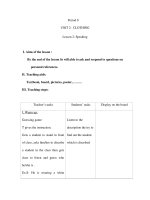
1.2. BRIEF BACKGROUND OF SONICATION
The diagram of sonication range is presented in Fig. 1.2
Fig 1.2: Diagram of sonication range (Pilli et al., 2011)
When an acoustic field is applied, the sonic vibrations create an acoustic pressure (Pa) which
must be considered to be additional to the ambient hydrostatic pressure (Ph) already present in
the medium:
Pa = PA sin 2 π FS t
where FS is the sound frequency and PA is the maximum pressure amplitude of the wave. The
intensity of the wave (I) is the energy transmitted per time unit and per surface unit of fluid:
5
I = PA 2 / (2 ρ c) = (ρ c / 2) (a ω)2
where ρ is the density of the medium, c is the velocity of sound in that medium, a is the
amplitude (half the height difference between a peak and a trough), and ω is the angular
frequency (= 2π FS).
When propagating in a solution, ultrasound waves generate compressions (they cause a positive
pressure on the liquid by pushing molecules together) and rarefactions (they cause a negative
pressure by pulling molecules one from each other). If a sufficiently large negative pressure is
applied during rarefaction, acoustic cavitation will take place.
It is now clearly stated that most of ultrasound outstanding effects are due to acoustic cavitation.
Acoustic cavitation is a very complex highly non-linear phenomenon which occurs at given
acoustic pressure conditions (needing rather high ultrasound intensity, > 1 W/cm2 in water at
room conditions). Micro-bubbles are generated from nuclei -favored by dissolved gas, wall
defects, and liquid impurities- during the low pressure half periods (bubble formation and
expansion). They may oscillate a few periods, undergoing a slow average growth due to the so
called “rectified diffusion” process (up to several µm) and suddenly, reaching a critical size, they
dramatically grow during the low pressure half period and collapse violently in a very short
fraction of the high pressure half period. Most often the bubble breaks up after the collapse point,
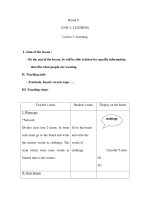
giving smaller bubbles ready to reproduce the same scenario: oscillatory growth, driven by
rectified diffusion, then sudden collapse (as schematized on Fig. 1.3). Such a fast collapse being
nearly adiabatic gives rise to extreme conditions inside and around the collapsing bubble.
Theoretical considerations by Noltingk and Neppiras (1950), Flynn (1964), Neppiras (1980), and
Lorimer and Mason (1987), assuming adiabatic collapse of the bubbles, allow for the calculation
of the maximal temperature (Tmax) and pressure (Pmax) within the bubble at the end of collapse
(bubble rebound):
where T is the ambient temperature, γ is the ratio of the specific heats of gas (or gas vapour)
mixture, P is the pressure in the bubble at its maximum size and is usually assumed to be equal
6
to the vapour pressure (PV) of the liquid. Pm is total solution pressure at the moment of transient
collapse (Pm = Ph + Pa).
Such models and experimental validations suggest that final collapse leads to a temperature as
high as 5000 K at the bubble center, a pressure of 500 bar, and a high radial velocity -up to the
sound speed- then shock waves at the bubble rebound. These cavitation characteristics have
different impacts on the sonicated media: high temperature peaks produce very active free
radicals (mainly OH• in aqueous media), giving the way to intense radical chemistry either
inside or at the interface of the cavitation bubble depending on the volatility of the target
dissolved molecules. On the other hand, high pressure, high velocity gradients, and shock waves
have mainly physical effects through very strong micro turbulence and intense local mixing,
increasing heat and mass transfer. These physical effects are even more efficient in multiphase
systems and especially on solid surfaces due to asymmetrical collapse with projection of a very
fast jet towards the solid close to cavitation bubbles. This is the main cause of ultrasonic cleaning
and also of most of ultrasonic solid processing, such as sludge disintegration.
Fig 1.3: Formation and collapse process of a cavity
When applied to solid suspension and especially for sludge treatment the power/energy may be
expressed in many ways as given in Table 1.1: specific energy input ES, US dose, US density,
and US intensity.
7