Accounting for vietnam wealth
Bạn đang xem bản rút gọn của tài liệu. Xem và tải ngay bản đầy đủ của tài liệu tại đây (644.58 KB, 48 trang )
CIEM
DoE
Accounting for Vietnam’s Wealth:
The Role of Natural Resources
September 2007
Research Team:
CIEM:
Vu Xuan Nguyet Hong, Nguyen Manh Hai, Ho Cong Hoa
Department of Economics, Copenhagen University:
Patricia Silva, Finn Tarp, Jørgen Birk Mortensen
Acknowledgements:
This study was prepared within the context of the CIEM DANIDA Collaborative Research Project
supported under the Poverty Reduction Grant. The financial support from DANIDA is gratefully
acknowledged. The group of authors would also like to express appreciation for comments and
suggestions received from a variety of seminars and workshops at CIEM in Hanoi. Particular thanks
are due to Hoang Xuan Co, Senior Lecturer at the Faculty of Environmental Sciences, Hanoi
University of Science. Nguyen The Chinh, Director of the Center for Environmental Economics and
Regional Development, Faculty of Environmental Economics and Management, Hanoi National
Economics University; and Phan Sy Hieu, forestry expert, Ministry of Agriculture and Rural
Development, for their detailed comments on the analysis carried out in this paper. We would also
like to thank Mr. Giovanni Ruta, Environment Department, World Bank, for his assistance in
providing some of the data used in the analysis of mineral rents.
2
Table of Contents
1. Introduction................................................................................................................................ 5
2. Methodology .............................................................................................................................. 7
Background ................................................................................................................................. 7
Model ......................................................................................................................................... 8
Data .......................................................................................................................................... 10
3. Vietnam’s Natural Resources Wealth ........................................................................................ 12
4. Mineral Resources..................................................................................................................... 15
Overview of Vietnam’s mineral resources ................................................................................. 15
Mineral Fuels ............................................................................................................................ 16
Oil ......................................................................................................................................... 16
Oil scenario analysis ............................................................................................................. 17
Natural gas ............................................................................................................................ 19
Coal ...................................................................................................................................... 20
Other Minerals .......................................................................................................................... 21
5. Land Resources ......................................................................................................................... 22
Overview of land resources ....................................................................................................... 22
Cropland Resources............................................................................................................... 23
Pastureland Resources ........................................................................................................... 25
6. Forest Resources ....................................................................................................................... 27
Overview of Vietnam’s forest resources .................................................................................... 27
Timber Resources ..................................................................................................................... 28
Timber scenario analysis ....................................................................................................... 30
Case study: Forestry Policy Analysis..................................................................................... 35
Non Timber Forest Resources ................................................................................................... 39
Protected Areas ......................................................................................................................... 41
7. Conclusion ................................................................................................................................ 43
References .................................................................................................................................... 46
3
Tables and Figures
Figure 1. Wealth across income levels……………………………………………………...………11
Figure 2. Natural capital composition by income level………...……...…………………....………12
Figure 3. Vietnam’s natural capital…………………...…………………………………...….…….13
Figure 4. Natural capital across East Asia and Pacific…………………………………………….13
Table 1. Wealth from mineral resources: oil…………………………………………………...…..18
Table 2. Wealth from mineral resources: natural gas and coal………….…………………...……19
Table 3. Agriculture output, revenue and rents for selected crops ...……...……………………….23
Table 4. Wealth from agriculture cropland…………………………………………………………25
Table 5. Wealth from timber: wood production patterns…………………………………………...29
Table 6. Wealth from timber: forest productivity and production patterns ...………………...……31
Table 7. Wealth from timber: extraction time horizon……………………………………………...32
Table 8. Policy Analysis: Increasing forest area by 3 million hectares…………………...………..34
Table 9. Policy Analysis: Sustainable yield forest management……………………………………36
4
1. Introduction
The Doi Moi economic reforms in Vietnam have resulted in a period of high GDP growth rate. In
the past decade, the Vietnamese economy maintained annual growth rates above 7 percent.
Significant poverty reduction has been accomplished during this period of high economic growth.
The poverty rate, measured by per capita consumption, fell from 58 percent in 1993 to just below
20 percent in 2004. Sustaining these impressive growth and poverty reduction achievements,
however, requires a long term perspective—one where the concept of sustainable development
plays a central role. As the World Bank noted, “growth will be illusory if it is based on mining soils
and depleting fisheries and forests” (World Bank, 2006).
Is Vietnam on a sustainable development path? Before we can answer this question, it is important
to understand, as David Pearce noted, that sustainable development can not be captured by an
income like concept, but instead needs to be measured by a wealth like concept (Maaler, 2007).
Thus, to gain a better understanding of the sustainability of a country’s development, what is
needed is a way to account for the value of all of its productive resources, physical, human and
natural capital, and how these change overtime. However, most standard measures of wealth
accumulation and savings ignore the depletion of, and damage to, natural resources such as mineral
deposits, land, and forests.
This study estimates the capital or stock value of Vietnam’s natural resources. Natural resources are
special economic goods because they are not produced. As a consequence, natural resources yield
economic profits—rents—if properly managed. These rents can be an important source of
development finance for poor countries (World Bank, 2006). The value of natural resources is
estimated based on the net present value of income flows that can be generated from these resources
(resource rents). Thus the capital value of natural resources is the based on the value an investor
would pay for the resource based on its income flow potential. Together with measures of the value
from Vietnam’s other important resources, human and produced capital, one could then assess
5
whether Vietnam is on a sustainable development path by monitoring the value of its wealth
overtime.
The report is organized as follows. Chapter 2 describes the methodology used in the study. It
reviews the background and motivation for the approach chosen to value natural resources, presents
the underlying model used in the valuation of natural resources and briefly discusses the data used
in the analysis. Chapter 3 presents an overview of the results and compares Vietnam’s natural
wealth with relevant estimates from other countries. Chapter 4 presents a detailed discussion of the
valuation of land resources, including specific data sources used and assumptions made. Similarly,
Chapters 5 and 6 present the detailed discussion of the valuation of minerals and forest resources.
Chapter 7 concludes.
6
2. Methodology
Background
The estimates of Vietnam’s natural resource wealth in this analysis take as a starting point the
methodology to value wealth employed in the “Where is the Wealth of Nations?” study, published
by the Word Bank in 2006. This publication estimated the value of produced, human, and natural
capital for nearly 120 countries in the world. However, Vietnam was not one of the included
countries, most likely due to data constraints. The present study thus aims to fill in the gap of
information regarding Vietnam’s natural wealth. In the Wealth of Nations study the various forms
of capital are considered “factors of production”, or wealth endowments, which economies use to
produce goods and services for the wellbeing of their citizens. These wealth endowments consist of
natural capital resources, such as agriculture and forest lands, as well as mineral deposits such as
oil, gas, coal, iron, chrome and other important subsoil assets; produced capital, the machinery,
buildings, equipment, and other infrastructure assets; and finally what is called “intangible assets”,
the stock of human capital, social capital, and quality of institutions.
Economic development, from this perspective, can then be viewed as the process by which
countries manage their portfolio of assets to expand the income flow generated by these assets.
Concerns regarding the depletion and degradation of natural resources in the historical course of
development of many economies motivated the undertaking of the wealth estimates. If economic
development is the result of a “running down” of natural capital assets, then future welfare is
compromised. Economic development can only be sustainable1 if assets are managed in a way that
total wealth is not decreasing.
1
The precise meaning of “sustainable” development is intensely debated among environmental and resource
economists. This has been captured in the debate between the notions of “weak” and “strong” sustainability criteria. The
first asserts that physical capital can be a perfect substitute for natural capital, thus consumption of natural resources can
be sustainable as long as investments in physical capital make up for the loss of the value of natural capital consumed.
The strong sustainability criteria, on the other hand, asserts that a minimum amount of natural capital must be conserved
and cannot be replaced by physical or human capital. For further details, see, Pearce and Atkinson (1995), Pearce et al
(1996), and Brekke (1997).
7
Model
Economic theory suggests that the value of an asset is given by the present discounted value of
income flows generated by the asset over time. This principle applies not only to financial and
produced assets, but to natural resource assets as well. But whereas markets to trade and value
financial and produced assets exist, the same is not generally true for most natural resources since
these are generally owned and managed by governments. Another important distinction is the fact
that the stock value of natural resources depends on prevalent economic conditions, such as the cost
of extraction, which in turn depend on technology and prices, among other things. With changing
technological and price conditions, some natural resource reserves which were previously not
profitable to explore (and thus had no economic value) may become so. Therefore the economically
relevant stock of natural resource assets is not a fixed concept determined by the physical quantity
of the resource available.
To estimate the value of a particular resource at time period t , the following model is used (as
specified in the World Bank (2006)):
(1)
t +T −1
Vt = ∑ i =t π i qi /(1 + r )i−t
where πi is the unit rent on the resource at time i and qi denotes the amount of resource produced, so
that πiqi gives the economic profit or total rent generated at time i, r is the social discount rate and T
is the lifetime of the resource. Estimating resource rents in each future time period up to time T
represents a difficult task. Therefore a simplification to the above equation is made so that future
rents are implicitly based on current rents. Assuming unit rents π grow at rate g, then:
.
(2)
π
r
=g=
1 + (ε − 1)(1 + r )T
π
where ε is the curvature of the cost function. Assuming the cost curve is isoelastic, then the
effective discount rate r*, is given by:
8
(3)
r* =
r−g
1+ g
and the value of the resource stock can be expressed as:
(4)
1
1
Vt = π t qt 1 + 1 −
T
r * (1 + r*)
Assuming a constant rate of growth for rents, equation (4), for example, has been used to value
subsoil mineral natural resources. However, the assumptions regarding future rents can be made
less or more restrictive depending on the type of resource in question, such that rents can be
assumed to be constant in the future or follow the path of optimal extraction. The assumptions used
for the different types of natural resources will be presented in the discussion of the valuation of the
particular resource.
An important parameter in the determination of the value of natural resource assets is the lifetime of
the resource, T. In the case of non-renewable natural resources, the time to exhaustion must be
determined. However, as noted earlier, the economically relevant amount of a resource depends not
just on physical quantities, but also on economic conditions. Estimating the time to exhaustion is
thus more complicated than simply estimating the reserves to production ratio. A simplification is
adopted and all resources are estimated to last up to 25 years, as is the case in the World Bank’s
wealth estimates.2 This timeframe is chosen for two reasons. First, for many non-renewable
resources considered in the analysis, the reserves to production ratios are between 20 and 30 years.3
Assuming a longer lifetime for these resources would necessitate increasing the time horizon for
future rents estimation. The level of uncertainty regarding future rent values would thus increase,
but because of the impacts of discounting the effects on results would be much dampened . Second,
this time horizon roughly represents a generation and as such can be used as representative of time
2
In some scenarios, the lifetime of the resource can be less than 20 years, if significant production increases are
assumed to occur.
3
Coal, bauxite, and iron are the exception. These are very abundant resources, with reserve production ratios of over
100 years.
9
frame for planning decisions. For these reasons, all resources, including renewable resources, are
estimated to last up to a maximum of 25 years.4
We express the estimated natural resources capital value as a percentage of total wealth and on a per
capita basis, as appropriate. Total wealth can be calculated as (World Bank, 2006):
(5)
∞
Wt = ∫ C ( s ) ⋅ e− r ( s−t ) ds
t
Where Wt is the total wealth, or capital, in year t; C(s) is consumption in year s; r is the social rate
of return from investments. It is assumed that the elasticity of consumption is one and that
consumption grows a constant rate, which is a function of the pure rate of time preference (assumed
to be 1.5). To take into account the volatility of consumption measures, we average out, in constant
dollars, Vietnam’s 3 most recent values of the per capita GNI. The time horizon is set to 25 years,
as discussed earlier. This gives us a total wealth figure, in present value terms, of US$9,909 per
person.
Data
Natural resource wealth is estimated based on the rents from subsoil mineral resources (energy and
mineral resources), forest resources (timber, non-timber forest products, and protected areas) and
land resources (agriculture cropland and pasture land devoted to livestock production). The World
Bank analysis seeks to make comparisons across countries and therefore estimates the value of a
representative basket of valuable natural resources belonging to each of these categories.5 Not all of
the natural resources assets chosen will be relevant for any given country, and some important
natural assets for a particular country may also not be included.
4
Renewable resources can in principle be exploited indefinitely, if sustainably managed. However, most renewable
resources are not managed sustainable, particularly not in poor developing countries. Also, assuming a fixed lifetime for
renewable resources makes comparisons between resources more meaningful. Given the uncertainties regarding future
rent and the effects of discounting future benefits, little would be gained in terms of precision by extending the time
horizon for renewable resources.
5
Natural resources included in the World Bank analysis are as follows. Subsoil assets are: oil, natural gas, coal, bauxite,
copper, gold, iron, lead, nickel, phosphate rocks, silver, tin, and zinc. Timber products include roundwood and
fuelwood. Cropland values are based on value for the following crops: maize, rice, wheat, bananas, apples grapes,
oranges, soybean, and coffee. Pasture land values are based on value of beef, lamb, milk, and wool production. Only
some of these assets will be relevant for any given country.
10
For the purpose of this analysis, the most relevant natural resources for Vietnam were considered
and chosen accordingly. Therefore in some of the natural resource categories, such as minerals,
agriculture cropland, and pasture land, the resources considered differ from the resources valued in
the World Bank analysis. In addition, although we follow the same approach and methods as in the
World Bank study, in some instances we make different assumptions for the valuation of specific
resources. By making these changes, the analysis better reflects the actual conditions for some of
the important natural resources of Vietnam. Direct comparison of natural resource wealth values
between Vietnam and other countries, therefore, must be done with care and take these differences
into account. It is also important to note that our study estimates natural resources values for
Vietnam using more recent data (up to 2005) than the World Bank study. Thus our valuation of
natural resources value takes into account some of the developing trends in natural resources prices,
particular the rising price for some mineral (oil, gas and coal) and food crops since 2000.
For most natural resources valued, the basic data needs for estimation of current rents are: quantity
of the resources produced or extracted, price of the resources, and cost of production. World prices
are used to value the resources, since these prices reflect the opportunity costs of the resources
consumed domestically. Production costs are based on local costs of production, to the extent that
such data is available. If no local production cost data is available for a specific resource, the
analysis uses cost estimates obtained from a survey of literature, giving preference to cost estimates
of similar countries in the region. A detailed discussion of how each resource was valued and data
sources used is presented in the later chapters. Next we present an overview of the main results of
the analysis.
11
3. Vietnam’s Natural Resources Wealth
Before we examine Vietnam’s natural resource wealth, it is useful to begin with an overview of
how natural resource wealth is distributed among countries at different levels of development.
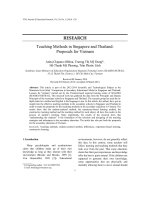
Figure 1 shows the share of wealth among natural capital, produced capital and intangible capital
across countries at different income levels.
Source: World Bank, 2006
Natural capital represents a larger share of wealth for low income countries. Although natural
capital shares fall as income increases, because total wealth increases with higher income levels, the
total value of natural resources increases as income increases. Produced capital shares remain
relatively constant across income groups, whereas the share of intangible capital increases with
income. In our estimates of natural capital wealth for Vietnam, natural capital accounts for 27
percent of total wealth, very similar to the share of natural capital for low income countries, the
income group Vietnam belongs to according to the World Bank classification system.
12
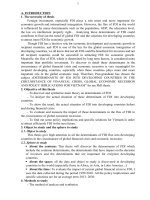
Next we consider how natural capital wealth is distributed among the different types of natural
resources for countries at different income levels. Figure 2 shows that for low income countries land
resources (agriculture and pasture land) account for the largest share of natural wealth. As countries
develop, the share of land resources in natural capital wealth tends to fall, as the share of value from
mineral resources increases.
Source: World Bank, 2006
Figure 3 presents our estimates of natural resource wealth for Vietnam, using the same broad
categories of natural resources as the World Bank studies. Although there are differences in our
calculations,6 at the broad level, the results suggest Vietnam’s natural resources wealth composition
is somewhere in between that of low income countries and middle income countries. The share of
land wealth in natural capital wealth is somewhat lower than lower income countries, whereas the
share of mineral resources is somewhat higher than middle income countries. The latter is probably
a reflection of higher mineral prices since 2000, which is incorporated into our analysis, but not the
World Bank’s analysis. The detailed calculations of the components of natural resource wealth are
presented in the chapters that follow.
6
Note that because we make different assumptions in the estimations, sometimes use different resources, and value
resources at different time period, the results are not directly comparable to World Bank’s estimates for other countries.
13
Source: Author’s own calculations.
We also compare Vietnam’s natural wealth composition to that of other countries in the East Asia
and Pacific region. Figure 4 shows that natural capital composition varies significantly among
countries in East Asia. Mineral wealth represents the most important natural resource for Malaysia
and Indonesia, whereas agriculture land is generally the most important natural resource for the
other countries. For Vietnam, as shown above, agriculture land and minerals account for
approximately the same share of total natural wealth.
14
Source: World Bank, 2006.
4. Mineral Resources
Overview of Vietnam’s mineral resources
Vietnam is well endowed with a wide variety of mineral resources. Among the most important
mineral resources are phosphates, bauxites, oil, coal, gold, copper, zinc, tin, chromite, manganese,
and titanium. Some metallic minerals, such as copper, zinc, tin, and gold, have been mined since the
Bronze age. The exploration of other mineral resources, such as oil and gas, has taken place mostly
since the country’s independence and reunification, when many important deposits have been
discovered and exploration activities boosted (Kusnir, 2000). Vietnam is one of the world’s largest
producer of anthracite (hard coal) and the sixth largest producer of crude oil in the Asia Pacific
region. However, most of Vietnam’s mineral resources remain largely unexploited—with only 3
resources, oil, gas, and coal, accounting for approximately 90 percent of output value from the
mining and quarrying sector, but only 5.75 percent of GDP (Wu, 2006). The lack of infrastructure,
modern mining equipment, and technology have been attributed as factors influencing the
development of the mineral sector.
15
Despite its rich mineral endowments and being a major oil producer in Asia, Vietnam is a net
mineral importer. Most of the crude oil output is exported, accounting for 21 percent of total exports
in 2006 (Wu, 2006). Vietnam imports refined oil, since the country lacks refining capacity. The first
oil refining facility is expected to be operational in 2009 and will reduce Vietnam’s reliance on
imported refined oil products. (EIA, 2007). Along with refined oil, iron and steel products are the
main minerals imported, accounting for 21.4 percent of imports in 2006.
The mining and quarrying sector has long been dominated by state owned companies, which
accounted for more than half of the companies operating in the sector. All oil production is carried
out by the national company itself, PetroVietnam, or through production sharing contracts or joint
ventures in which the PetroVietnam has an equity stake. Recent reorganization of the institutions
responsible for the mining sector and revisions to the mining law and petroleum law regulations
have aimed at opening up the way for increasing involvement of private companies, both foreign
and domestic, in the development of the sector. However, a number of concerns for investors
remain, such as requirements of infrastructure upgrading, no exclusive mining rights awarded with
exploration licences, a separate processing license for processing minerals, and the possibility of
restriction or banning of specific mineral for exports at any time (Truong, 2007).
Mineral Fuels
We begin the analysis with mineral fuels, mostly oil, coal, and natural gas, as these are the most
important minerals currently being exploited in Vietnam.
Oil
Crude oil production peaked at 400,000 barrels a day in 2004, but has declined slightly as a result of
declining output at mature oil fields. However, recent discoveries and new projects developing are
expected to boost Vietnam’s oil production, despite the decline from maturing oil fields. Analysts
expected production will surpass the 400,000 barrel peak in the future years (EIA, 2007). Estimates
of Vietnam’s proven oil reserves vary from as low as 600 million barrels to as much as 3 billion
barrels. PetroVietnam believes the country has substantial oil reserves yet to be found and thus with
continued exploration and discovery of offshore oil fields current output levels could be extended
16
well into the future. However, to reflect the uncertainty of reserves, we also present results where
current oil output levels can only be maintained for a 15 year time period.
The net present value of all natural resources depends crucially on how prices for these resources
develop overtime. In the case oil, the volatility of prices is particularly important. Over the last few
years, the price of oil has increased considerably. From 2000 to 2006, the price of oil more than
doubled from US$28.2 to US$64.3 per barrel (World Bank, 2007). Despite the increasing oil prices,
many analysts predicted that in 2008 oil prices would fall back to around US$55 a barrel. Instead,
by mid 2008, the oil price had already surpassed US$130 a barrel. Due to the difficulties inherent in
predicting future price trends for volatile commodities such as oil, the approach adopted in this
analysis simply focuses on rent values and how these grow overtime.7
The analysis of oil wealth is based on average prices, production, and cost figures for the 2000 to
2005 time period. Prices were obtained from the World Bank’s Global Economic Prospects Report
(2007). Production output was obtained from Vietnamese national statistics sources and confirmed
by comparing to published international production statistics, as reported by the International
Energy Association and others. Production cost figure were obtained from the World Bank (Bolt et
al, 2002). Production costs are based on point estimates and adjusted to an annual basis based on
US GDP deflators (but are assumed to remain constant, in real terms, overtime). In the cost of
production estimation, when estimates of oil extraction costs are not available for a given country, a
surrogate country’s cost are then chosen. This choice is made based on geographical proximity and
similarity of the ratio of offshore drilling. In the case of Vietnam, for which own oil extraction costs
were not available, Malaysia is the closest surrogate, which also has a substantial share of oil
production from offshore facilities, and its costs are therefore used in the estimation of production
costs. The present value of oil wealth in Vietnam is thus estimated at US$942 per capita, accounting
for approximately 80 percent of total mineral wealth.
Oil scenario analysis
7
Non renewable resources rents are assumed to grow at a constant rate, as specified in equation 2 above. Further, it is
assumed that the curvature of the cost curve, ε, equals 1.15.
17
Because oil wealth represents such as large share of total mineral wealth, we also carry out some
alternative scenario analysis, where we vary some of the assumptions made above. First, we assume
that no low oil discoveries which would only allow current production levels to last for 15 years,
instead of 25 years as in the scenario above. In this case, the oil wealth amounts to US$596 per
capita. This would also decrease total mineral wealth, and thus the share of oil in total mineral
wealth would also fall to around 70 percent. Second, we consider at higher base price for oil in the
calculation of rents. The average oil price between 2000 and 2005 was US$33 a barrel. However,
by 2006, oil prices were close to double that price. If we base our estimates of oil wealth on 2006
prices, then per capita oil wealth increases to US$1,289, if oil reserves last for 15 years, or
US$1,748, if oil reserves last for 25 years.
18
Table 1. Wealth from mineral resources: oil
Base Scenario
Sensitivity Analysis
Production volume
Price
Time to exhaustion
17 million tons
US$241/ton
25
17 million tons
US$482/ton
25
17 million tons
US$241/ton
15
17 million tons
US$482/ton
15
Wealth per capita
942
1,748
596
1,289
Wealth ratio relative
1.85
0.63
1.37
to base scenario
Note: Production volume and price in the base scenario are average values over 2000 to 2005
Natural gas
Natural gas production in Vietnam has increased rapidly since the early 2000’s—with production
quadrupling between 2000 and 2005 (Truong, 2007). A large fraction of natural gas produced is
consumed domestically, to fuel electric power plants (Wu, 2006). Conservative estimates put
proven natural gas reserves at around 190 billion cubic meters (Oil and Gas Journal, 2006). As with
oil, further exploration and discoveries could increase proven reserves considerably. If so, natural
gas would play an important role in Vietnam’s development, meeting its growing energy needs.
To estimate the value of natural gas wealth in Vietnam, we use price and cost data obtained from
the World Bank. The price data is based on several sources, such as the Global Commodity Markets
and the Statistical Review of World Energy (Bolt et al, 2002). Cost data is estimated in a similar
manner as described above for oil. We assume a time horizon of 25 years. Production volumes were
obtained from national statistics and confirmed with international sources. Natural gas wealth is
thus estimated at US$113 per capita—or about 10 percent of total mineral wealth in the base case
scenario. Given the rapid development in the natural gas industry in Vietnam in the recent couple of
years, we also estimate a high production volume scenario. In the base case scenario, production
volumes (as well as price and cost data) are averaged over the 2000 to 2005 time period to smooth
volatility in natural gas markets. However, when we consider only 2005 as the base year for
estimation, then the natural wealth from natural gas more than doubles to US$257 per capita.
19
Coal
Coal is the second most important mineral fuel produced in Vietnam. It is the main fuel used in
thermal power plants and in manufacturing, as well as a cooking fuel for urban and rural
populations. Coal is also an important export commodity. Vietnamese anthracite coal accounts for
about a third of total anthracite coal traded in the world. Japan and Western Europe are the main
importers of Vietnamese coal, which has high heat content and low ash, nitrogen, phosphorous, and
sulphur content, thus meeting strict environmental protection rules in these countries. Most of the
mining, distribution, and export of coal is controlled by the Vietnamese National Coal Corporation,
Vinacol (Wu, 2006). Between 2002 and 2005, coal output doubled from 16 Mts to 32 Mts and
demand is expected to grow strongly, for both internal use and for exports. In fact, it is estimated to
that Vietnam would start importing coal as early as 2015 (VietnamNet, 2006).
As with oil and natural gas, price and cost data used in the estimation of coal wealth is obtained
from the World Bank. Production volumes are from national statistics. The base line estimated
value of coal is US$115 per capita. As with other mineral fuels, the trends over the last five years
show prices increasing considerably. Average coal prices have doubled between 2001 and 2005.
Thus, given strong demand and likely price scenarios, we also consider a high price high production
volume scenario for coal, which takes 2005 prices and values as basis of future rents. In this high
price and volume scenario, coal wealth triples in value to US$305 per capita.
Table 2. Wealth from mineral resources: natural gas and coal
Natural gas
Coal (anthracite)
Production volume
Price
Time to exhaustion
127,000 TJ
US$4,025/ton
20
241,000 TJ
US$6,000/ton
20
20 million ton
US$53/ton
20
32 million ton
US$81/ton
20
Wealth per capita
113
257
115
305
Wealth ratio relative
2.27
2.65
to base scenario
Note: Production volume and price in the base scenario are average values over 2000 to 2005
20
Other Minerals
The analysis of mineral wealth also included other important minerals in Vietnam, such as
chromium, iron, lead, copper, tin, zinc and phosphate. However, the results show that these
minerals make little or no contribution to natural wealth. In most cases, the results are in the order
of only a few dollars per capita. We therefore do not present the detailed results for these minerals.
One possible reason for the low values obtained could be that costs of extraction are overestimated.
In the absence of cost of extraction data for Vietnam, we must use international cost data from other
countries, which may not be as representative of the geographical and social economic conditions of
Vietnam. Also, we sometimes only have a few reference years upon which to base the estimates of
extraction costs and how they change overtime. The uncertainty surrounding the cost estimates is
therefore high. On the demand side, many of these minerals have alternative substitutes, meaning
they are less scarce, which will tend to result in lower demand and lower prices overtime.
However, it is worth noting that the outlook for the mining sector in Vietnam is one of continued
growth. Although oil, gas, and coal will continue to be the most important mineral resources, the
expansion of mining for ferrous, nonferrous, and industrial minerals is also expected (Wu, 2006).
New discoveries and high levels of investment in the sector suggest that wealth from other mineral
resources is likely to increase and become more significant in the future. Therefore it is important
that Vietnam manage these resources rents sustainably, in order to ensure wealth is not diminished.
The estimated mineral resource rents generated and accrued should thus be compared, and how
these resource rents are spent tracked. It is also important to recognize these rents are finite, due to
the non-renewable nature of mineral resources.
21
5. Land Resources
Overview of land resources
In the 1990’s Vietnam experienced a period of high growth in the agriculture sector. Food
production increased from 21.5 million tons in 1990 to 34.2 million tons in 1999—equivalent to an
average growth of about 5 percent a year. Some industrial food crops saw even stronger
development, with recent growth rates as high as 10 percent a year. Rice, however, remains the
most important agriculture product, accounting for 90 percent of total food production (Ministry of
Agriculture and Rural Development). With food production growing at a faster rate than population
growth, Vietnam achieved not only food self sufficiency, but also became a leading exporter of
crops such as rice, coffee, rubber and black pepper. Export turn over of agriculture products reached
US$4 billion in 2004 (Ministry to Foreign Affairs, 2005). This development in the agriculture
sector followed, to some extent, from the economic reforms during renovation period. This resulted
in a series of reforms in the agriculture sector, such as the allocation land to farm households,
improvement of farmer’s incentives and access to markets, among other things.
In addition to food and industrial crops, Vietnam also experienced high growth in vegetable and
fruit production. More land has been allocated to the cultivation of these high value crops. The
livestock sector also experienced significant development, increasing per capita meat consumption
from 15 kg in 1990 to 22.4 kg in 1999. The increases in livestock production came primarily from
the growth of pig and poultry herds, which increased an average of 5 and 6 per cent a year,
respectively. Productivity in livestock production also improved during the time period, particularly
for pigs (Ministry of Agriculture and Rural Development).
In this chapter we estimate the value of land resources allocated to agriculture and livestock
production. This is based on the value of crops and livestock produced, rather than land prices, as
land price data are often not available or unreliable due to distortions in land markets. We depart
from the World Bank Wealth of Nation’s methodology, to the extent that we consider the most
important crops and livestock relevant for Vietnam. This is particularly important in the case of
22
livestock production, where the most important livestock resources for Vietnam, pigs and chicken,
are not included in the World Bank’s estimation of pasture land values. The crops included in the
analysis are listed in Table 3.
Cropland Resources
Land values are estimated based on the present discounted value of land rents, which are the
difference between market value of output agricultural crops and crop specific production costs. We
base the value of agricultural crop products at world prices8, whereas crop production costs are
based on local costs. The agricultural crops used to obtain land values are chosen from Vietnam’s
20 most important agricultural crops, as measured in terms of value and also in terms of land
allocation. The crops chosen for the analysis are: paddy rice, coffee, peppers, cassava, maize,
rubber, bananas, orange, sweet potatoes, tea, and pineapple.
For each crop, the amount of land of area cultivated, production output, and production costs were
obtained from Vietnamese production statistics, as well as a number of other Vietnamese sources.
The average amount of land cultivated and total crop output produced between 2002 and 2005 was
used in order to smooth out normal short term production variations. Using local production costs
estimates and local prices, we estimate the rental rate for each type of crop. The crop output was
valued using average unit export value prices from 2002 to 2005, obtained from the FAO core
database, FAOSTAT.9 The average crop output and crop values are then used to calculate average
revenues for each crop. Using crop revenues, crop rental rates, and area cultivated, we can then
calculate per hectare land rents for each type of crop. These are summarized below in Table 3.
8
World market prices used to value crops do not include transportation costs, which can affect the price received by
producers in local markets.
9
In cases where there was substantial difference between local prices and unit export prices (ie, more than 50% price
difference), we use an average of both prices. This was the case for cassava, tea, and pineapples.
23
Table 3. Agriculture output, revenue and rents for selected crops
Crop
Land Area
(1000 ha)
Paddy
7,411
Rice
Maize
961
Coffee
507
Rubber
464
Cassava
400
Sweet
205
Potatoes
Tea
118
Bananas
105
Orange
53
Peppers
50
Pineapple
34
Source: Author’s own calculations
Output
(1000 tons)
Revenue
(1000 $)
Average yearly
land Rent
( $/ha)
394
35,365
6,482,036
3,321
829
422
6,000
1,538
472,378
646,258
489,634
683,350
716,222
177
381
337
588
105
514
1,365
519
89
413
504,036
233,074
264,716
127,425
273,897
1,022
930
2,081
753
1,503
Rice is the main agriculture crop produced in Vietnam. Table 1 shows that rice accounts for about
two thirds of land area cultivated and about 60 percent of estimated total agricultural value
generated. The estimated land rent for rice is $394 per hectare. The overall land rent, of $393 per
hectare, is calculated as the weighted average (by cultivated area) of the rents from all crops and
used to project future land rents. The importance of rice in estimating land rents is thus reflected in
the average land rent. Some of the highest land rents are generated by pineapples, oranges, and tea.
Land rents can vary for different crops, reflecting different crop’s suitability given local differences
in climatic and soil conditions. In the case of some crops, land rents may also be partly driven by
the price chosen to value the crop. Therefore, where international and local prices differed
substantially (i.e., by more than 50%), we use an average of export and local prices to diminish
potential biases in land rent values.
In estimating the development of future land rents from crop cultivation, we need to consider the
amount of land area cultivated and likely developments in agriculture technology that impact
productivity. The FAO estimates the amount of arable land in Vietnam is about 11 million hectares.
The total land area accounted for by the crops considered in this analysis is about 10.5 million
hectares. We assume the remaining 0.5 million hectares of cultivated area generate average rents.
24
Area allocated to crop cultivation is assumed to be constant. Productivity is assumed to grow at a
rate of 1.94 percent for 20 years, and for the remaining 5 years it stays constant. These follow the
assumptions used in the Wealth of Nations analysis (World Bank, 2006). The present value of
cropland rents over the 25 year period was discounted using a 4 percent social discount rate. The
per capita wealth from crop land resources is thus estimated at US$982 per capita (Table 4).
Next Table 4 considers various alternative scenarios, where agricultural productivity growth is not
as high—namely 0.97 and 0.07 percent growth per year. The moderate growth scenario could
represent a case where, for example, continuing land degradation may affect agriculture
productivity in the future. In such a scenario, the per capita wealth falls to US$1.027 per capita.
Assuming a low growth scenario, where growth is minimal at 0.07 percent per year, per capita
wealth falls to $940 per capita. It is important to note that in these alternative scenarios, the impact
of productivity growth affects total rent, rather than output directly. Thus the impact on output is
moderated by constant prices and vice versa. We also consider a scenario where we assume
doubling of average land rents. This could be the case, for example, if farmers are able to improve
efficiency or switch production to higher value crops. This may or may not be a feasible scenario
for Vietnam, given existing priorities given to rice production and potential limitations of quality of
agriculture products for export markets. But it highlights the potential from adoption of high value
crops (where suitable) and from improvements in quality standards and access to export markets.
The simulations show that if average agriculture rents could be doubled, then wealth per capita from
crop land resources would also double.
Pastureland Resources
The value of pasture land is estimated following the same approach outlined above for cropland.
The analysis considers the returns to land from production of beef, chicken, pig, buffalo meat, and
fresh milk. Production costs for animal production in Vietnam were difficult to obtain, therefore we
use the World Bank estimated cost of production of 55 percent of revenues. This implies a rental
rate of 45 percent. The value of output is based on international prices obtained from the same
FAOSTAT core price database discussed above. In case export prices were not available, such as in
the case of fresh milk, import prices were used instead. As in the case of cropland, we assume the
amount of land devoted stays constant in future years. However, because livestock is often raised in
25