Mortality in patients with chronic and cleared hepatitis Cviral infection: A nationwide cohort study
Bạn đang xem bản rút gọn của tài liệu. Xem và tải ngay bản đầy đủ của tài liệu tại đây (506.34 KB, 7 trang )
Research Article
Mortality in patients with chronic and cleared hepatitis C
viral infection: A nationwide cohort study
Lars Haukali Omland1,*, Henrik Krarup2, Peter Jepsen3, Jørgen Georgsen4, Lene Holm Harritshøj5,
Kirsten Riisom6, Svend Erik Hove Jacobsen7, Per Schouenborg8, Peer Brehm Christensen9,
Henrik Toft Sørensen3,10, Niels Obel1, On behalf of the DANVIR Cohort Study
1
Department of Infectious Diseases, Rigshospitalet, Copenhagen, Denmark; 2Department of Clinical Biochemistry, Aalborg Hospital, Denmark;
Department of Clinical Epidemiology, Aarhus University Hospital, Denmark; 4Department of Clinical Immunology, Odense University Hospital,
Denmark; 5Department of Clinical Immunology and Blood Bank, Rigshospitalet, Copenhagen, Denmark; 6Department of Clinical Immunology,
Viborg Region Hospital, Denmark; 7Department of Clinical Immunology, Hospital of Southern Jutland, Region of Southern Denmark, Denmark;
8
Department of Clinical Microbiology, Vejle Hospital, Denmark; 9Department of Infectious Diseases, Odense University Hospital, Denmark;
10
Department of Epidemiology, Boston University School of Public Health, Boston, MA, USA
3
Background & Aims: It is unknown whether mortality differs
between patients with chronic hepatitis C virus (HCV) replication
and those who cleared the virus after infection. We examined the
impact of chronic HCV replication on mortality among Danish
patients testing positive for HCV antibodies.
Methods: This nationwide cohort study focused on Danish
patients with at least one HCV RNA measurement available after
testing positive for HCV antibodies between 1996 and 2005. To
capture long-term prognosis, eligible patients needed to be alive
1 year after HCV RNA assessment. We estimated mortality rate
ratios (MRRs) using Cox regression (for overall mortality) and
subdistribution hazard ratios (SDHRs) for cause-specific mortality, controlling for gender, age, comorbidity, calendar period,
alcohol abuse, injection drug use, and income.
Results: Of the 6292 patients under study, 63% had chronic HCVinfection and 37% had cleared the virus. Five-year survival was
86% (95% confidence interval (CI): 84–87%) in the chronic HCV
group and 92% (95% CI: 91–94%) in the cleared HCV group.
Chronic HCV-infection was associated with higher overall mortality (MRR: 1.55, 95% CI: 1.28–1.86) and liver-related death (SDHR:
2.42, 95% CI: 1.51–3.88). Chronic HCV-infection greatly increased
the risk of death from primary liver cancer (SDHR: 16.47, 95% CI:
2.24–121.00).
Keywords: HCV; Viraemia; Mortality.
Received 15 October 2009; received in revised form 2 December 2009; accepted 3
January 2010; available online 29 March 2010
*
Corresponding author Address: Department of Infectious Diseases, Rigshospitalet, Blegdamsvej 9, DK2100 Copenhagen Ø, Denmark. Tel.: +45 3545 7726; fax:
+45 3545 6648.
E-mail address: (L.H. Omland).
Abbreviations: HCV, hepatitis C virus; MRR, mortality rate ratio; SDHR, subdistribution hazard ratio; CI, confidence interval; DANVIR, Danish HCV cohort;
DNPR, Danish National Patient Registry; ICD, International Classification of
Diseases; IDU, injection drug use; CRS, Civil Registration System; DRCD, Danish Registry of Causes of Death; RDT, registry of drug abusers undergoing
treatment; IDA, Integrated Database for Labour Market Research; CCI, Charlson Comorbidity Index; MR, mortality rate; PYR, person-years of observation.
Conclusions: Patients with chronic HCV-infection are at
higher risk of death than patients who cleared the infection.
The substantial association found between chronic HCV-infection and death from primary liver cancer supports early
initiation of antiviral treatment in chronically HCV-infected
patients.
Ó 2010 European Association for the Study of the Liver. Published
by Elsevier B.V. All rights reserved.
Introduction
With 170 million persons infected worldwide, hepatitis
C virus (HCV) infection poses serious challenges to global
health [1]. Chronic HCV replication may cause liver fibrosis,
which can progress to cirrhosis, primary liver cancer and
ultimately death [2]. Compared to patients with chronic HCVinfection, patients who clear the virus are at a lower risk
of liver fibrosis [3] and thereby presumably at lower risk of
death.
Recent studies have reported excess mortality in HCVinfected patients compared to the general population [4,5].
The clinical course of chronic HCV, however, is still debated
[6]. The Trent study from the United Kingdom conducted by
Neal et al. [5], which assessed predictors for death in HCVinfected patients, found that positive vs. negative HCV RNA
status (i.e., viraemia vs. no viraemia) did not affect all-cause
mortality. However, as the Trent cohort consisted of patients
from selected referral centres, this finding might not be widely
applicable [5,7]. Furthermore, the Trent study’s sample size and
number of events (2285 patients with 178 deaths) may have
resulted in imprecise estimates of the association between
HCV viraemia and mortality. Valid estimates of this association
are needed to improve our understanding of chronic HCV-infection and to guide the care of HCV-infected patients after HCV
RNA testing.
Journal of Hepatology 2010 vol. 53 j 36–42
JOURNAL OF HEPATOLOGY
We therefore conducted a nationwide cohort study in Denmark to examine the association between HCV viraemia and mortality among patients testing positive for HCV antibodies.
Materials and methods
Setting
Denmark has a population of 5.4 million [8] with an estimated HCV prevalence of
0.3% [9]. Treatment of HCV-infected patients takes place in hospital departments
specialised in infectious diseases, gastroenterology or hepatology [10]. Although
medical care, including antiviral treatment, is provided free-of-charge to all
HCV-infected residents of Denmark, only 2% of the Danish HCV-infected population has been treated with interferon [11].
Study population
To be eligible for our study, patients in DANVIR had to meet the following criteria: (a) positive test for HCV antibodies, (b) test for HCV RNA available on or after
the first positive antibody test, (c) age 20 years or older when tested for HCV RNA,
(d) no HIV diagnosis before the HCV RNA test (as HIV coinfection is associated
with increased mortality [13]) and (e) alive on the index date, defined as 1 year
after the date of the HCV RNA test. The study included all DANVIR participants
fulfilling these criteria from 1 January 1996 until 31 December 2005. As our main
focus was long-term prognosis, we began follow up 1 year following the HCV RNA
test. This delay in enrollment allowed us to avoid potential bias caused by higher
rates of HCV RNA testing in patients with major morbidities who died less than
1 year following the test. We classified patients as having chronic HCV-infection
(positive HCV RNA) or cleared HCV-infection (negative HCV RNA) based on their
first HCV RNA test on or after the HCV diagnosis date. Patients retained their initial classification regardless of the results of further testing.
Information on study participants
Data sources
We used the unique 10-digit civil registration number assigned to all individuals
in Denmark [12] to link the data sources described below.
Danish HCV cohort (DANVIR)
HCV-infected patients were identified from the DANVIR cohort, which includes
all patients tested for HCV in 14 out of the 18 laboratories that perform such testing in Denmark. The cohort is estimated to include more than 90% of all Danish
patients tested for HCV RNA [13]. Data collected include results and dates of
HCV antibody tests (from 1991 onwards) and HCV RNA tests (from 1995
onwards). While HCV antibody tests were performed in all participating DANVIR
centres, most of the HCV RNA measurements were done in one centre (Department of Clinical Biochemistry, Aalborg University Hospital), as described previously [14].
Danish National Patient Registry (DNPR)
DNPR, established in 1977, collects information on all non-psychiatric hospital
admissions in Denmark. Data from outpatient and emergency department visits
have been included since 1995. For each contact, DNPR records dates of admission and discharge and up to 20 discharge diagnoses, assigned by physicians
and coded according to the International Classification of Diseases, 8th revision
(ICD-8) through 1993 and the 10th version (ICD-10) from 1994 onward [15].
We extracted data from the DNPR on patients’ comorbidities (including HIV coinfection), alcohol abuse, injection drug use (IDU), emergency room visits, and hospital admissions.
Civil Registration System (CRS)
CRS, established in 1968, stores information on vital status and migration for all
Danish residents [12]. This data source provided information on dates of death.
Danish Registry of Causes of Death (DRCD)
DRCD contains information from all Danish death certificates issued since 1943.
Computerized and validated Registry information is currently available through
2006 [16]. Whenever a Danish resident dies, the attending physician must report
the cause of death; the chain of events leading to death can be described by specifying up to four diagnoses. Causes of death recorded during the study period
were coded using ICD-10.
Registry of Drug Abusers Undergoing Treatment (RDT)
RDT contains information on all individuals in Denmark who received therapy for
drug addiction after 1996 [17]. Treatment of drug addiction in Denmark occurs
only in referral centres, which provide data to the RDT. We procured data on
IDU from the RDT.
Integrated Database for Labour Market Research (IDA)
IDA, maintained by Statistics Denmark, covers Denmark’s entire population [18].
Information in IDA includes (but is not restricted to) income. Data have been
updated annually since 1980.
Comorbidity
Comorbidity was measured using a modified Charlson Comorbidity Index (CCI)
score derived from diagnoses registered in the DNPR prior to the first HCV RNA
test date [19,20]. The CCI assigns a score between one and six to a range of diseases, with the sum of individual scores serving as a measure of patients’ comorbidity. We defined comorbid diseases using the ICD-10 codes provided by Quan
et al. [21] (matching ICD-8 codes to ICD-10 codes as closely as possible). In the
present study, liver diseases were regarded as complications in the clinical pathway of HCV-infection and therefore not included in the CCI. Three comorbidity
levels were defined: none (CCI score = 0), medium (CCI score = 1–2) or high
(CCI score > 2).
Alcohol abuse and HIV infection
Information on alcohol abuse and HIV infection was obtained from DNPR (see
Appendix 1 for details).
Injection drug use
To be characterized as having IDU a patient had to be registered in RDT and/or
have a DNPR record of one or more diagnoses suggesting IDU prior to the date
of HCV RNA measurement (see Appendix 1 for details).
Liver disease other than HCV
We characterised study participants by history (yes/no) of liver disease (other
than HCV). We included mild and moderate to severe liver diseases in line with
the CCI (see Appendix 1 for details).
Yearly income
We extracted yearly income from IDA in the calendar year preceding HCV RNA
assessment, characterizing it as 0–24%, 25–49%, 50–74%, 75–99%, and 100+% of
the average income in the same calendar year for all Danish citizens of the same
age and gender.
Emergency room visits and hospital admissions
We characterised patients according to whether or not they had been hospitalized or visited an emergency room in the year leading up to HCV RNA
measurement.
Cause of death
Based on the diagnosis listed as the primary cause of death, we categorized
deaths into one of four main categories: liver-related deaths, non-liver-related
natural deaths, unnatural deaths, or other deaths (see Appendix 2 for details).
Statistical analysis
Person-years at risk were computed from the index date until the date of death,
emigration or 31 December 2006, whichever came first. Study outcomes were
time to death and time to specific causes of death. The {2 test and the Mann–
Whitney U test were used to compare inter-group characteristics.
Journal of Hepatology 2010 vol. 53 j 36–42
37
Research Article
All-cause mortality
We computed mortality rates (MR) with 95% confidence intervals (CI). We constructed Kaplan–Meier survival curves and used Cox regression analysis to compute mortality rate ratios (MRRs) as a measure of relative risk of death. The
following covariates were included in the Cox regression models to adjust for
confounding: gender, age at first HCV RNA test (20–29, 30–39, 40–49, 50–59,
60–69 or 70+ years), comorbidity (none, medium or high), year of first HCV
RNA test (1996–1998, 1999–2002 or 2003–2005), alcohol abuse, IDU and income
in the calendar year preceding HCV RNA assessment (0–24%, 25–49%, 50–74%,
75–99% and 100+ of average national income). Persons with missing income values were excluded from the adjusted analysis in accordance with the ‘‘completesubject method” [22]. Schoenfeld plots confirmed that the proportional hazard
assumptions were fulfilled.
To explore the generalizability of the effect of chronic HCV-infection, we
repeated the analyses in subgroups defined by patients’ characteristics.
Specific causes of death
We computed the cumulative incidence of specific causes of death, taking into
account their status as competing risks [23]. We then used competing risks
regression to obtain subdistribution hazard ratios (SDHRs) as a measure of the
associations between HCV-infection and the cumulative incidence of specific
causes of death [24]. We computed adjusted SDHRs for the main categories of
causes of death (i.e., liver-related deaths, non-liver-related natural deaths, unnatural deaths or other deaths) using the same covariates as in the Cox regression
(except for age, where only three categories were used (20–39, 40–69 and 70+
years)). Due to the small number of events (see Appendix 2), only unadjusted
SDHRs were computed for detailed cause-of-death categories.
infected and 2323 (37%) as having cleared the infection. Compared to patients in the cleared group, patients with chronic
HCV-infection were more likely to be male, and they also were
older and had lower income, more hospitalizations, and a higher
prevalence of non-HCV-related liver disease (Table 1).
Overall mortality
During 23,648 person-years of observation (PYR), a total of 601
patients died (MR: 25.4/1000 PYR, 95% CI: 23.5–27.5) with 448
deaths in the chronic group and 153 deaths in the cleared group.
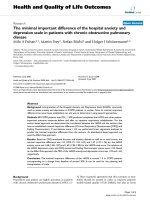
Five-year survival was 86% (95% CI: 84–87%) among patients in
the chronic HCV group and 92% (95% CI: 91–94%) among those
in the cleared HCV group (Fig. 1). The adjusted MRR was 1.55
(95% CI: 1.28–1.86). Chronic HCV-infection was associated with
increased mortality in most subgroups, except among patients
with severe comorbidity (Table 2). Restricting the cohort to
patients whose positive HCV antibody test was confirmed by a
3rd generation diagnostic test prior to HCV RNA measurement
(n = 2753) did not change the estimated association between
chronic HCV-infection and mortality (data not shown).
Specific causes of death
Results
Descriptive data
From the DANVIR cohort we identified 13,005 patients diagnosed
with HCV, of whom 6292 met the study’s inclusion criteria. Of
these, 3969 patients (63%) were classified as chronically HCVTable 1. Characteristics of the 6292 HCV antibody-positive patients aged
20 years or more at the time of HCV RNA measurement, by HCV RNA status.
*
HCV RNA À
HCV RNA +
2323 (37)
1295 (56)
38 (30–47)
3969 (63)
2713 (68)
40 (32–47)
1933 (83)
336 (14)
54 (2)
3230 (81)
628 (16)
111 (3)
<0.001
<0.001
0.165
1.0
0.902
433
963
927
238
(19)
(41)
(40)
(10)
740 (19)
1624 (41)
1605 (40)
576 (15)
1043 (45)
2240 (56)
184 (8)
684 (29)
571 (25)
367 (16)
488 (21)
29 (1)
749 (32)
613 (26)
189 (8)
359 (9)
1609 (41)
1055 (27)
512 (13)
374 (9)
60 (2)
1440 (36)
1140 (29)
444 (11%)
0.8
<0.001
<0.001
<0.001
0.6
0.4
0.2
0.001
0.046
<0.001
0.0
0.00 (0.00–0.49) 0.10 (0.00–1.69) <0.001
In the year preceding the first HCV RNA measurement.
See Appendix 1 for details.
38
p-Value
Probability of survival
Patients, No. (%)
Male, No. (%)
Age, years, median (IQR)
Modified Charlson Index, no. (%)
None
Medium
High
Year of HCV RNA
measurement, no. (%)
1996–1998
1999–2002
2003–2005
Diagnosed with alcohol
abuse, no. (%)
Injection drug users, no. (%)
Income (% of national average)
0–24%
25–49%
50–74%
75–99%
100+%
Missing
Emergency room visit, no. (%)*
Admitted to hospital, no. (%)*
Diagnosed with liver disease
(other than HCV), no. (%)
Time from HCV diagnosis to first
HCV RNA measurement, years,
median (IQR)
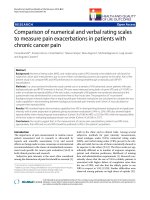
In HCV RNA positive patients, the 8-year risks of death were: 5.5%
from liver-related death, 5.5% from non-liver-related natural
death, 8.8% from unnatural death, and 0.8% from other death. In
HCV RNA negative patients these estimates were 2.0%, for liverrelated death, 5.0% for non-liver-related natural death, 6.6% for
unnatural death, and 0.2% for other death (Fig. 2). The risk of
death other than liver-related death (i.e. non-liver-related death,
unnatural death and other death) thereby far exceeded the risk of
liver-related death for both HCV RNA positive and negative
patients (15.1% vs. 5.5% and 11.8% vs. 2.0%, respectively). The corresponding causes for specific MRs are provided in Supplementary Table 1.
0
2
4
6
Time (years)
8
Fig. 1. Kaplan–Meier curves for HCV-infected patients. Solid line: patients with
cleared HCV-infection; broken line: patients with chronic HCV-infection.
Journal of Hepatology 2010 vol. 53 j 36–42
JOURNAL OF HEPATOLOGY
Table 2. Mortality rate ratios (MRRs) for patients with chronic HCV-infection
compared to patients with cleared HCV-infection by patient subgroups. MRRs
were adjusted for gender, age, comorbidity, calendar period, alcohol abuse, IDU,
and income (patients with missing values for income (n = 89) were excluded from
the adjusted analysis).
Patient group
n
Unadjusted MRR
(95% CI)
Adjusted MRR
(95% CI)
Total
Sex
Female
Male
Age
20–39 years
40+ years
Modified CCI
None
Medium
High
Time of first
HCV RNA test
1996–1998
1999–2002
2003–2005
Alcohol abuse
No
Yes
IDU
No
Yes
Liver disease
No
Yes
Emergency room visit
No
Yes
Admitted to hospital
No
Yes
6292
1.79 (1.49–2.16)
1.55 (1.28–1.86)
2284
4008
1.80 (1.29–2.51)
1.71 (1.37–2.13)
1.62 (1.16–2.27)
1.50 (1.20–1.88)
3365
2927
1.53 (1.16–2.02)
1.88 (1.47–2.40)
1.36 (1.03–1.81)
1.71 (1.33–2.22)
5163
964
165
1.89 (1.51–2.38)
1.75 (1.19–2.57)
0.95 (0.54–1.66)
1.58 (1.26–1.99)
1.80 (1.21–2.66)
0.94 (0.51–1.72)*
1173
2587
2532
1.50 (1.10–2.04)
1.85 (1.43–2.40)
2.45 (1.49–4.05)
1.39 (1.02–1.91)
1.55 (1.19–2.02)
1.84 (1.10–3.09)
5478
814
1.84 (1.48–2.30)
1.38 (0.99–1.91)
1.65 (1.32–2.07)
1.19 (0.84–1.68)
3009
3283
2.05 (1.56–2.69)
1.57 (1.22–2.01)
1.61 (1.22–2.13)
1.43 (1.11–1.84)
5659
633
1.68 (1.37–2.05)
2.09 (1.32–3.33)
1.50 (1.23–1.85)
1.53 (0.96–2.46)
4103
2189
2.02 (1.57–2.60)
1.49 (1.14–1.95)
1.80 (1.40–2.33)
1.27 (0.97–1.67)
4539
1753
2.13 (1.65–2.76)
1.42 (1.09–1.85)
1.81 (1.39–2.35)
1.25 (0.95–1.63)
*
Because of few events, we used a reduced model with the following income
categories: 0–49%, 50–99% and 100+% of national average.
Chronic HCV-infection was primarily associated with liverrelated death (SDHR: 2.42, 95% CI: 1.51–3.88), and to some extent
with non-liver-related natural causes of death (SDHR: 1.24, 95%
CI: 0.91–1.71) and unnatural causes of death (SDHR: 1.28, 95%
CI: 0.97–1.69). In the non-liver-related natural death category,
none of the detailed causes of death were notably associated with
chronic HCV-infection (Table 3). Except for primary liver cancer,
there was no substantially increased risk of death due to neoplasms (SDHR: 1.28, 95% CI: 0.65–2.54).
Of the liver-related deaths, death due to alcoholic liver disease
was the most frequent (2.3% vs. 1.4% after 8 years of follow-up for
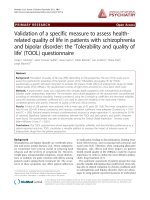
patients with chronic vs. cleared HCV-infection). Chronic HCVinfection was substantially associated with death from primary
liver cancer (SDHR: 16.47, 95% CI: 2.24–121). However, death
from primary liver cancer was rather infrequent (28 events vs.
1 event for patients with chronic vs. cleared HCV-infection, corresponding to an 8-year risk of 1.4% in patients with chronic HCVinfection and of 0.0% in patients with cleared HCV-infection)
(Fig. 3). There were no deaths due to oesophageal or gastric
varices.
Discussion
We observed an increased mortality among patients with
chronic HCV-infection compared to patients with cleared infec-
tion, based on HCV RNA testing. This effect was observed in all
patient subgroups except in those with severe comorbidity.
Chronic HCV-infection was associated with liver-related mortality, and in particular death from primary liver cancer. However,
the risk of deaths other than liver-related deaths by far
exceeded the risk of liver-related deaths in both HCV RNA positive and HCV RNA negative patients. To our knowledge, no previous study has addressed the impact of chronic HCV replication
on mortality in an equivalent nationwide setting with a long
and complete follow-up and with an extensive control of
confounders.
Our study has several limitations. We had access to the exact
date of HCV diagnosis, but not the date of HCV-infection [6]. For a
substantial proportion of study participants, HCV-infection could
have preceded study inclusion by several years, since most HCVinfections occur subclinically [6]. Thus patients in the chronic
group could have had more liver damage at the time of study
inclusion than patients in the cleared group. We did not have
access to liver biopsies or liver function tests, so we could not
directly address this question. More patients in the chronic HCV
group than in the cleared group were diagnosed with liver diseases other than HCV. However, we were able to demonstrate
that chronic HCV-infection was associated with mortality in
patients both with and without pre-existing liver diseases, which
indicates that severity of liver disease did not explain our findings. Our analyses did not account for spontaneous or treatment-related viral clearance nor HCV re-infection during
follow-up. Most patients are IDUs, and probably as a result, regular testing for HCV RNA subsequent to an initial diagnosis is not
performed systematically in Denmark. Modelling HCV viraemia
as a time-updated variable thus was not possible in this study.
However, spontaneous clearance of HCV-infection subsequent
to the initial acute phase of the disease occurs infrequently [25]
and only a minority of Danish patients receive antiviral treatment
[11]. Finally, despite the large study population and long-term
follow up, our study had too small power to make statistically
significant estimates for most of the detailed categories of causes
of death.
Patients with chronic HCV-infection were at an increased
risk of liver-related death, with the strongest association
observed between chronic HCV-infection and primary liver
cancer. This information is important, and suggests that clearance of the virus almost eliminates the risk of developing primary liver cancer, thus confirming the potential benefit of
antiviral treatment. However, one patient in the cleared group
developed primary liver cancer. This observation agrees with
recent findings of cases of hepatocellular carcinoma in longterm viral suppression responders [26]. These data suggest that
clearance of the virus substantially decreases but not fully
eliminates the risk of primary liver cancer. Chronic HCV-infection was also associated with other liver-related causes of
death (viral hepatitis, alcoholic liver disease and non-alcoholic
liver disease), also emphasising the potential for antiviral
treatment.
The associations between chronic HCV-infection and nonliver-related natural deaths, unnatural deaths and other deaths
diminished when we adjusted for confounders. However, we
cannot exclude the possibility of unmeasured or residual confounding. The fact that patients with chronic HCV-infection
were at increased risk of unnatural deaths (and to some extent
death due to infections) indicates certain risk-taking behaviour
Journal of Hepatology 2010 vol. 53 j 36–42
39
Research Article
Liver related deaths
Non-Liver related deaths
0.10
0.10
cleared
chronic
0.06
0.04
0.06
0.04
0.02
0.02
0.00
0.00
0
2
cleared
chronic
0.08
Cumulative incidence
Cumulative incidence
0.08
4
6
8
0
2
Time (years)
Unnatural deaths
6
8
Other deaths
0.10
0.10
cleared
chronic
0.06
0.04
0.06
0.04
0.02
0.02
0.00
0.00
0
2
cleared
chronic
0.08
Cumulative incidence
0.08
Cumulative incidence
4
Time (years)
4
6
8
0
Time (years)
2
4
6
8
Time (years)
Fig. 2. Cumulative incidence of specific causes of death. Solid line: patients with cleared HCV-infection; broken line: patients with chronic HCV-infection.
in this group. As we were unable to adjust for this factor in our
models, this could have resulted in unmeasured confounding.
We find it likely that the associations found between chronic
HCV-infection and non-liver-related natural deaths, unnatural
deaths, and other deaths result from unmeasured confounding.
In particular, from more injection drug use among chronically
HCV-infected patients than among patients who cleared the
virus.
The Trent HCV Cohort Study examined predictors of survival
among HCV-infected patients treated in secondary care centres.
That study, unlike ours, reported no substantial association
between HCV RNA positive status (compared to HCV RNA negative status) and an increased all-cause mortality (MRR: 1.1, 95%
CI 0.7–1.8) [5]. These inconsistent findings might be a result of
lack of precision in the Trent study, which included only 157
deaths in the HCV RNA positive group and 21 deaths in the
40
HCV negative group. More likely, however, these inconsistencies
stem from differences in the study populations, as the Trent HCV
Cohort only included patients from referral sites, while our study
included nearly all patients tested for HCV RNA in Denmark. The
patients in the Trent study therefore may have been at a more
advanced stage of their liver disease and may have had more
comorbidity. In that case, results for the Trent HCV Cohort should
be compared to results for the most diseased subgroup of our
study population. In fact, we did not observe a substantial impact
of chronic HCV-infection among patients with a high comorbidity
index, those with alcohol abuse or those who had been hospitalized recently. In a previous study from our group focusing on
Danish HIV-infected IDUs with a high level of comorbidity, we
also observed no association between chronic vs. cleared HCVinfection and mortality [27]. These findings suggest that chronic
HCV-infection, compared to cleared HCV-infection, is associated
Journal of Hepatology 2010 vol. 53 j 36–42
JOURNAL OF HEPATOLOGY
Table 3. Cause-specific mortality. Due to few events, only unadjusted subdistribution hazard ratios (SDHRs) were calculated for the detailed categories of causes of death.
Main categories of death
Detailed categories of death
Cause of
death
Deaths in
chronic
group, n
Deaths in
cleared
group, n
Unadjusted
SDHR
(95% CI)
Adjusted
SDHR
(95% CI)
Cause of death
Deaths in
chronic
group, n
Deaths in
cleared
group, n
Unadjusted
SDHR
(95% CI)
Liver-related
deaths
122
25
2.91
(1.89–4.48)
2.42
(1.51–3.88)
Viral hepatitis
35
2
Primary liver cancer
28
1
Alcoholic liver disease
53
20
Non-alcoholic liver disease
6
2
Neoplasms
(excl. primary liver cancer)
26
12
10.35
(2.49–43.06)
16.47
(2.24–121.00)
1.57
(0.94–2.62)
1.79
(0.36–8.82)
1.28
(0.64–2.54)
Miscellaneous causes of death
18
11
Endocrine, nutritional, and
metabolic diseases
Diseases of the nervous system
7
7
10
2
Diseases of the circulatory system
(excl. oesophageal
and gastric varices)
Diseases of the respiratory
system
Diseases of the digestive system
(excl. liver diseases)
Mental and behavioural disorders
due to psychoactive substance
use
External causes
40
14
15
4
9
5
36
14
146
56
Certain infectious and
parasitic diseases
(excl. viral hepatitis)
Missing causes of death
11
1
8
2
Non-liverrelated
natural deaths
125
Unnatural
deaths
55
182
Other deaths
70
19
0.08
3
1.35
(0.98–1.85)
1.55
(1.18–2.04)
3.75
(1.11–12.66)
1.24
(0.91–1.71)
1.28
(0.97–1.69)
2.92
(0.83–10.29)
2.21
(0.74–6.61)
1.06
(0.36–3.19)
1.52
(0.82–2.82)
1.55
(1.14–2.11)
6.48
(0.84–50.11)
2.37
(0.50–11.20)
with increased mortality in most patient groups. However, in
high-risk study populations characterised by substantial mortality, the relative impact of chronic HCV-infection is limited.
We conclude that based on HCV RNA assessment, patients
with chronic HCV-infection have higher mortality and, in
particular, a higher risk of liver-related death than patients
who cleared the virus. The pronounced association between
chronic HCV-infection and death from primary liver cancer provides a rationale for antiviral treatment in chronically HCVinfected patients. However, our data also underline the importance of a balanced decision, as subgroups characterised by
substantial mortality probably have less potential for a treatment benefit.
cleared
chronic
0.06
Cumulative incidence
0.96
(0.45–2.04)
0.59
(0.21–1.68)
2.96
(0.65–13.48)
1.69
(0.92–3.10)
0.04
0.02
Potential financial conflicts of interest
0.00
0
2
4
6
Time (years)
8
Fig. 3. Cumulative incidence of death from primary liver cancer. Solid line:
patients with cleared HCV-infection; broken line: patients with chronic HCVinfection.
N. Obel has received grants from Roche, Bristol-Meyers Squibb,
Merck Sharp & Dohme, GlaxoSmithKline, Abbott, Boehringer
Ingelheim, Janssen-Cilag, and Swedish-Orphan Drugs.
P.B. Christensen has received grants from Roche and Scheering-Plough.
The authors who have taken part in this study declared that
they do not have anything to disclose regarding funding or conflict of interest with respect to this manuscript.
Journal of Hepatology 2010 vol. 53 j 36–42
41
Research Article
Funding
Lars H Omland received funding for this research through a PhD
scholarship from Rigshospitalets Research Council.
Acknowledgements
Centres and members of the DANVIR Cohort Study.
Department of Clinical Biochemistry, Bispebjerg Hospital (H.L.
Jørgensen), Department of Clinical Biochemistry, Hospital of
Southwest Denmark, Region of Southern Denmark (A.-M.B. Münster), Department of Clinical Microbiology, Herlev Hospital (J.
Bangsborg), Department of Clinical Biochemistry, Hvidovre Hospital (M. Fenger), Department of Clinical Biochemistry, Aalborg
Hospital (H. Krarup), Department of Clinical Microbiology, Hvidovre Hospital (H Westh), Copenhagen General Practitioners Laboratory (B. Lind), Department of Internal Medicine, Koge Hospital
(H. Kromann-Andersen), Department of Clinical Immunology
and Transfusion Services, Region Sealand (K. Homburg), Department of Virology, Statens Serum Institut, Copenhagen (C. Nielsen), Department of Clinical Immunology, Odense University
Hospital (J. Georgsen), Department of Clinical Immunology and
Blood Bank, Rigshospitalet (L.H. Harritshøj), Department of Clinical Immunology, Viborg Region Hospital (K. Riisom), Department
of Clinical Immunology, Hospital of Southern Jutland, Region of
Southern Denmark (S.E.H. Jacobsen) and Department of Clinical
Microbiology, Vejle Hospital (P. Schouenborg), Department of
Infectious Diseases, Odense University Hospital (P.B. Christensen), Department of Infectious Diseases, Hvidovre Hospital (N.
Weis), Department of Infectious Diseases, Rigshospitalet (N. Obel)
and Department of Clinical Epidemiology, Aarhus University Hospital (P. Jepsen and H.T. Sørensen).
Appendix A. Supplementary data
Supplementary data associated with this article can be found, in
the online version, at doi:10.1016/j.jhep.2010.01.033.
References
[1] World Health Organization. Hepatitis C – global prevalence (update). Wkly
Epidemiol Rec 1999;74:425–427.
[2] Poynard T, Yuen MF, Ratziu V, Lai CL. Viral hepatitis C. Lancet
2003;362:2095–2100.
[3] Barrett S, Goh J, Coughlan B, Ryan E, Stewart S, Cockram A, et al. The natural
course of hepatitis C virus infection after 22 years in a unique homogenous
cohort: spontaneous viral clearance and chronic HCV infection. Gut
2001;49:423–430.
[4] Amin J, Law MG, Bartlett M, Kaldor JM, Dore GJ. Causes of death after
diagnosis of hepatitis B or hepatitis C infection: a large community-based
linkage study. Lancet 2006;368:938–945.
[5] Neal KR, Ramsay S, Thomson BJ, Irving WL. Excess mortality rates in a cohort
of patients infected with the hepatitis C virus: a prospective study. Gut
2007;56:1098–1104.
42
[6] Wiese M, Grungreiff K, Guthoff W, Lafrenz M, Oesen U, Porst H. Outcome in a
hepatitis C (genotype 1b) single source outbreak in Germany – a 25-year
multicenter study. J Hepatol 2005;43:590–598.
[7] Mohsen AH. The epidemiology of hepatitis C in a UK health regional
population of 5.12 million. Gut 2001;48:707–713.
[8] Statistics Denmark. Available from: />[9] The National Board of Health. Guide to the prevention of viral hepatitis [in
Danish]. Available from: />hele.pdf.
[10] Christensen PB, Krarup HB, Moller A, Laursen AL, Kjaer MS, Orholm M, et al.
Liver biopsy performance and histological findings among patients with
chronic viral hepatitis: a Danish database study. Scand J Infect Dis
2007;39:245–249.
[11] Lettmeier B, Muhlberger N, Schwarzer R, Sroczynski G, Wright D, Zeuzem S,
et al. Market uptake of new antiviral drugs for the treatment of hepatitis C. J
Hepatol 2008;49:528–536.
[12] The Central Office of Civil Registration. The Civil Registration System in
Denmark. Available from: />[13] Omland LH, Jepsen P, Skinhoj P, Jorgensen HL, Munster AM, Bangsborg J,
et al. The impact of HIV-1 co-infection on long-term mortality in patients
with hepatitis C: a population-based cohort study. HIV Med 2009;10:
65–71.
[14] Krarup HB, Drewes AM, Madsen PH. A quantitative HCV-PCR test for routine
diagnostics. Scand J Clin Lab Invest 1998;58:415–422.
[15] The National Board of Health. The National Patient Registry. The National
Patient Registry. Available from: />Landspatientregister.aspx?lang=en2007.
[16] Juel K, Helweg-Larsen K. The Danish registers of causes of death. Dan Med
Bull 1999;46:354–357.
[17] The National Board of Health. The Registry of Drug Abusers Undergoing
Treatment. Available from: />Stofmisbrugerregister.aspx?lang=en.
[18] Statistics Denmark. The Integrated Database for Labour Market Research.
Available from: />[19] Charlson ME, Pompei P, Ales KL, MacKenzie CR. A new method of classifying
prognostic comorbidity in longitudinal studies: development and validation.
J Chronic Dis 1987;40:373–383.
[20] Sundararajan V, Henderson T, Perry C, Muggivan A, Quan H, Ghali WA. New
ICD-10 version of the Charlson comorbidity index predicted in-hospital
mortality. J Clin Epidemiol 2004;57:1288–1294.
[21] Quan H, Sundararajan V, Halfon P, Fong A, Burnand B, Luthi JC, et al. Coding
algorithms for defining comorbidities in ICD-9-CM and ICD-10 administrative data. Med Care 2005;43:1130–1139.
[22] Greenland S, Rothman KJ. Fundamentals of epidemiologic data analysis. In:
Rothman KJ, Greenland S, Lash TL, editors. Modern epidemiology, 3rd ed.
Lippincott/Williams & Wilkins; 2008. p. 213–37.
[23] Kleinbaum DG, Klein M. Competing risk survival analysis survival analysis. A
self-learning text. 2nd ed. New York: Springer Science + Business Media,
LLC; 2005, p. 391–461.
[24] Fine JP, Gray RJ. A proportional hazards model for the subdistribution of a
competing risk. J Am Stat Assoc 1999;94:496–509.
[25] Lauer GM, Walker BD. Hepatitis C virus infection. N Engl J Med 2001;345
(1):41–52.
[26] Scherzer TM, Reddy KR, Wrba F, Hofer H, Staufer K, Steindl-Munda P, et al.
Hepatocellular carcinoma in long-term sustained virological responders
following antiviral combination therapy for chronic hepatitis C. J Viral Hepat
2008;15:659–665.
[27] Omland LH, Jepsen P, Weis N, Christensen PB, Laursen AL, Nielsen H, et al.
Mortality in HIV-infected injection drug users with active vs cleared
hepatitis C virus-infection: a population-based cohort study. J Viral Hepat
2010;17:261–268.
Journal of Hepatology 2010 vol. 53 j 36–42