Current status and biological characteristics of giant freshwater prawn (macrobrachium rosenbergii de man, 1879) cultured in the brackish water environment
Bạn đang xem bản rút gọn của tài liệu. Xem và tải ngay bản đầy đủ của tài liệu tại đây (446.87 KB, 21 trang )
MINISTRY OF EDUCATION AND TRAINING
CAN THO UNIVERSITY
SUMMARY DISSERTATION OF DOCTOR DEGREE
Subject: Aquaculture
Code: 62 62 03 01
HUYNH KIM HUONG
CURRENT STATUS AND BIOLOGICAL CHARACTERISTICS OF GIANT
FRESHWATER PRAWN (Macrobrachium rosenbergii DE MAN, 1879) CULTURED
IN THE BRACKISHWATER ENVIRONMENT
Can Tho, 2016
THIS DISSERTATION WAS CONDUCTED AT
CAN THO UNIVERSITY
Promoter:
Associate Professor Doctor: Tran Ngoc Hai
Associate Professor Doctor: Do Thi Thanh Huong
The dissertation will be defended at the university committee in … at: ….… hr ….… date …….
Month………year………………..
At…………..hour…….day……….month…………2016
Examiner 1:
Examiner 2:
Examiner 3:
The disseratation is available in Libraries:
Learning Resource Center of Can Tho University
National Library, Vietnam
Chapter 1
INTRODUCTION
1.1 Background
Due to over-developing on Penaeid shrimp culture in recent years, there were many issues in shrimp cultivation
caused by disease outbreak and environmental pollution. In addition, in the increasing situation of climate change,
sea level rise as well as saltwater intrusion, Mekong Delta is warned to be the vulnerable area affected hardly
(Ministry of Natural Resource and Environment, 2009; 2012). The development of aquaculture systems in brackish
water with different salinities has become important trend in order to adapt to these negative impacts of the
mentioned issues. Freshwater prawn is considered potential culture species in adaptation the situation. According to
Pham Van Tinh (2004), freshwater prawn was a species that can tolerate to the wide salinity range (0-25‰). The
effect of salinity on freshwater prawn was also documented in some other previous domestic and international
studies (Yen and Bart, 2008; Do Thi Thanh Huong et al., 2010; Nguyen Thi Em, 2008) that was a key basis to
further studies to develop freshwater prawn culture in brackish water. In reality, farmers in Mekong Delta also
culture freshwater prawn in salinization area. However, there were no full evaluations on suitability and economic
efficiency of culture systems in brackish water up to now. The study “Current status and biological characteristics
of giant freshwater prawn (Macrobrachium rosenbergii De Man, 1879) cultured in the brackish water
environment” was conducted to evaluate scientific basis, status, potential and solutions to develop freshwater
prawn culture in brackish water; and contribute to sustainable aquaculture in Mekong Delta in the future.
1.2 Objectives
1.2.1 General objective
The general objectives of the study are to evaluate the status and to find out scientific basis to develop freshwater
prawn culture in brackish water, in order to diversify culture systems and species, to stabilize social-economics for
inhabitants, and to adapt to the issues of sea level rise and saltwater intrusion in Mekong Delta.
1.2.2 Specific objectives
-
To analyze the status of freshwater prawn culture in brackish water in Mekong Delta
To evaluate the effects of salinity on osmoregulation and biochemical parameters of prawn as well as
reproductive and growth performances, survival rate, and productivity of freshwater prawn cultured in
experimental tanks.
- To determine technical and financial efficiency of some freshwater prawn pond culture trials in brackish water
area.
1.3 Research activities
1. Surveying the status of freshwater prawn in brackish water in Mekong Delta
2. Comparing some bio-parameters, growth rate, and survival rate of freshwater prawn cultured in tank under
different salinities.
3. Culturing freshwater prawn in small-scale farms in brackish water in Tra Vinh province.
1.4 Research significance
The research findings provide new knowledge on the effects of salinity on some biological characteristics of
freshwater prawn under experimental conditions.
Besides, it also shows technical characteristics, the economic efficiency, and major factors that effect the
productivities and financial efficiency of culture systems in different provinces in Mekong Delta.
The results of study strongly contribute to planning and developing strategies for freshwater prawn culture in
brackish water in Mekong Delta. The study is also an important reference for education and further researches on
freshwater prawn as well as other species, that contributes to be scientific basis, technical and financial
improvement in aquaculture production in brackish water area.
1.5 New findings of the study
From the results of the experiment, research, and survey on the real conditions, the studies all showed that
freshwater prawns cultured in brackish water of 5-15‰ grow not differently compared to those in freshwater;
moreover, decrease in spawning compared to those in freshwater.
The study updated, deeply analyzed and showed the development trend, technical and socio-economical aspects,
and factors effecting to the efficiency of culture systems of freshwater prawn in brackish water area.
1
The study provide results of the trials in freshwater prawn culture in different salinities with technical supports
resulting in better efficiency compared to the current status. This is an important basis to improve and develop
further culture system of freshwater prawn in brackish water in Mekong Delta.
Chapter 3
MATERIALS AND METHODS
3.1 Approach Method
The study was conducted based on approach basis as the follow: (i) Freshwater prawn was one of the importantly
economic species; (ii) This species had wide range of distribution in freshwater and brackish water; (iii) freshwater
prawn culture has been practiced in brackish water in Mekong Delta; (iv) Mekong Delta had large salinization area
and tent to face with stronger saltwater intrusion in the next time due to impacts of climate change which need
effective solutions, (v) Studying to find out suitable cultured species and aquaculture systems to adapt to climate
change and saltwater intrusion require strong scientific knowledge and experiences.
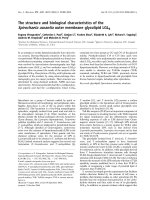
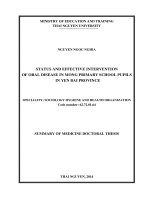
3.2 Research diagram
2
Objective: To analyze status and to find out scientific
information for culturing prawns in brackish water
Survey and evaluation on
the current status of culturing
prawns in brackish water in
Mekong Delta
Experiment: Effect of
different salinity on growth,
physiology, biochemical,
reproduction of prawns
cultured in tanks
Practice: Monitoring
technical, environmental
parameters, financial
efficiency of culturing
prawns in ponds at different
salinity in brackish water
System:
Prawns +
Rice
culture
alternativ
ly with
Tiger
shrimp in
field.
Pupulatio
n culture
of prawns
in tanks
at
different
salinity
(0, 5, 10,
15‰).
Prawn culturing at different
sites in Tra Vinh
Duyen Hai: 3 ponds
Cau Ngang: 3 ponds
Tra Cu: 3 ponds.
System:
Prawns
culture
alternativ
ly with
Tiger
shrimp in
pond.
Individual
culture of
prawn in
tanks at
different
salinity (0,
5, 10,
15‰).
Analyzing, Linking and discussion to evaluate the results
Conclusion and recommendation
Figure 3.1: Research diagram
3.3 Time and location
The research has been carried out from 2010 to 2014 in Tra Vinh, Bac Lieu, and College of Aquaculture and
Fisheries (Can Tho University).
3.4 Study Methods
3.4.1
Survey and evaluation of the status of freshwater prawn in brackish water in Mekong Delta
The survey was carried out in 2013 with 60 farms in Bac Lieu and 48 farms in Tra Vinh. Especially, in Tra Vinh,
16 farms are selected to survey in 2010 and re-survey in 2013.
3.4.1.1 Secondary data collection
Information and primary data were collected from annual reports of Department of Agriculture and Rural
Development, Fisheries Division in Tra Vinh and Bac Lieu. Collected information and data include statistics on
culture area and production of freshwater prawn, advantages and disadvantages, and development plan.
3.4.1.2 Primary data collection
Primary data were collected through the interview of farmers which applied 2 culture systems as follows, using
questionnaires:
- Freshwater prawn + Rice – Tiger shrimp system (System 1): Surveying 60 farms in Hong Dan and Phuoc Long
districts, Bac Lieu province. In this system, freshwater prawn was integrated with rice on rice field in rainy season
after tiger shrimp crop in dry season.
3
- Freshwater prawn- Tiger shrimp (System 2): 16 and 48 farms were surveyed in 2010 and 2013, respectively in
Cau Ngang, Tra Cu, and Duyen Hai districts (Tra Vinh province).
- The content of the questionnaires: (i) general information of farms, (ii) technical aspects, (iii) economical aspects,
(iv) advantages and disadvantages of farms during crop, (v) plan and suggestion.
3.4.2 Evaluation of the effects of salinity on biological parameters, growth rate and survival rate of
freshwater prawn in tank
3.4.2.1 Experimental design
The experiment was conducted in 4 treatments with different salinities including 0‰ (control), 5‰, 10‰ and
15‰. Each treatment was assigned to 2 groups consisting of population and individual culture.
a) Population culture
Objective: To evaluate the effect of salinity on growth, survival rate, biomass, physiological and biochemical
parameters, breeding of freshwater prawn. Prawns were kept in composite tanks (2m3) with density 60
individuals/tank. Each treatment was triplicated. Initial weight and length of prawn were 0.3-0.5g and 2.8-3.3 cm,
respectively.
b) Individual culture
Objective: To evaluate the effect of salinity on molting period, maturation, the first time of spawning, re-mature
and spawning period of freshwater prawn. Each individual was kept in 1 net cage (15x15x75cm) with net mesh of
0.5mm. Each treatment has 60 cages (60 prawns) placed in one composite tank (2m3) and with 50cm of water level.
Cages were numbered from 1 to 60.
3.4.2.2 Experimental conditions
Freshwater prawn fingerlings were kept in freshwater in a month before carrying out experiment. Healthy prawns
without deformity and disease were selected and acclimated to salinity up to 5‰, 10‰, and 15‰ in accordance to
each treatment.
Experimental system were placed under nylon roof and kept aerated continuously. For population culture, nylon
bunch were used as substrates for prawns to avoid cannibalism.
3.4.2.3 Control and Management
Experimental prawns were fed with commercial feed (Starter, UP) with crude protein at 35%. In the first 60 days,
prawns were fed 3 times per day, then, twice per day (5-10% body weight/day). Feed were spread out for
population culture and fed each cage for individual culture. Exceed feed and waste were siphoned once per day
(before feeding). Exchanging 50% of water once per 2 weeks. Culture period was 120 days.
3.4.2.4 Collecting data
a) Water quality in tanks
Water quality parameters such as temperature, pH, TAN, N-NO2- and alkalinity were recorded daily
b) Parameters on freshwater prawn
- Population culture: taking sample once per month to determine growth parameters, survival rate, ratio of berried
/not berried female, male/female ratio. Biomass of prawn was calculated at the end of experiment.
+ Biochemical parameters: At the end of the experiment, randomly sampling 3 individuals/ tank to analyze
some biochemical parameters such as protein, lipid, energy, carbohydrate, and minerals.
+ Physiological parameters: sampling 0.2 mL of culture water and 0.1-0.2 mL of prawn blood (3
individuals/ tank) to measure osmotic pressure monthly from the 2nd month onwards. After sampling blood, prawns
were re-stocked for culture in tanks.
- Individual population: growth parameters and survival rate were sampled once per month. Growth parameters
such as body weight and length measured in each cage. Molting period of each prawn was checked daily.
Determining ratio of male and female monthly from the 2nd month. Mature, spawning and re-spawning were
checked and recorded daily in each tank. The quantity of re-mature and spawning of each prawn were also
recorded.
c) Analysis method
The biochemical parameters of prawn meat were analyzed by AOAC (2000) method. Prawn meat samples were
mashed and dried at 60oC during 48 hours, then grinded to analyze protein, lipid, carbohydrate, and minerals.
d) Analyzing concentration of osmotic pressure in water environment and prawn blood.
Osmotic pressures were measured by Osmotic Pressure Fiske One – Ten Osmometer.
4
3.4.2 Experiment on culture of freshwater prawn in brackish water pond in rainy season (alternatively with
tiger shrimp in dry season) in farms in Tra Vinh province.
3.4.3.1 Some main parameters to choose experimental site
The study was conducted in brackish water pond from June to December, 2013. Selected ponds must meet some
important requirement.
3.4.3.2 Choosing and preparing ponds
Three ponds were chosen in each district of Duyen Hai, Cau Ngang, and Tra Cu, Tra Vinh province, to guide and
to monitor on prawn culture. Each pond is 4000 m2 in area and 1.5m in depth. Pond preparation was carried out in
June. After harvesting tiger shrimp, ponds were drained off and were limed and dried for 3 days. Water was then
supplied through filter bag and applied with Saponin to kill predators. Prawns were stocked after one week.
3.4.3.3 Stocking and management
Freshwater prawn (PL15) (average weight 0.02g/ individual) sourced from hatchery are stocked at 7 inds/m2, and
fed with commercial feed (Starter, UP) with crude protein 35%. Prawns were fed 4 times per day with different
feeding rates based on culture month:
+ 1st month: 15-10% prawn body weight
+ 2nd month: 10-5% prawn body weight
+ 3rd month: 5-3.5% prawn body weight
+ 4th month: 3.5-3% prawn body weight
+ 5th month: 3-2% prawn body weight
No water exchange in the first month. From the second month and onwards, 30% of pond water was exchanged
twice per month.
3.4.3.4 Collecting data
a) Water quality parameters:
Temperature, pH, Dissolved oxygen (DO), TAN, Nitrite and alkalinity were recorded 2 weeks/time.
b) Parameters on prawns:
Prawn weight, male and female ratio, egg carrying time, and ratio of berried female prawn were measured
monthly. Prawn yield (kg/ha/crop) was evaluated after harvesting. Parameters on economic efficiency were
calculated.
3.4.3 Data analysis
Data were checked, coded, input and analyzed using Excel Office 2003 and SPSS 16.0.
5
Chapter 4
RESULTS AND DISCUSSION
4.1 Status of prawn farming systems in brackish water in Mekong Delta
4.1.1 Giant fresh water prawn + rice culture (alternative black tiger shrimp) in Bac Lieu Province (M1)
4.1.1.1 Technical characteristics
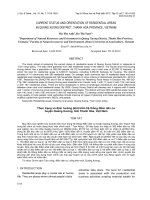
With low stocking density, simple techniques, simple feeding method and high production (110±52.7 kg/ha/crop),
this system helps diversify products and the farmer’s income (Table 4.1 and Figure 4.1)
Table 4.1 Technical characteristics of prawn- rice farming system1
Technical characteristic
Farm structure
Farm area
Ditch ratio
Ditch depth
Water level on flatform
Prawn stocking
Prawn size at stocking
Month of stocking
Stocking density
Monitoring
Salinity
Water exchange interval
Amount of water exchange
Feeding
Unit
Average
Min- Max
ha
%
m
m
2.15±1.07
29.1±5.08
0.967±0.060
0.457±0.056
0.5-5.0
20.0-45.0
0.8-1.0
0.4-0.6
cm
Lunar calendar
inds/m2
1.26±0.105
1.1-1.5
5-7
0.2-4.0
1.05±0.602
‰
5.22±1.87
2.0-10.0
days
18.3±6.23
15.0-30.0
%/time
28.0±6.84
20.0-50.0
No feeding or only supplementation
Harvest
Culture period
Size at harvesting
Total production
Month
7.18±1.11
G/inds.
47.9±10.9
kg/househol 235±113
d/crop
Productivity
kg/ha/crop
110±52.7
Survival rate
%
18.5±8.38
Note: all the data was shown Mean value± standard deviation
Month
Black tiger
shrimp
Giant fresh
water prawn
Rice
1
2
3
4
5
6
7
8
6.0-8.0
31.2-71.4
100-600
50-300
4.9-40.0
9
10
11
12
Fig. 4.1 Cropping seasons of the prawn-rice-shrimp farming system
4.1.1.2 Economical efficiency of giant fresh water prawn + rice - tiger shrimp (M1)
In this system, production cost and gross income of shrimp and rice was higher than prawn. However, the B/C ratio
of these crops were lower than that of prawn (Table 4.2). With 50.9 million/ha/year in total net income, tiger
shrimp, rice and prawn accounted for 44.9%. 32.4% and 22.7%, respectively. This showed various products and the
important role of prawn in this system.
6
Table 4.2: Economical efficiency of prawn-rice- shrimp farming system1
Criteria
Giant Fresh Tiger shrimp Rice
Total
water prawn
Unit (Million/household/year)
Total
7.80±5.40
32.4±13.9
30.0±13.8
70.3±30.6
production cost (2.4-28.3)
(10.0-70.0)
(11.0-60.0)
(27.2-158)
Gross income
32±14.8
85.6±42.2
70.0±33.9
188±84.6
(12-67.5)
(30.0-200)
(24.0-150)
(75.0-405)
Net income
24.4±11.5
53.1±28.9
40.0±20.3
118±54.8
(8.10-54.1)
(20.0-130)
(13.0-90.0)
(44.1-266)
Unit (Million/ha/year)
Total
3.50±2.30
14.2±2.90
12.6±0.982
30.5±4.8
production cost (0.71-13.1)
(10.0-25.0)
(10.0-16.6)
(23.7-47.10)
Gross income
15.1±8.40
37.1±8.50
29.1±1.60
81.4±14.6
(6.00-51.0)
(22.8-60.0)
(23.7-36.6)
(61.7-131)
Net income
11.5±6.80
22.8±6.10
16.5±1.40
50.9±10.6
(3.10-37.9)
(12.5-36.6)
(12.5-20.0)
(33.7-90.0)
B/C (%)
390±206
160±28
130±15
170±20
(60-790)
(100-200)
(100-180)
(120-260)
Note: All the data shows mean value± standard deviation (min- max)
4.1.1.3 Regression analysis in the influence of technical factors to the efficiency of the system1
Prawn yield (Y, kg/ha) in the system is effected significantly with 5 factors, including X1: Years of culture
experience (years), X2: stocking density (inds/m2); X3: culture period (months); X4: survival rate (%); X5:
harvesting size of prawn (g). Regression is showed as the follow:
Y = -99,37+ 3 X1 +68 X2 - 2X3 + 4,0 X4+1,2 X5 (1)
(R= 0,85; R2= 0,72; P=0,00)
Net income (1000VND/ha/crop) in the system is effected significantly with 5 factors, including:
Y = 545 X1 + 5 X2+ 958 X3 - 2.301 X4 + 132 X5 + 1.923
(R= 0,62; R2= 0,4; P=0,00)
Where: Y1: Net income (1000VND/ha);X1: Time of experience (Years);X2: Stocking density (inds/m2); X3:
Supplementary feeding ;X4: Culture period (months);X5: seling price (1000VND/kg)
i) Effect of salinity on efficiency of prawn-rice-shrimp farming system
The study indicated the potential of culturing fresh water prawn in brackish water with 10‰ of salinity (Table 4.3).
Table 4.3: Effects of salinity on technical factors and the efficiency of prawn-rice-shrimp farming system1
Criteria
2
Average salinity
to 5‰
> 5 to 10‰
(n=37)
(n=23)
Time for stocking (lunar calendar month)
6.0±0.1a
6.4±0.2b
a
Size of postlarvae (cm)
1.23±0.02
1.28±0.02a
b
Culture period (Months)
7.7±0.548
6.8±0.902a
a
Prawn size at harvesting (g)
48.5±11.7
47.1±9.69a
a
Survival rate (%)
18.7±8.56
18.2±8.28a
a
Yield (kg/ha/Crop)
117±50.6
99.7±55.5a
a
Total production cost (Million VND/ha/crop)
4.00±2.00
2.80±2.64a
a
Total gross income (million VND/ha/crop)
16.3±7.80
13.3±9.00a
a
Net income (million VND/ha/crop)
12.2±6.70
10.4±6.80a
a
B/C ratio (%)
340±162
470±244b
Note: Values in the same row with the same superscript are not significantly different (p>0.05)
Correction between salinity and ratio of Benefic/cost as the following equation: y = 3.26 Ln(x) - 1.11 (r2 = 0.37;
p=0.00) (Fig. 4.2)
7
B/C ratio %)
Salinity (%o)
Fig 4.2: Corelation between salinity and B/C ratio
ii) Effects of other factors to efficiency of prawn culture in the systems1
Besides above technical factors, effects of other factors on production efficiency are presented in Table 4.4.
Nursing is one of the key factors contributing to improvement of yield and profit although the difference was not
statistically significant (p> 0.05), but B/C ratio was significantly higher (p <0.05). Prawn culture supplemented
with feed have significantly higher productivity and profits (p <0.05) compared with those without feeding (Table
4.5).
Table 4.4: Some technical factors affecting the productivity and economical efficiency of prawn culture of the
prawn-rice-shrimp farming systems
Technical factors
Criteria for evaluating
Yield
Survival
(kg/ha/cro
rate (%)
p)
Net
income
(1.000đ/ha/Cro
p)
B/C ratio
(%)
1. Seed source
Local
hatcheries 19.1±8.54ª 120±66.7ª 13.1±7.34ª
390±180ª
(n=12; 20%)
Other
provinces 18.3±8.43ª 108±49.1ª
11.2±6.65ª
390±210ª
(n=48; 80%)
2. Nursing
Nursing
(n=18; 18.7±9.06ª 129±55.0ª 13.0±7.50ª
430±220b
30%)
Without
Nursing 18.4±8.19ª 102±50.2ª 10.9±6.50ª
290±120ª
(n=42; 70%)
3. Feeding
Supplementary
18.5±9.08ª 128±63.3b 13.4±8.70b
430±160ª
feeding (n=30; 50%)
No feeding (n=30; 18.4±7.78ª 92.4±31.5 9.70±3.30ª
360±290ª
50%)
ª
4. Harvest
Partial
harvesting 18.9±7.18ª 144±37.9b 13.9±7.77ª
430±206b
(n=14; 23.3%)
Without
harvest 18.3±8.79ª 99.6±52.4 10.8±8.50
250±132ª
(n=46; 76.7%)
ª
Values with the same superscript within the same column are not significantly different (p>0.05)
Table 4.5: Effects of culture period on the efficiency of the prawn culture in the prawn-rice-shrimp farming system
Culture period (months)
Criteria
6
7
8
Survival rate (%)
Yield (kg / ha / crop)
Production cost (million VND / ha)
23.0±1.9b
95.1±9.3a
1.79±0.197a
16.4±2.9a
112±31.3a
4.10±1.30b
17.3±1.4ab
115±7.4a
4.16±0.320b
Gross income (million VND / ha)
12.1±1.08a
16.7±4.92a
11.8±1.07a
Net income (million VND / ha)
10.3±0.94a
12.6±3.69a
11.8±1.07a
B/C ratio (%)
60±0.5b
36±0.6a
31±1.2a
Values in the same row with the same superscript are not significantly different (p>0.05)
In summary, the prawn -rice –shrimp farming system on the field helped in improving income, maintaining and
developing rice farming, contributing to food security, and environmental protection.
8
4.1.2 Status of semi-intensive prawn culture in ponds alternatively with shrimp in Tra Vinh (Prawn- shrimp
farming system) (MH2)
The combination of prawn farming in this model contributes to diversifying the cultured species, reducing over
development of tiger shrimp, minimizing the risk of disease pathogen spread of shrimp farming, minimizing risk in
income loss, and promoting the farming in the future. Information on technical and financial performance of the
system is presented in Figure 4.3; Table 4.6 and Table 4.7.
Month
1
2
3
4
5
6
7
8
9
10
11
12
Tiger shrimp
Giant fresh water prawn
Fig. 4.3 Cropping seasons of the prawn-shrimp farming system
Table 4.6: Technical characteristics of semi-intensive prawn culture (alternative with tiger shrimp)
Technical characteristics
Unit
Average
Min-Max
Pond
Pond area
ha
0.6±0.588
0.2-4.2
Pond depth
M
1.32±0.108
1.0-1.5
Liming
kg/ha
39.3±4.9
0-125
Prawn stocking
Size of post larvae
Cm
1.21±0.068
1.1-1.5
Month of stocking
Lunar calendar
4-8
Stocking density
Inds./m2
8.97±3.58
2.8-15.6
Management
Feeding
Commercial feed combined with homemade food and trash fish
Water salinity
‰
5.0±2.19
1.0-10.0
Water exchange
Time/day
20.1±7.20
15-30
Water exchange rate
%/time
27.4±7.47
10-50
Culture period
Months
5.6±0.7
3-6
Harvest
Prawn size at harvest
G
34.9±9.23
18.2-58.8
Production
kg/crop/household
594±474
100-2.500
Yield
kg / ha / crop
886±642
125-2.812
Survival rate
%
28.2±14.6
4.0-58.8
All the data was shown as average value± standard deviation (min- max)
Table 4.7: Economical efficiency of prawn-rice-shrimp farming system
Criteria
Freshwater prawn
Tiger shrimp
Total
Unit (million / household / year)
Production
40,6±31.5
91.0±90.8
138±96.7
cost
(4.60-151)
(3.50-300)
(21.3-353)
Gross income 82.5±69.5
144±16.0
226±185
(14.0-330)
(0-600)
(17.0-660)
Net income
42.0±51.5
53.0±77.4
95.0±103
(106-197)
(8.00-300)
(156-328)
Unit (million / ha / year)
Production
59.4±37.1
149±158
208±164
cost
(18.0-176)
(5.6-667)
(26.6-735)
Gross income 127±104
234±271
362±309
(21.3-478)
(0-1.040)
(23.1-1.300)
Net income
68.0±86.9
86.0±12.8
154±174
(152-393)
(0,10-440)
(223-611)
B/C ratio (%) 120±100
40±80
70±60
(90-460)
(100-230)
(90-260)
All the data was shown as mean value± standard deviation (min- max)
9
I) Multiple regression analysis of the influence of technical factors to effectively of prawn culture systems
Yield and profit of prawn farming systems in Tra Vinh province depended on many factors as the following
equation:
- Factors effecting prawn yield
Y= 25 X1 + 103 X + 2,7 X3 + 31 X4 + 31 X5 - 2.151 (1)
( R= 0,94; R2=0,88; p=0,00) (1)
Where: Y1: Yield (kg/ha)
X1: Time of experience (years); X2: Stocking density (ind/m2); X3: Culture period (months); X4: Survival
rate (%); X5: Harvesting size (g)
- Factors effecting net income
Y2 = 11.489 X1 + 10.967 X2 - 2.627 X3 - 248 X4 + 36.052 X5 + 332 X6 + 3.751 X7 - 9 X8 + 120.186 (2)
(R2=0,558; R = 0,747; P=0,00)
Where: Y1: Net income (1000VND/ha/crop);X1: Time of experience (Years);X2: Stocking density (inds/m2);
X3: Seed price (VND/postlarve) ;X4: Lime using (kg/ha);X5: Culture period (months); X6: Seling price
(1000VND/kg); X7: Harvesting size (g); X8:chemiscal using (kg/ha)
ii)The impact of farming region on productivity and financial efficiency
There is difference between farming regions in environmental conditions, technical and financial performance,
although in many cases, the difference was not statistically significant (p> 0.05). (Table 4.8).
Table 4.8: The impact of farming areas on the efficiency of prawn farming system2
Tra Cu
Duyen Hai
Criteria
(n=16)
(n=22)
Pond area (ha)
0,619±0,306a 0,655±0,834a
Density (ind/m2)
9,37±2,41a
8,25±4,07a
o
b
Average salinity ( /oo)
7,17±1,45
3,77±1,47a
b
Culture period (month)
5,72±0,407
5,64±0,743ab
a
Size of prawn (g /ind)
35,8±7,45
36,3±9,38a
a
Survival rate (%)
30,5±13,6
23,8±13,1a
Yield (kg / ha / crop)
1.000±634a
732±724a
a
Total cost (million VND / ha / crop)
57,9±29,4
51,7±36,5a
a
Total gross income (million VND / ha / crop)
144±103
108±120a
Cau Ngang
(n=10)
0,430±0,1a
11,1±4,50a
3,50±1,52a
5,20±0,919a
30,9±11,4a
34,3±18,0a
937±441a
78,7±45,7a
144±61,3a
Profit (million VND / ha / crop)
Profit index (%)
Percentage of households with profit(%)
86,0±80,2a
145±84,9a
100
56,0±94,2a
90,1±109a
86,4
65,0±84,0a
128±97,4a
80,0
Percentage of households with losses (%)
0
13,6
20,0
Values in the same column with the same superscript are not significantly different (p>0.05)
4.1.2.5 Comparison of technical and financial aspects of prawn farming system in 2010 and 2013 (system2)
There is no significant difference in technological factors of prawn farming in 2010 and 2013, which requires
further research to study, innovate and apply technology for prawn farming region, improved the income of
farmers.
Table 4.9: Technical factors prawn farming in 2010 and 2013 (system2)
Technical Information
Unit
2010
2013
The total area
Ha
0,731±0,512a
0,744±0,450a
a
Pond area
ha
0,350±0,141
0,453±0,247a
a
Lime using
kg/ha
24,4±5,12
46,4±28,6b
a
Water depth
m
1,1±0,020
1,2±0,12a
a
Stocking time
Lunar calendar 5-8
5-8a
2
a
Stocking density
Ind/m
4,8±1,53
7,8±3,89b
a
Stocking salinity
‰
4,3±2,17
5,0±2,87a
Culture period
Month
6
6
Size of harvest prawn
g/Ind
40,5±8,60a
37,9±9,12a
a
Yield
kg / ha / crop
847±370
854±702a
Values in the same column with the same superscript are not significantly different (p>0.05)
In summary, the rotational freshwater prawn-tiger shrimp farming systems can be applied in high salinity regions
(up to 4 ‰ or higher), where is impossible to cultivate rice crop. The culturing freshwater prawn in the rainy season
could help to avoid breaking out of diseases because there is no continuous culture of a special species, and also
avoid wasting ponds in case of prawn culture was only conducted in the dry season. The results showed that further
studies need to be carried out for technical innovation and the stability of the prawn farming system.
10
4.2 Study on the effect of different salinities on biological parameters of prawns culturing in tanks
4.2.2 Effects of different salinities on biological parameters of prawns culturing in population
4.2.2.1 The survival rate of prawns after 120 days of culture
The lowest survival rate of prawns was recorded in the control treatment at 0‰ of salinity, the highest survival rate
was showed in treatments at 10‰ of salinity, and there were significantly different between treatments (p <0.05).
The results indicated that brackish water prawn culture (from 5‰ to 15‰ of salinity) showed higher survival rate
comparing to freshwater prawn culture.
4.2.2.2 Growth of prawns
The growth rates of prawns in weight and length were not significantly different between treatments (p>0.05)
(Table 4.10 and Table 4.11).
Table 4.10. The growth rate of prawn in weight after 120 days of culture
Treatments
0‰
5‰
Initial weight (g)
0.34±0.02
0.34±0.02
Final weight (g)
14.94±1.25a
14.15±1.29a
DWG (g/day)
0.122±0.010a
0.115±0.011a
SGR (%/day)
2.96±0.09a
2.88±0.10a
10‰
0.34±0.02
13.79±1.23a
0.112±0.010a
2.85±0.10a
15‰
0.34±0.02
12.93±1.15a
0.105±0.010a
2.82±0.09a
Notes: The average value ± standard error. The mean values in the same column with the same superscript were not
statistically significant differences (p >0.05.)
Table 4.11. The growth rate of prawn in length after 120 days of culture
Treatments
Initial length
(cm)
Final
(cm)
0‰
2.52±0.05
5‰
10‰
length
DLG
(cm/day)
SGR_L
(%/day)
8.00±0.24a
0.046±0.002a
0.94±0.03a
2.52±0.05
7.85±0.23a
0.044±0.002a
0.93±0.03a
2.52±0.05
8.17±0.24a
0.044±0.002a
0.92±0.03a
15‰
2.52±0.05
7.73±0.22a
0.043±0.002a
0.91±0.02a
Note: Values in the table were mean ± standard error. The mean values in the same column with the same superscript were not
statistically significant differences (p >0.05.)
4.2.4 Reproductive parameters of giant freshwater prawn
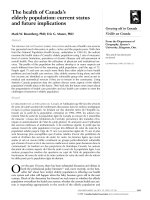
4.2.4.1 The percentage of ovigerous female
The percentage of ovigerous female resulted in the highest percentage at 0‰ and lowest at 10‰ of salinity. The
prawn spawning in high salinity condition (10-15‰ of salinity) slowly occurred and showed lower fecundity
compared to lower salinity condition (0-5‰ of salinity) (Figure 4.4).
(%)
trứngratio
tôm mang
Tỉ lệ berried
Egg
prawn
(%)
100
80
60
a
0‰
5‰
10‰
15‰
a
a
a
a
40
a
b
20
a
b
a
0
30
60
90
120
Thời gian
(ngày)
Culture
periodnuôi
(days)
Figure 4.4: Percentage of egg berried female during culture period
11
4.2.5 Fecundity of prawns
The treatment at 10-15‰ of salinity showed a slower spawning and lower fecundity; the absolute and relatively
fecundity at 10-15% were lower than treatments at 0-5‰ of salinity. The results were very important to brackish
water prawn culture. It helped to reduce the early maturation of prawns, improve growth rate, yield, prawn quality
and financial efficiency in the system (Table 4.12)
.
Table 4.12 Fecundity of prawns cultured at different salinities
Reproductive parameter
Weight of berried prawn (g) Absolute fecundity (Number Relative
fecundity
of eggs/berried prawn)
(Number of eggs/g)
After 60 days of culture
0‰
5‰
9.03
8.400
930
10‰
7.44±0.25
2.940±255
395±21.2
15‰
After 90 days of culture
0‰
12.6±2.81a
16.154±6.440a
a
5‰
11.7±2.56
17.043±6.302a
10‰
11.2±2.08a
10.747±5.002b
a
15‰
14.3±0.49
16.360±2.885a
After 120 days of culture
0‰
14.9±2.64a
19.347±6.116a
a
5‰
13.5±3.08
21.920±7.542a
a
10‰
13.0±3.81
8.875±3.343b
15‰
13.5±2.09a
10.567±4.426b
Note: The values were shown in the table were mean and standard deviations. The mean
same superscript were not statistically significant differences (p >0.05.)
(-): No ovigerous prawns.
1.256±360a
1.419±360a
929±342b
1.159±181ab
1.328±442a
1.604±442a
909±242b
769±264b
values in the same column with the
4.2.6 Biochemical composition of prawn meat after 120 days of culture
The protein content of prawn meat showed the highest level at 5‰ treatment, and it’s significantly different
compared to other treatments. The results showed that prawn culturing in high salinity up to 15‰ did not affect on
the quality of prawns (Table 4:13).
Table 4.13 Biochemical composition of prawn meat at different salinities
Treatments
0‰
5‰
10‰
15‰
Moisture (%)
protein(%)
70.6±0.82a
16.0±0.10a
68.7±0.61a
17.8±0.31b
69.0±0.76a
17.1±0.29ab
71.1±0.89a
16.1±0.28a
Ash(%)
5.80±0.77a
5.53±0.58a
5.47±0.49a
5.18±1.00a
Fat (%)
3.05±0.22a
3.76±0.41a
3.61±0.26a
2.84±0.34a
Carbohydrate (%)
4.57
4.20
4.80
4.80
Energy (kJ/g)
21.7±0.08
a
22.6±0.24
a
23.9±0.19
a
23.6±0.15a
Note: The values were shown in the table are mean and standard deviations. The mean values in the same row with the same
superscript were not significantly different (p >0.05).
4.2.7 Characteristics of blood physiology (Osmotic Pressure-OM) of prawns
At treatments 0-15‰ of salinity, prawns were in hypertonic osmotic pressure condition, especially in treatments
with salinity from 0-10‰ because of high OM disparity (Table 4:14).
12
Table 4.14 Osmotic Pressure of prawn blood at different salinities
Treatments
Water sample
After 60 days
After 90 days
0‰
3.00±4.71a
463±33.0a
5‰
228±91.2b
458±53.5a
10‰
311±57.1b
468±74.2a
15‰
424±152c
439±49.3a
464±28.5a
466±35.5a
459±31.7a
474±20.5a
a
ab
c
After 120 days
421±35.0
450±37.2
514±27.8
465±63.9bc
Note: The values were shown in the table were mean and standard deviations. The mean values in the same row with the same
superscript were not statistically significant differences (p >0.05.)
In conclusion, the results of culturing prawns in tanks with different salinities (0, 5, 10 and 15‰) were not
statistically significant (p>0.05) in growth rate, biomass, biochemical and physiological parameters. However, the
survival rate of prawns in brackish water was higher than freshwater culture, the protein of prawn muscle at 5-10‰
was higher than 0‰. Especially, in brackish water, prawn maturation was slower, absolute and relatively fecundity
were lower than freshwater culture.
4.3 The effects of salinity on growth rate, molting, reproduction and survival rate of giant freshwater prawn
in individual culture
4.3.1 Prawn molting
Among treatments, the molting cycle of prawn at 0‰ of salinity was shorter than others, especially in the first five
cycle. However, no significant difference was recorded at the end of experiments. The 0‰ treatment showed the
highest number of molting cycle (10 cycles) and molting duration was ranged from 7.7-21.2 days. At 5‰, 10‰,
15‰, the number of molting cycle were 8-9, with 8.9-23.4 days of molting duration (Figure 4.5)
Số ngày giữa 2 lần lột xác (ngày).
Days of molting duration (days)
35
0‰
5‰
10‰
15‰
30
25
20
15
10
5
0
1
2
3
4
5
6
7
8
9
10
Lần lột xác (lần)
The number of molting cycles (cycle)
Figure 4.5: Molting cycle of prawns during culture period between treatments
4.3.2 Percentage of egg berried prawn
In low salinity condition, the prawn showed early maturation and high fecundity. Especially, at 15‰, there was no
record for ovigerous prawn after 120 days of culture. The result showed that salinity has an effect on prawn
maturation in individual culture model (Figure 4.6), also indicated the potential application of commercial brackish
water prawn culture because of reducing early maturation and increasing growth rate.
56,3
Tỷ lệ tôm mang trứng (%)
Ratio of egg berried prawn (%)
60
50,0
0‰
5‰
10‰
15‰
50
40
30
48,5
39,4
29,6
25,9
20
10
3,1
6,1
0
30
60
90
120
gian nuôi (ngày)
Culture periodThời
(days)
Figure 4.6: Percentage of egg berried females during culture period
13
4.3.3. Spawning cycle and fecundity of prawn
The salinity at 0, 5, 10 and 15‰ had effects on the percentage of ovigerous females, spawning cycle and fecundity.
In high salinity condition, prawn showed low spawning, prolong re-matured cycle and reproduction, low fecundity
compared to freshwater treatment (Figure 4.15).
The results showed that brackish water prawn culture could get more benefits, especially in Mekong Delta where is
abundant in brackish water areas. From the results of the population and individual prawn culture, there are
required further experiments in brackish ponds husbandry to access more detail efficiency.
Table 4.15: Spawning cycle and fecundity of prawn after 120 days of culture
Salinity Number of (*)
Berried female
(‰)
spawning
Spawning ((ind)
time (day)
0
5
10
Weight of
berried
prawn (g)
Absolute fecundity (Number Relative fecundity
of eggs/berried prawn
(Number of eggs/g)
1
98±16
24
8.55±2.01
3.180±1.397
367±143
2
24±6
14
9.50±2.08
4.107±1.499
429±135
3
4
16±11
-
2
-
12.4±0.09
-
5.640±984
-
456±83
-
1
86±17
21
9.97±3.13
4.080±1.352
410±83
2
25±11
12
11.5±3.72
4.573±1.679
401±103
3
24±1
5
12.4±1.57
4.339±876
347±39
4
25±4
2
13.6±0.23
5.040±136
371±14
1
108±20
12
8.73±2.65
3.006±1159
339±58
2
30±12
3
10.6±1.61
3.616±436
342±24
3
4
25±0
-
1
-
13,7
-
5.136
-
375
-
15
Note: (*) The first spawning and next spawning cycle (day); Values in the table were mean and standard deviation, and (-)
means no ovigerous prawn
4.4 The practice of culturing prawn in pond in Tra Vinh
4.4.1 Salinity in culture ponds in Tra Vinh
Ponds in Cau Ngang were recorded with the lowest salinity (3.36‰) followed by Tra Cu (4.14‰) and Duyen Hai
showed the highest salinity at 6.33 ‰. Most of surveyed ponds were stocked prawn year round, except Tra Cu,
after 150 days of culture the salinity was dropped down to 0‰ (Figure 4.7). During culture period, temperature,
pH, alkalinity, dissolved oxygen, TAN and nitrite were in acceptable range for the growth of prawns.
12
Cầu Ngang
Trà Cú
Duyên Hải
Độ mặn (‰)
Salinity (‰)
10
8
6
4
2
0
15
30
45
60
75
90
105
120
135
150
165
180
Thời gian nuôi (ngày)
Culture period (days)
Figure 4.7: Variation of salinity in cultured ponds at different sites
14
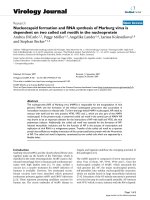
4.4.2 Growth of prawn cultured in ponds
Within studied salinity range, in high salinity condition, the prawn showed higher growth rates and bigger size
compared to low salinity condition (Table 4.16). The salinity in pond at different sites could be the most important
factor affecting to growth rate and productivity of prawn. Figure 4.8 depicts the high correlation between salinity
and productivity
Table 4.16: The growth rate of prawn after 180 days of culture
Site
Wi (g/ind) Wf (g/ind)
DWG (g/day)
SGR (%/day)
Cau Ngang
0.02
26.5±9.27a
0.15±0.01a
3.99±0.03a
b
b
Tra Cu
0.02
36.1±15.80
0.20±0.01
4.16±0.02b
b
c
Duyen Hai
0.02
39.5±15.71
0.22±0.01
4.21±0.03b
Note: Wi: Initial weight of prawn, Wf: final weight of prawn when harvest. Value in the table were mean and standard
deviation.
The mean values in the same column with the same superscript were not statistically significant differences (p >0.05.)
Khối lượng tôm (g/con).
Body weight (g)
45
40
35
0,5289
y = 15,253x
2
R = 0,6817
(p=0,006)
30
25
20
2
3
4
5
6
7
Độ mặn (ppt)
Salinity (‰)
Figure 4.8: Correlation between salinity and prawn weight after 180 days of culture
4.4.3 Percentage of egg berried prawn:
(%)
prawn
berried
of eggof
RatioRatio
(%)
prawn
berried
The percentage of ovigerous prawn has followed the results from tank experiments as lower percentages of
ovigerous females in higher salinity condition (Figure 4.10).
Culture Culture
periodperiod
(days)(days)
Figure 4.10: Percentage of ovigerous prawn in cultured ponds
Note: Superscript (a, b) at the same day of culture indicate the significant differences (p<0.05)
15
4.4.4 Survival rate, productivity, FCR and financial efficiency of cultured pond in different sites
The prawn showed the highest survival rate in low salinity sites (Cau Ngang) compared to high salinity sites
(Duyen Hai, Tra Cu). However, productivity and profit from Duyen Hai and Tra Cu sites were significantly higher
than Cau Ngang (Table 4.17 and 4.18).
Table 4.17: Survival rate, productivity of prawn after 180 days of culture
Site
Cau Ngang
Tra Cu
Survival rate (%)
53.3±1.24b
44.4±6.40
a
FCR
Productivity
(kg/ha)
988±33.1a
1.269±48.5
ab
b
2.05±0.08b
1.73±0.12a
b
1.59±0.13a
Duyen Hai
48.5±2.03
1.342±69.7
Note: FCR: Feed conversion ratio. The values in the table were mean and standard deviation. The mean values in the same
column with the same superscript were not statistically significant differences (p >0.05)
Table 4.18: Financial efficiency of prawn at different districts in Tra Vinh
Site
Cau Ngang
Duyen Hai
Tra Cu
Total cost (million VND /ha)
93.7±2.70a
98.4±3.50a
96.6±1.8a
a
b
Total income (million VND 168±5.60
254±9.70
/ha)
295±15.3c
a
b
Profit (VND million/ha)
74.2±4.50
156±10.6
199±17.0c
a
b
Profit index (%)
79.2±4.90a
158±13.7
206±27.6c
Note: Values in the table were mean and standard deviation. The mean values in the same row with the same superscript were
not statistically significant differences (p >0.05.)
Feed cost accounted the highest percentage, followed by labor cost because culture period was conducted for 6
months, and seed cost is the next (Table 4.19)
Table 4.1: Cost ratio of prawn cultured in ponds at different sites
Cost ratio (%)
Lime,
drug
chemical
Seed
Feed
Labor
Others
and
Cau Ngang
1.87
Tra Cu
1.78
Duyen Hai
1.81
17.2
60.4
19.2
1.33
16.4
62.3
18.3
1.27
16.7
61.6
18.6
1.29
16
Chapter 5
CONCLUSIONS - RECOMMENDATION
Conclusion
1. The surveyed results in Bac Lieu and Tra Vinh showed that prawn culture accounted a small index in the
total cost of the whole system, but it resulted in a good income index contributing to improving total income. The
high financial efficiency of prawn culture is an important platform to promote and develop this system.
2. There were several advantages from brackish water prawn culture such as less diseases, suitable water
environment, easy feeding beside some difficulties, especially quantity and quality of seed supply.
3. The results of survey, experiments, and husbandry practice of prawn culture with different salinities in
different sites have showed that there was no significant difference in growth rates between brackish (5 - 15‰) and
freshwater culture (p>0,05)
4. The results from prawn culture in tanks and husbandry practice in ponds showed slow maturation,
spawning, re-mature and low fecundity in high salinity condition compared to freshwater culture.
5. In brackish water environment, survival rate and biomass of prawn after 120 days of culture were not
significantly different (p>0.05). At the same size, brackish water prawn showed the higher weight than fresh water
prawn. Protein of prawn muscle at 5% of salinity was greater than others.
6. Semi-intensive prawn culture in ponds resulted that the growth rate, productivity, and financial efficiency
in high salinity condition are higher than low salinity
17
Recommendations
1. Continue to complete the technology of prawn culture in monoculture, integrated or polyculture with other
species in different regions and salt intrusion level.
2. Study to produce prawn seed in the rainy season to ensure sufficiently supply for farmers, especially from May
to July Lunar calendar.
3. More detail access on prawn quality in different salinity environments in ponds to develop the commercial
brand.
4. Find solutions for prawn consumption, processing, exporting when conducting on a large scale.
18
LIST OF PUBLISHED PAPERS
1. Huynh Kim Huong, Lai Phuoc Son, Le Quoc Viet, Do Thi Thanh Huong, Tran Ngoc Hai, 2015. The effect of
salinities on molting cycle, spawning and growth of giant freshwater prawn (Macrobrachium rosenbergii).
Journal of Science, Can Tho University, Vol 38: page 35-43.
2. Huynh Kim Huong, Le Quoc Viet, Do Thi Thanh Huong, Tran Ngoc Hai, Trials on prawn (Macrobrachium
rosenbergii) culture in brackish water area of Trà Vinh province. Science and Technology Journal of
Agricultural and Rural Development, Vol 13, page 91- 97
3. Huynh Kim Huong, Le Quoc Viet, Do Thi Thanh Huong, Tran Ngoc Hai. Analysis technical and financial
aspects of prawn-rice rotational system in brackish water area in Bac Lieu. This journal was accepted by
Journal of Science, Can Tho Univesity.
.
19