FINAL plastics the facts 2013
Bạn đang xem bản rút gọn của tài liệu. Xem và tải ngay bản đầy đủ của tài liệu tại đây (934.75 KB, 40 trang )
Plastics – the Facts 2013
An analysis of European latest plastics
production, demand and waste data
The data presented in this report was collected by PlasticsEurope (the Association of Plastics
Manufacturers in Europe), EuPC (the European Plastics Converters), Plastics Recyclers Europe and
EPRO (the European Association of Plastics Recycling and Recovery Organisations). PlasticsEurope’s
Market Research and Statistics Group (PEMRG) provided input on the production of and demand for
plastics raw materials. Consultic Marketing & Industrieberatung GmbH helped assess waste
generation and recovery data. Official statistics from European or national authorities and waste
management organisations have been used for recovery and trade data, where available.
Research or expertise from consultants completed gaps.
Figures cannot always be directly compared with those of previous years due to changes in estimates.
Some estimates from previous years have been revised in order to track progress, e.g. for use and
recovery of plastics across Europe over the past decade.
All figures and graphs in this report show data for EU-27 plus Norway and Switzerland, which is referred
to as Europe for the purposes of abbreviation – other country groups are explicitly listed.
A success story
A success story
1850
Celluloid
Versatile and highly inflammable
material made of cellulose which
was used for the production of
the first films but also jewellery.
1970
1st plastic
Offering lightweight,
high shock absorption and bumpers
esthetic performance.
1939
Nylon
1907
Bakelite
The world’s first truly synthetic
fibre offering durability.
The robust phenolic resin
was used for the production
of telephones, radios and
light switches for instance.
Courtesy of DuPont
2013
Plastic prostheses
2
Thanks to plastics, we can push
our limits much further.
Introduction
Plastics – the Facts is an analysis of the latest data
related to the production, demand and waste
management of plastics materials.
It provides the latest business information on
production and demand, trade, recovery as well as
employment and turnover in the plastics industry.
In short, this report gives an insight into the industry’s contribution to European economic growth and
prosperity throughout the life cycle of the material.
In 2012, the plastics industry including plastics
producers, plastics converters and the plastics
machinery accounted for an estimated 1.4 million
jobs in the European Union’s 27 Member States and
had a combined turnover of above 300 billion euro.
With more than 62,000 companies in operation in
the EU, plastics not only enable modern lifestyles,
the material also contributes to research and
innovation, to higher standards of living and the
overall welfare of the European citizens.
In the second half of the 20th century, plastics
became one of the most universally-used and multipurpose materials in the global economy. Today,
plastics are utilised in more and more applications
and they have become essential to our modern
economy. The plastics industry has benefited from
50 years of growth with a year on year expansion of
8.7% from 1950 to 2012.
Plastics have become an essential part of our
modern lifestyle. Without plastics, we would not be
able to enjoy LCD flat screen televisions or touchscreen smartphones and tablets! We would not be
able to practice most sports either, since a wide
range of equipment and outfits are made of plastics,
including balls, boots, racquets, helmets, skis, surf
boards, swimming or diving suits while plastic
prostheses which replace body parts enable athletes
to compete to the highest levels of their sport. Even
Formula 1 cars are built with plastics parts to boost
their performance! And in Paralympics Games,
plastic prostheses which replace body parts make it
possible for many athletes to compete.
In the medical and safety area, plastics are enabling
major breakthroughs. The latest medical techniques
use plastics to unblock blood vessels, develop
artificial corneas or hearing devices to name but a
few. Plastics are indispensable for protection
equipment such as helmets, firemen suits or bullet
proof jackets. Plastics have made it possible for us
to push the limits and go further, faster and safer
than we have dared to go before.
3
Plastics
and growth
Plastics
and growth
The European plastics industry: a pillar of economics and society
Tax and social
security costs
20.3 bn €
An industry generating
about 26.6 billion euro for
public finance and welfare.
~ 26.6 bn €
6.3 bn €
Corporate tax
Estimated data for EU-27 (excl. N/CH), 2012
Source: Consultic
bn €
Nº of employees
250
1,400
1,263.4
201.8
200
1,200
1,000
150
800
86.7
400
200
6
Figure 1: Development of sales and employment in EU-27 2006 – 2012
Source: Eurostat
Plastics producing
Plastics converting
11
20
10
20
20
09
08
20
6
20
0
Sales (bn €)
07
year
2
20
1
11
20
0
20
1
09
20
8
20
0
07
20
6
20
0
Plastics producing
Plastics converting
0
20
year
0
138.6
2
50
20
1
100
Number of employees (in 1,000)
The European plastics industry in figures
In 2012, the European plastics industry, including
plastics producers, plastics converters and the
plastics machinery sector, employed more than
1.4 million people.
The relatively modest growth in 2012 compared to
2011 is mainly due to the continuing recession in
Southern European countries as well as significant
declines in manufacturing production which lead to
a 0.3% contraction in terms of GDP in the European
economy.
Although 2009 witnessed a fall in the number of
employees as the industry as a whole faced the
consequences of the global financial crisis, its
labour force is now growing and approximately
30,000 new jobs have been created.
These figures are another proof that the European
plastics sector is slowly but steadily recovering.
Moreover, competition in the industry is constantly
growing and plastics markets are increasingly
shifting towards Asia and specially China. This shift
of the market combined with a stricter European
regulatory framework adds to the challenge the
European plastics industry faces to maintain its
level of competitiveness.
Employment and sales
In terms of turnover, the European plastics industry
has not yet reached pre-crisis levels and in 2012
sales volumes showed a slight decrease for both
sectors: plastics producers experienced a turnover
of 87 billion euro and converters achieved
202 billion euro in sales.
7
Plastics
market data
Plastics
market data
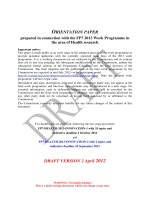
World plastics production grows
1950
1976
1989
2002
2009
2010
2011
2012
1,7
47
99
204
250
270
280
288
0,35
19,8
27,4
56,1
55
57
58
57
Mtonne
300
With continuous growth for
more than 50 years, global
production in 2012 rose to
288 million tonnes – a 2.8%
increase compared to 2011.
250
200
However in Europe, in line
with the general economic
situation, plastics production decreased by 3% from
2011 to 2012.
150
WORLD
PLASTICS
PRODUCTION
100
50
EUROPEAN
PLASTICS
PRODUCTION
year
1950
1960
1970
1980
1990
2000
2010
2020
Figure 2: World plastics production 1950-2012
10
Includes thermoplastics, polyurethanes, thermosets, elastomers, adhesives,
coatings and sealants and PP-fibers. Not included PET-, PA- and polyacryl-fibers
Source: PlasticsEurope (PEMRG) / Consultic
Europe ranks second in the global plastics production
Rest of Asia
15.8%
China
23.9%
China remains the leading
plastics producer with
23.9%, and the rest of Asia
(incl. Japan) accounts for an
additional 20.7%.
European production
(EU-27+2) accounts for
20.4% of the world’s total
production.
~241 Mtonne
Japan
4.9%
Middle East,
Africa
7.2%
NAFTA
19.9%
Latin America
4.9%
CIS
3%
Europe (EU-27+2)
20.4%
Figure 3: World plastics materials production 2012
w/o other plastics (~47 Mtonne)
Source: PlasticsEurope (PEMRG) / Consultic
11
Navigating the crisis! Demand in Europe shows a slight decrease
Austria
Belgium & Lux.
Bulgaria
Cyprus / Malta
Czech Republic
Denmark
Estonia
Finland
France
Germany
Greece
Hungary
In 2012, demand in Europe decreased by 2.5%
but there were significant differences between
the Western and Central European markets.
While Western European showed a 3% decline
in demand, Central European countries showed
a 0.6% increase.
Ireland
Italy
Latvia
Lithuania
Netherlands
Poland
There are also strong differences in terms of
market segments as Germany accounts for
about 25% of the European market and together
with Italy, France, UK, Spain and the Benelux
countries, makes up almost 75% of the total demand in the EU while Central European countries
account for about 14% of EU plastics demand.
Portugal
Romania
Slovakia
Slovenia
Spain
Sweden
United Kingdom
Norway
Switzerland
00
,0
12
00
,0
11
0
10
,0
0
00
9,
0
0
8,
00
0
7,0
0
0
00
6,
0
5,
00
0
4,
00
3,
00
0
0
00
2,
00
1,0
0
k tonne
Figure 4: European plastics demand by country (k tonne/year)
12
Source: PlasticsEurope (PEMRG) / Consultic / ECEBD
2012
2011
Plastics provide for a wide variety of markets
In Europe, packaging applications are
the largest application sector for the
plastics industry and represent 39.4%
of the total plastics demand.
39.4%
45.9
Mtonne
Building and construction is the second
largest application sector with 20.3%
of the total European demand.
Automotive is the third sector with a
share of 8.2% of the total demand.
Electrical and electronic applications
represent 5.5% of the plastics demand
and are closely followed by agricultural
applications which have a share
of 4.2%.
Other application sectors such as
appliances, household and consumer
products, furniture and medical
products comprise a total of 22.4%
of the European plastics demand.
22.4%
20.3%
8.2%
5.5%
Packaging
Automotive
Building & Construction
Electrical &
Electronics
4.2%
Agriculture Others: include sectors such
as consumer and household
appliances, furniture,
sport, health and safety
Figure 5: European plastics demand* by segment 2012
Source: PlasticsEurope (PEMRG) / Consultic / ECEBD
* EU-27+N/CH
13
Different plastics
for different needs
PE-LLD wire cables
PE-LD bags
PVC windows
PVC boots
PE-LD,
PE-LLD
PE-HD
containers
PVC
PE-HD caps
PE-HD
PET bottles
PET
Figure 6: European plastics demand* by resin type 2012
Source: PlasticsEurope (PEMRG) / Consultic / ECEBD
* EU-27+N/CH
14
PP car bumper
Most yoghurt pots
are made of PS
PS plastic cup
Office/school PP flowerpot
PP folder
PP
PUR sponge
PS glasses frame
PS, PS-E
PUR
insulation
panels
PUR
Others
ABS brick
PTFE (Teflon)
frying pan
Plastic vs. plastic
There are various types of plastics featuring different properties. The international recycling codes
(ranging from 1 to 7) which are featured on most plastic products are meant to make (unmixed) separation easy.
15
Evolution of plastics demand by resin type
PE-LD, PE-LLD
PE-HD, PE-MD
PP
PS
PS-E
PVC
PET
ABS, SAN
PMMA
PA
PC
Other ETP
PUR
Others
00
10
,0
00
9,
0
00
8,
0
00
7,0
0
00
6,
5,
00
0
0
00
4,
00
0
3,
00
0
2,
1,0
00
k tonne
2012
2011
Figure 7: European plastics demand* by resin type
16
Source: PlasticsEurope (PEMRG) / Consultic / ECEBD
* EU-27+N/CH
Plastics demand by market
Packaging
39.4%
Building &
Construction
20.3%
Automotive
8.2%
Electrical &
Electronic
5.5%
26.6%
PU
R
Ot
h
En er
g.
PC
S
PA
M
A
PM
SA
N
T
AS
A,
PE
S,
AB
PV
C
E
PS
-
PS
PP
D
PE
-H
PE
-L
D,
P
EL
LD
Others
Figure 8: European plastics demand* by segment and resin type 2012
Source: PlasticsEurope (PEMRG) / Consultic / ECEBD
* EU-27+N/CH
17
Europe is a net exporter of plastics
Mtonne, trend cycle, monthly (+ surplus, - deficit)
+1,0
+0,9
+0,8
+0,7
+0,6
+0,5
+0,4
+0,3
+0,2
+0,1
+0,0
year
2005
2006
2007
2008
Primary plastics trade balance (Extra-EU)
Plastics products trade balance (Extra-EU)
Figure 9: EU-27 plastics industry: trade balance
with non-member countries (Extra-EU)
18
Source: Eurostat
2009
2010
2011
2012
2012 data
Plastics producing sector:
• Exports 15.87 Mtonne
• Imports 7.55 Mtonne
Plastics products sector:
• Exports 2.74 Mtonne
• Imports 1.67 Mtonne
European imports and exports
Historically the European Union has always been
a net exporter of plastics materials.
Exports of primary plastics from the EU-27 to the
rest of the world increased by 2.9% in 2012.
These extra-EU exports accounted for 26.6% of the
total EU trade in primary plastics. The trade surplus
for the plastics producing industry has been volatile
in recent years and after it peaked in 2009 it has
remained at a level higher than the years before the
crisis. The biggest demand for European primary
plastics came from China (4.9%), Turkey (3.9%),
Hong Kong (2.1%), Russia (2.1%) and Switzerland
(1.5%).
The exports of converted plastics products to third
countries also increased in 2012 by 3.6% compared
to 2011. Extra-EU exports accounted for 23.2% of
the total EU trade in plastics products. Since 2011,
more market stability has been observed compared
to 2009 and 2010. In contrast to primary plastics,
the trade surplus for plastics products has
remained more or less constant from 2005 to 2012.
The biggest demand for European plastics products
came from Russia (3.0%), Switzerland (2.9%),
USA (1.7%), Turkey (1.4%) and China (1.2%).
19
Waste management data
Waste
management data
Plastics value chain: “an overview”
The diagram below shows the main steps in the life cycle of plastics – from converter demand to
disposal and recovery. Converter demand reached 45.9 million tonnes in 2012. 25.2 million tonnes
of plastics ended up in the waste stream in 2012. In 2012, post-consumer plastics waste volumes
stayed at the same level as the year before.
Energy
recovery
Converter
demand
EU-27
45.9 Mtonne
40% short
service life
7
EXPORT
\
\
7
60% long
service life
\
57 Mtonne
EXPORT
Consumer
demand
7
\
Plastics
production
EU-27
EXPORT
\
Recycling
g
6.6 Mtonne
8.9 Mtonne
26.3%
35.6%
Recovery
61.9%
Post-consumer
plastics waste
25.2 Mtonne
Disposal
\
g
38.1%
IMPORT
IMPORT
Figure 10: Life cycle of plastics in 2012 (EU-27+N/CH)
Source: PlasticsEurope (PEMRG) / Consultic
22
IMPORT
15.6 Mtonne
9.6 Mtonne
In 2012 plastics recycling and energy recovery reached 61.9%
26.3% Recycling
35.6% Energy recovery
38.1% Landfill disposal
In 2012 plastics recycling
and energy recovery rate
continues to increase.
(EU-27+N/CH)
Figure 11: Disposal, recycling and energy recovery in 2012
Source: Consultic
23