The Transformation of Escherichia coli with Deoxyribonucleic Acid isolated from Bacteriophage Adgt
Bạn đang xem bản rút gọn của tài liệu. Xem và tải ngay bản đầy đủ của tài liệu tại đây (1.7 MB, 25 trang )
J . .Mol. Biol. (1960) 2, 392-415
The Transformation of Escherichia coli with Deoxyribonucleic
Acid isolated from Bacteriophage Adgt
A.
D. KAISER AND DAVID
S.
HOGNESS
D epartment of Biochemi stry, Stanford Un iversity School of M edicine, Palo Alto,
California, U .S.A.
(Received 18 July 1960)
D eoxyribonucleic acid of Adg, isolated by phenol ex t ract ion, will transform
galactose-negative strains of Escherichia coli KI2. That the transforming agent
is indeed DNA is shown by (1) its sen sitivity to pancreatic DNase, (2) its resistance
t o anti-A antibody, (3) its resistance to heat up to the ch aracteristic melting
temperature of Adg DNA, and (4) its buoyant density of 1·71 g cm- s.
Transformation is found to occur on ly if the bacteria exposed to Adg DNA are
simultaneously infected with ordinary .\.
The t ransformin g agent appears t o be the ent ir e .\dg chromosome since the phage
gen es c and mi are also present in the gal actose-positive transformant e.
1. Introduction
This paper describes a system for the geneti c transformation of Escherichia coli K12.
R ecipient strains which are unable to metabolize galactose becau se th ey lack the
enzymes galactokinase or galact ose-I-phosphate uridyl transferase are transformed
into galactose-metabolizing strains. The transforming agent is DNA isolated from
Adg, a variant of coliphage A.
m6
I
I
0
_
dg - _
mi
c
I
J
j
I
5
10
,
15
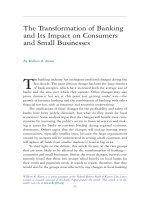
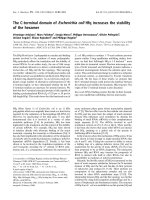
FlO. I. This linkage map shows the po sition of the " dg region" relative t o tho phage genes m.> c,
and mi. The dg region is defin ed as that part of the ,\ chromosome which is not recoverable in
a ct ive phage wh en >'dg is crossed to normal >.. Data for the size and position of dg were taken from
the ex pe rime n t s of Arber (1958). The distances are measured in recombination units whereby a
cross involving two markers separated by on e recombination unit gi ves 1 % recombinants.
Lambda is a temperate phage whose locus on the chromosome of E. coli K12 is
closely linked to the genes controlling several enzymes of galactose metabolism
(Lederberg & Lederberg, 1953). Ultraviolet irradiation of bacteria lysogenic for A
initiates synthesis and relea se of phage particles. Most of the new phage particles are
ordinary A. However, approximately one in 106 of the new particles is Adg.
Lambda dg transduces galactose genes from the bacterium in which it was produced
to the ba cterium it infects (Morse, Lederb erg & Lederberg, 1956). The transduced
galactose genes control at least the enzymes galactokinase and galactose-I -phosphate
uridyl transferase (Kalckar, Kurahashi & Jordan, 1959). Th e acquisition of galactose
tThe work r ep orted in this paper was supported by re search gr ants from the Na ti onal Institutes
of H ealth, U.S. Public Health Ser vic e.
392
TRAN SFORM ATION OF E. C O L I
393
genes by >'dg is accompanied by the loss of a part of the genet ic material pr esent in
ordi nary A. Th e region which is inactive or abs ent in >'dg, i.e., which is defective, is
indicated on a linkage map of >. given in Fig. l.
The defecti veness of Adg is expressed in t he following way . Of t he bacteria infected
wit h ordina ry >. under standard conditions, 20% become lysogenic. Unde r the same
conditions only 1% of the bacteria infect ed wit h >.dg become lysogeni c. However , if
bacteria are infected simultaneously with Adg and >., then 20% become lysogenic for
both Adg and A(Arber, 1958). Thus ordinary >. acts as a " helper" for the lysogenization
of Mg~ presumably by supplying a normal dg region.
Th e defecti veness of Adg is expressed in another way. Bact eria lysogenic for >'dg,
induced with ultraviolet light (u.v.), lyse but do not produce an y phage (Arber, 1958).
However , doubl y lysogeni c bacteria , carrying both Adg and A, induced with u.v. , lyse
and pr odu ce both Adg and A. Lambda dg can be obtained su bst antially free of ordinary
>. by density gradient centrifugation because Adg differs slightl y in buoyant density
from>. (Weigle, Meselson & Paigen , 1960).
Lambda dg would seem to be a good potential source of genetically active DNA .
The DNA complement of one >.dg particle is about 1/100 that of an E. coli cell, and
since both carry the same galact ose genes, the fraction of the DNA represented by
the genes for galactokinase and gala ctose phosphate uridyl transferase is about one
hundred-fold higher in >.dg DNA t han in E . coli DNA. Moreov er , during the purificat ion of M g, the pro t ein coat pr ot ect s it s cha rge of DNA from destruction by nucleases
released d uring cell lysis. Finally , t he knowledge of the genetic structure of A (Jacob
& Wollm an , 1954; Kaiser, 1955) and E . coli K12 (Lederberg, Leder berg, Zinder &
Liv ely , 1951 ; Wollman, J acob & Hayes, 1956) provides a basis for th e interpretation
of experiments with isolated DNA.
DNA isolated from M g is shown in t his pap er to be active in transformation .
Phenol extraction of >'dg denatures it s pr otein and releases its DNA in to aqueous
solution. Th e >.dg DNA, so pr epar ed , will tran sform st ra ins of E . coli K12 which lack
eit her galactokinase or ga lact ose transfera se. T ransformati on is found to occur,
however, only if t he ba ct eria exposed t o Adg DNA are simultaneously infected with
" helper" phage (e.g. ordinar y A). Analysis of the transform ed ba cteria shows th at the
act ive DNA car ries phage genes as well as galactose genes, and , in fact, appe ars to be
t he entire chromosome of >'dg.
2. Materials and Methods
(a ) M edia
The grow th media used in clude: Difco bacto-tryptone broth with 0' 5% NaCI (TB
m ed ium) and its agar derivatives, T B soft agar (0,7% agar) and TB plate aga r (1 % agar);
EMB.gala ctose agar as described by Leder berg (1950) exc ept tha t 10 gfl . Difco bactotrypt one is su bstit ut ed for 8 gfl. of casein digest ; H medium cons isting of 0· 1 M-potassium
phosphate b uffer, pH 7,0, 0·0 15 M- (NH 4)zS04' 0· 001 M-MgS0 4 a nd 1·8 X 10- 6 M-FeS0 4 ;
and P m ed ium wh ich is identical to H except that t he phosphat e con centration is 0·02 M.
Unless otherwise specified, bacteri oph age stocks were kep t in and d ilu ted into a. solu tio n
(termed A-d il. ) of O'Ol l1I-potassium phosphate b uffe r, pH 7'0, 0-01 M.MgS 0 4, a nd 10 p.g/ml.
of bovine plasma a lb umin .
(b) Special reagents
The trypsin and pancr eat ic D Na se were crystalline products of W orthington Bi ochemica l Corp . Thymus D NA was prepared according t o t he procedure of K ay , Simmons &
D ounce (1952). CsCI w as ob tained fr om Ameri can P otash and Che m ica l Corp.; its an alysis
394
A. D. KAISER AND DAVID S. ROGNESS
in per cent by weight was: CsCI-95'01; RbCI-4·11; KCI-0'39; NaCI-0·06; NaHC0 30·02; and moisture-0·03. The CsCI concentrations referred to in the text are not corrected
for the presence of these impurities. For experiments involving the centrifugal banding
of DNA in a CsCI gradient, ultraviolet light-absorbing impurities in the CsCI were reduced
by heating the CsCI at 500°C for about 20 hr and then passing a 60% solution of the heated
CsCI through a Norite column. The resulting solutions had absorbancies of less than 0·05
at 260 txu». All other chemicals were C.P. grade.
(c) Bacterial strains
The galactose-negative mutants of E. coli K12 were isolated by Dr. E. Lederberg who
generously made them available to us. Mutant W3102 (Gal 2- ) is defective in the synthesis
of galactokinase, mutants W3101 (Gal l - ) and W3104 (Gal 4 - ) are defective in the synthesis
of galactoso-Lphosphate uridyl transferase. All three strains are non1ysogenic. The three
were derived from W3092, W3091, and W3094, respectively, whose enzyme defects have
been analyzed (Ka1ckar et al., 1959). The double mutant Gal 1-Ga14- was isolated by
Dr. M. L. Morse (stock no. 550) who kindly permitted us to use it. It is also methioninerequiring, lactose-negative, T1-resistant, streptomycin-resistant, and F-.
Strain C600 is a nonlysogenic, galactose-positive derivative of K12 (Appleyard, 1954).
Lysogenic derivatives of these strains were isolated from the survivors of phage infection. The symbol for a lysogenic strain, e.g. C600(A), is read: C600 lysogenic for A.
(d) Bacteriophages
Wild type A, implied whenever the symbol A is written without qualification, forms
turbid plaques about 3 mm in diameter. Its origin has been described (Kaiser, 1957).
The plaques formed by A co mi are clear (co) and minute, with well defined halos (mi).
The co mutation, which is very closely linked to c, gives 5% recombination with mi (Fig. 1)
(Kaiser, 1957).
Ai434, which has also been called 434 hy, is identical with Aexcept that it has the immunity
specificity gene of 434. The i 434 and i A genes are two different alleles at the c locus (Kaiser &
Jacob, 1957).
Isolation of Adg. A stock containing 109 A and 1O~ Adg/ml. was obtained by u.v. irradiation of the galactose-positive strain C600(A). It is known that several types of Adg, differing
in buoyant density, occur in such a stock (Weigle et al., 1960). All of the experiments
reported here involve the same Adg, which was isolated as follows. K12 Gal 4- was exposed
to the aforementioned stock and a single galactose-positive colony isolated. Cultures
grown from this colony, when induced with ultraviolet light, produce both A and Adg. It
is, therefore, lysogenic both for A and Adg, symbolized Gal 4- (A, Adg). To facilitate the
preparation of u.v.-induced lysates from Gal 4- (A, Adg), a mutant unable to adsorb A was
selected from it: Gal 4- (A, Adg)/A. This strain served as the source of Adg.
Concentrated stocks of A, Ai4 34 , and A co mi to be used as helper were prepared by u.v.
induction of Gal 4- (A), Gal 4-(Ai434 ), and Gal 4- (A co mil, respectively, and then purified by
the procedure described in a succeeding section for Adg.
(e) Assays
A.-The number ofactive Ain a phage suspension was determined by counting the number
of plaques produced by an appropriately diluted sample of the suspension using the agar
layer technique described by Adams (1959). The indicator bacteria were strain W3104.
Adg.-The number offunctional Adg particles in a phage suspension was determined from
the number of galactose-positive colonies produced by an appropriately diluted sample in
a standard transduction assay. The assay was carried out as follows: an 0·1 ml. portion
of the Adg to be assayed was mixed with 0·2 ml. of exponentially growing cells ofW3104 in
TB medium (2 X 10⁹ cells/ml.) and 0·1 ml. of helper phage A (8 X 10⁹ Afm!.). The
mixture was incubated at 37°C for 20 min, then 2 ml. of soft TB agar was added and the
entire mixture poured onto an EMB-galactose plate. After incubation for 40 to 48 hr at
37°C, the plates were scored for Gai" colonies.
Since 20% of the Adg lysogenize under these conditions, the number of Adg particles is
obtained by multiplying the number of Gal» colonies by 5. The validity of this procedure
PLAT~: I. The separat io n of Adga nd ,\ phage in a cesiu m ch lor id e gradien t a fte r 8 hr cen t rifuga t ion
at 34,4 10 rev/min, 5 °C. This phage sus pe ns ion was sim ila r to fra ction CsCI- I excep t t hat P. = 1·5l.
The m or e conc en t ra te d ba nd of u ltra violet-absorbing material nearest t he m eniscus is Adg and
h as a buoyant density of 1·49. The ot he r b a nd is Awith a den sit y of 1' 50. T hese buoyant d en sities
a re m ean va lu es d etermined by direct d en sit y m eas ure me n t s of the fr a ctions ob tained during the
prep a ration of fr a ction CsCI-3 (" Ma t eria ls an d Methods" ).
T o fa ce page 394
TRANSFORMATION OF E. COLI
395
is confirmed by the observation that in purified preparations of A the ratio of active A to
absorbancy at 260 tnp: is 5 times larger than the ratio of Gal» to absorbancy at 260 tiu» for
purified Adg.
(f) Ohemical and physical determinations
Orthophosphate was estimated by the method of Fiske & SubbaRow (1925) and total
phosphorus was measured as orthophosphate after digestion in concentrated H 2S0 4 to
which H 20 2 was added. The diphenylamine reaction of Dische (1955) was used to determine
dcoxypentoso. Pentose was determined by the Mejbaum (1939) procedure, using a 40-min
heating period and adenosine 5'-phosphate as a standard. Protein was determined by the
phenol method of Lowry, Rosebrough, Farr & Randall (1951) using crystalline bovine
plasma albumin as a standard. Absorbancy at a single wavelength was determined in a
Beckman model DU spectrophotometer using a 1·00 em light path, whereas absorption
spectra were measured in a Cary model 14 recording spectrophotometer. The viscosity
of DNA solutions was determined with a capillary viscometer (Schachman, 1957) at
concentrations of about 25 fLg/ml. Densities of cesium chloride solutions were determined
with a 0·2 ml. pycnometer.
(g) Purification of Adg
A culture of Gal 4 - (A, Adg)/A growing exponentially in H medium containing 1% galactose
was induced by irradiation with u.v. after it had achieved a concentration of 2 X 10⁹
cells/ml. and had been cooled to O°C. After irradiation of 50 liters of culture, 12 liters of
10% Difco bacto-tryptone broth were added, the mixture brought to 37°C, and incubated
with aeration until maximum lysis occurred (measured by the absorbancy of the culture
at 600 mfL). This lysate was immediately cooled to O°C and centrifuged in a Sharples
centrifuge to clear it of bacterial cells and debris. The supernatant fraction is termed the
crude lysate. All further purification steps were performed in the cold room at 4 ± 1DC.
The crude lysate was concentrated by adding 250 g of (NH4)2S04/liter of lysate and
allowing a precipitate to form and settle to the bottom of the container by letting the
mixture stand overnight. After siphoning off the clear supernatant fluid, the precipitatecontaining portion was centrifuged to yield a pellet containing the phage. This pellet
was taken up in A-dil. to a final volume one-fortieth of that of the crude lysate and, after
dialysis against 0·01 M-MgS0 4 in 0·01 M-potassium phosphate buffer, pH 7·0, was termed
the (NH 4)2804 precipitate fraction.
This fraction was centrifuged for 10 min at 14,000 g, the supernatant fluid decanted
and centrifuged for 3 hr at 21,000 g. The resulting pellet, containing the phage, was taken
up in A-di!. to a final volume that was 40% of that of the (NH4)2S04 precipitate fraction
and after dialysis as above was termed the 2lG fraction.
Sufficient CsCI was added to the 21G fraction to make the phage suspension 41·5 % CsCI
(w/w), having a density at 4°C (P4) of 1·46 g cm- s. This solution was centrifuged 1 hr at
21,000 g and the clear liquid separating a small pellet and a floating gel removed and
termed the OsGl-I fraction.
The CsCI-l fraction was centrifuged 42 hr at 27,000 rev/min in a Spinco model 30 rotor
(maximum centrifugal force = 86,000 g). Since Aand Adg have different buoyant densities
in CsCl solutions (Weigle et al., 1960), they form bands at different positions in the CsCl
density gradient established in the centrifuge tube. This banding, as observed with the
ultraviolet absorption optics of the Spinco model E centrifuge, is shown in Plate I. If a
small hole is pierced in the bottom of the nitrocellulose centrifuge tube with an insect pin
(size 00 or 0 pin attached to the tip of a soldering gun and heated prior to piercing),
fractions can be collected, drop by drop, without appreciable disturbance of the CsCI and
phage distributions. Fractions containing 80 to 90% of the active Adg phage were combined and dialyzed against 0·01 M-MgS0 4 in 0-01 M-potassium phosphate or 2-amino-2hydroxymethylpropane-1 :3-diol (tris-) buffers, pH 7·0, to yield fraction OsGl-2.
In some cases the Adg phage from fraction CsCI-2 were not dialyzed but were diluted
in 41·5% CsCI solution and centrifuged 67 hr in a Spinco model SW25·1 swinging bucket
rotor at 22,000 rev/min (maximum centrifugal force = 70,000 g). Fractions were collected
and dialyzed as described above to yield fraction OsGl-3.
II
396
A. D. KAISER AND DAVI D S. ROGNESS
A summary of the data obtained from the purification procedure is given in Table 1.
Its effec t iven ess is indicated by the fact, that the (},TJ!4)2S04 precipitate fraction contains
60 times more 260 mu-absorbing materia l and 400 times more protein per active Adg than
does the purified CsCI-2 fraction. The 21,000 g centrifugation, addition of CsCI, and the
p reliminary 1 hr centrifugation, together, inactivate about one third of the phage. Since
some, if not all, of the inactive phage fractionate with the active phage (e.g . in the CsCI
gradient step), these p urification factors are, therefore, minimal rela tive to total ph age
particles . Because of t he uncertainty caused by this inactivation, a better criterion of the
purity of the phage p repa rat ions in the la t t er stages of purification is given by the r a t io
of the absorbancy at 260 mJL to t he protein concentration.
TABLE
I
The purification of ).dg
Fraction
Crude lysat e
(NH 4)aSO. prec ipitate
2lG
CsCl· I
CsCl·2
CsCl·3
Mg
X 10- 12
m!.
>.dg
T
Adglml.
- -- X 10-10
A S26 0
0·06
1·3
2·4
2·0
14
60
6·0
5·5
5'5
5·0
12
70
0·55
2·8
30
42
35
-
AS 26 0
mg prot.jrnl,
2 '5
4·0
4·4
13
16
%
yield
100
53
42
33
26
18
The method of preparation and assay of the fractions is given in "Materials and Methods."
Th e reproducibility of the assay for Adg and A is about 15% an d that for the protein about 5% .
As 28 0 refers to the absorbancy at 260 illp. over a 1·00 em light path after correcting for light
scattered by the phage particles. Th e method of correction is given in tho legend of Ta ble 2.
No values for the crude lysate are given in columns 4 an d 5 because of the large contribution
of the Difco ba cto -tryptone to the protein and absorbency va lues.
If one assumes that a ll inactive phage fractionate with active phage during centrifugation, then an approximate value of 5 X 10 7 for the gram-mo lecular weight of the DNA per
Adg particle can be calculated from the data in Table I, using a 260 mJL molar absorbancy
index relative to phosphorus (or deoxyribose) of 6·8 x 10 3 ]\1- 1 cm- 1 (see Table 2). If, on
the other hand, all of the Adg particles in the CsCI-2 fr act ion are assumed to be active, a
value of 7 X 10 7 is found. These values are in ag reement with the approximate grammolecular weight of the D NA per A particle of 5 X 10 7 which can be ca lcu lated from t he
data of Stent & F uerst (1955) concerning the number of phosphorus atoms per A tha t
have a leth al effect when subject to 32p decay if on e assumes that the fraction of total
p h osphorus atoms exh ib it ing this effect is 0, 1, t he value found for phages 'I' I, T 2, T3, T5,
and T7 (Stent & F uerst , 1955). Since DNA constit ut es 50% of the Ady m ass (see "Experimental," Section (a» , the m olecula r wei ght of the Adg p a rticle is twice the above v alues ,
i .e ., about 1 X 10 8 •
(h) The preparation oj A and Mg DNA
The DNA of A or Adg phage was separated from the protein by a modification of the
phenol mothod of Gierer & Schramm (1956). All operations were carried out at co ld room
temperatures of about 4 °C. Fraction CsCI-2 was di luted in A-dil. to a 260 mJL absorbancy
of 10 (about 4 X 10¹² Adg per ml.). Equal volumes of this phage suspension and freshly
distilled phenol saturated with water at 4 °C were mixed and agitated by hand for 1 m in .
The two phaaes were separated by centrifugation and the aqueous phase recovered. T h is
pr ocess was repeated two more times, fresh water-saturated phenol being mixed with the
r ecovered aqueous phase in each case. The three phenolic phase residues were extracted
TRANSFORMATION OF E. 00L1
397
serially with a volume of A-dil. equal to one-fifth the volume of the phage suspension.
The resulting two aqueous fractions were combined and dialyzed against 0·15 M-NaCl in
0·01 M-potassium phosphate buffer, pH 7'0, until all of the phenol was removed. The
resulting clear, viscous solution is termed Adg DNA. It was stored, after freezing quickly
in an ethanol-dry ice bath, at - 15°C and showed no loss of biological activity over the
period of one year.
The DNA from helper phage A, termed A DNA, was also prepared according to the
above procedure.
(i) The nucleotide analysis oj Adg DNA
Fraction CsCl-3 was used as a source of Adg DNA for the determination of its nucleotide
composition. Prior to isolating the DNA by the above phenol method, the phage suspension
was dialyzed against 0·001 M-MgS0 4 , 0-07 M-NaCl and 0·006 M-tris buffer, pH 7'5, and
then treated with pancreatic DNase at a concentration of 1·0 fLg per ml. for 1 hr at 37°C in
order to hydrolyze any contaminating DNA. The phage were washed twice in the above
tris medium by 3-hr centrifugations at 24,000 g and then treated with phenol. The phenol
was removed by dialysis against 0·15 M-NaCl in 0·01 M-tris buffer, pH 7·5.
This DNA solution, containing 14 fLmoles of phosphorus, was hydrolyzed to mononucleotides by the successive action of pancreatic DNase and venom phosphodiesterase (Koerner
& Sinsheimer, 1957) according to the procedure of Lehman, Bessman, Simms & Kornberg
(1958) with minor modifications in the concentrations of DNA and enzymes. The resulting
digest contained 98 to 100% of the total phosphorus in the form of 5'-mononucleotides as
indicated by the fact that this amount of phosphorus was released as orthophosphate after
treatment of a portion of the digest with purified semen monoesterase (gift of Dr. L.
Heppel) under conditions in which the contaminating phosphodiesterase activity of this
enzyme preparation was not significant.
The 5'-mononucleotides were separated on a column of Dowex 1 (10 x ) acetate at 4°C
using ammonium acetate buffers at pH 4·3 according to the method of Sinsheimer &
Koerner (1951) except that 0'05,0'25,0-50, and 1·0 M buffer solutions were used to elute
the 5'-monophosphates of deoxycytidine, deoxythymidine, deoxyadenosine, and deoxyguanine, respectively. The mononucleotides were identified by their absorption spectra
and by their position in the elution diagram when compared to that of known nucleotides.
3. Experimental
(a) The preparation and chemical analysis of Adg DNA
Extraction of Adg with cold, water-saturated phenol releases the phage nucleic acid
from its protein coat into aqueous solution. The chemical analysis of this material is
given in this section. Its biological activity will be described in the following section.
The Adg phage that are used as the source of DNA in the phenol extraction
("Materials and Methods") are 50 ± 3% by weight DNA, as calculated from their
phosphorus and deoxyribose content (Table 2). The remaining material in the phage
is assumed to be protein, although protein analysis by the method of Lowry et al.
(1951) yields the value of 62%. The inconsistency of this high protein percentage is
most easily resolved by assuming that the bovine plasma albumin, used as a standard,
is less reactive in this protein assay than is the average Adg phage protein.
The aqueous solution obtained after phenol extraction of the phage is termed Adg
DNA and contains approximately 90% of the 260 mn-absorbing material present in
the phage. Since both the molar absorbancy index relative to phosphorus (lXp) at
260 mfL and the molar ratio of deoxyribose to phosphorus of the >"dg DNA and of the
phage are not significantly different (Table 2), the yield of DNA is also about 90%.
On the other hand, less than 2% of the phage protein remains in the aqueous phase
after phenol extraction. This is a maximum value determined by the significance level
of the protein assay for the Adg DNA. The actual protein content of >..dg DNA is
398
A. D. KAISER AND DAVID S. HOGNESS
probably very much lower than this 2% value. Thus Dr. Simmons, in our laboratory,
has recently found that in the phenol extraction of Adg labeled with 35S only 0·1 % of
the phage sulfur appears in the aqueous phase.
8
260
236
7
1.2
2.4
6
~ 5
x
~ 4
3
2
240
320
260
280
Wavelength (miL)
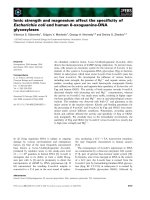
FIG. 2. The ultraviolet absorption spectra of >'dg phage (fraction CsCI-3) and of Mg DNA at
pH 7. The phage were suspended in 0·01 M-MgSO. and 0·01 M-potassiurn phosphate buffer and
no correction was made for scattered light. The DNA was dissolved in 0·15 M-NaCI and 0·01111potassium phosphate buffer. ctp = molar absorbancy index relative to phosphorus.
TABLE
2
The chemical analysis of Adg phage and >"dg DNA
Material
>'dg phage
>'dgDNA
Percent
phosphorus
by weight
Deoxyribose to
phosphorus
molar ratio
(260m!,)
4·7
0·98
1·00
6·8 X 10'
6·6x 10'
9·0
ctp
Molar ratio
of
deoxynucleotides
A-l'OO
T-l'OO
G-0'95
C-0'94
The >'dg phage (fraction CsCI-2) and >'dg DNA were analyzed for phosphorus and deoxyribose
after dialysis against water and freeze-drying, followed by drying over P.0 6 in vacuo at room
temperature. The >'dg DNA was prepared by phenol extraction of phage fraction CsCI-2, except
that for the analysis of deoxynucleotides fraction CsCI-3 was used (see "Materials and Methods").
The ctp at 260 rnu for Mg phage and Mg DNA was determined under conditions given in Fig. 2,
except that a correction for the light scattered by the Mg phage has been made. The amount of
scattered light was determined by the extrapolation to lower wavelength of a >.-' curve fitted to
the measured optical densities between 315 m!' and 400 m!'.
The ultraviolet absorption spectrum of >"dg DNA (Fig. 2) is that expected of solutions
of native DNA (Beaven, Holiday & Johnson, 1955) and exhibits a typical hyperchromic effect when treated with pancreatic DNase, the ap at 260 mjL increasing
1·35-fold at pH7 in 0·15 M-NaCl. Treatment of >"dg DNA with pancreatic DNase
also causes a decrease in the reduced viscosity from 65 dl. g-l to less than 1 dl. g-l
when measured at 37°C in 0·14 M-NaCI, 0·015 M-sodium citrate at pH 7·6.
TRANSFORMATION OF E. GOLI
399
Hydrolysis of Mg DNA to mononucleotides can be accomplished by the successive
catalytic action of pancreatic DNase and venom phosphodiesterase ("Materials and
Methods"). Chromatography on Dowex 1 of the resulting digest ("Materials and
Methods") showed that 98% of the 260 mu-absorbing material and 97% of the phosphorus in the digest could be accounted for by the deoxynucleotides of adenine,
thymine, guanine, and cytosine. No 5-hydroxymethyl-deoxycytidine-5'-monophosphate nor its o-mono- or diglucosylated derivatives was detected, although these
nucleotides are separable by this technique (Lehman, personal communication) and
would have been detectable if anyone of them constituted greater than 0'3% of the
mononucleotides in the digest.
TABLE
3
Components required for transformation
Number of Goi»
Complete system
omit A
omit Adg DNA
replace Adg DNA with A DNA
replace Adg DNA with DNase-treated Adg DNA
omit Adg DNA and A
omit bacteria
2 X 10't
o
6
10
6
o
o
t A 10- 2 dilution of the incubated mixture showed 204 Gal": colonies. The plates obtained from
the undiluted mixture contained more than 5000 Gal» colonies and were therefore not countable.
The complete system contained 190 J-Lg Adg DNA and 1·5x 10 8 A-infected K12 Gal-lGal,bacteria, 2 J-Lmoles tris, pH 7,1, 2 J-LIDoles CaCI 2 , and 2 j-LIDoles MgSO, in a total volume of 0·2 mi.
The mixture was incubated 60 min at 37°C and then plated.
A-infected bacteria were prepared by exposing 1·5 X 10' bacteria to 1·5 X 10 ' 0 A in P medium
(made up to 0·01 M in MgSO.) at 37°0 for 15 min. At the end of the incubation the bacteria were
centrifuged and resuspended in the diluent indicated above. Uninfected bacteria (for the line
"omit A") were similarly treated except that no phage was added.
DNase-treated Adg DNA was prepared by preincubating 380 J-Lg Adg DNA with 0·2 J-Lg pancreatic
DNase at 22°C for 40 min in 0.2 ml. The inorganic components of this preincubation were the
same as those in the complete system.
The amount of A DNA or DNase-treated Adg DNA employed was also 190 J-Lg.
The relative molar concentrations of the four mononucleotides present in the digest
are given in Table 2. The expected equalities of adenine and thymine and of guanine
and cytosine (Chargaff, 1955; Watson & Crick, 1953) occur. The fraction of bases
which are guanine and cytosine in Ad(! DNA is 0·49. This quantity is a characteristic
of the biological origin of a DNA preparation, varying from 0·3 to 0·7 for different
microorganisms (Chargaff, 1955; Lee, Wahl & Barbu, 1956). The value for Adg DNA
is equivalent, within experimental error, to that found for the DNA of a virulent
mutant of A (Lwoff, 1953) and ofthe A host cell, E. coli K12 (Gandelman, Zamenhof &
Chargaff, 1952).
The foregoing data show that the aqueous phase resulting from the phenol extraction of a Adg phage suspension is a solution of DNA. Less than 2% of the phage
material in this solution is protein and, on the basis of its phosphorus and deoxynucleotide content) at least 95% is DNA.
400
A. D. KAISER AND DAVID S. ROGNESS
(b) Description of the transformation system and its requirements
Adg DNA will transform galactose-negative (Gal-) bacteria only if the bacteria have
been exposed to ordinary A, either simultaneously with or before the addition of the
DNA. The requirement for added "helper phage," as it will be called in subsequent
discussion, is shown in Table 3. Experiments which explore the role of helper will be
presented in the next section; here, the point to be emphasized is that the level of
transformation is at least 104-fold higher in the presence of helper than in its absence.
For these experiments the helper phage was propagated on Gal4 - bacteria so that
it could not mediate a transduction of the Gal4 - recipient bacteria to Gal», The Gal»
bacteria which arise in the absence of DNA, Table 3, are most likely due to reversions
of the Gal- recipient bacteria which occur when it is growing on the assay plate.j
The transformation of Gal genes is a specific property of Adg DNA in the sense that
neither A DNA nor DNase-treated Adg DNA can replace Adg DNA. The results of both
experiments are shown in Table 3.
The transforming activity of Adg DNA for Gal- mutants defective in the synthesis
of galactokinase or in the synthesis of galactose phosphate uridyl transferase is
similar. Thus 2·5 fLg of Adg DNA produced 205 Gal» colonies from a Gat, -, transferaseless mutant and 130 Gal» colonies from a Gal2-, kinaseless mutant. The conditions of
the experiment were those of the standard transformation assay described at the end
of the next section. Therefore, Adg DNA, like Adg, carries both the gene for galactose
phosphate uridyl transferase and the gene for galactokinase.
(c) The quantitative determination of transforming activity
The aim of the experiments described in this section was to develop an assay for the
transforming activity of Adg DNA. These experiments also give some insight into
the mechanism of the reaction between DNA and recipient cell and the role of helper.
(i) Choice of helperphage
Although wild type A acts as helper, the variant Ai4 34 acts more efficiently. At the
same multiplicity of infection, 10 adsorbed phage per bacterium, 3·5 times more Gal»
bacteria arose when Ai4 34 was used as helper than when wild type A was used. Phage
,\i434 was therefore adopted as helper for the standard transformation assay.
To avoid lysis of the recipient bacteria due to multiplication of helper phage and
subsequent reinfection of the survivors during the assay, a Gal- lysogenic for Ai4 34
was used as recipient.
(ii) Time course of the reaction between Adg DNA and helper-infected bacteria
If Adg DNA, helper phage, and recipient bacteria are mixed and DNase is added at
various times later, the number of Gal» bacteria increases slowly to reach a plateau
at 120 min, having attained one-half the maximum value at 40 min. The results of
this experiment are represented in Fig. 3.
(iii) Dependence on DNA concentration
The number of Gal» bacteria obtained is proportional to the concentration of
Adg DNA, as is shown in Fig. 4. This is true not only for an incubation of 120 min, a
t The data of Table 3 indicate that more revertants arise among the helper-infected bacteria
than in the uninfected. This may be due to selection imposed by lysis and the products of lysis
acting on the assay plates.
TRANSFORMATION OF E. COLI
401
1000
800
0
'C
'"
600
4J
U
..,
0
+.
0
\..J
400
'0
..,'"
L-
E
::J
Z
200
25
50
75
100
125
150
Time of DNase addition (min)
FIG. 3. Time course of the reaction between 'Adg DNA and helper-infected bacteria. DNA,
helper, and bacteria were incubated together at 37°C in the following concentrations: Mg DNA31 !-'g per rnl., 'Ai 4 3< helper-i-z-tl x 10 9 per mI., and Kl2 Ga14 - {'Ai ( 3 4 )- 4·3 x 10 8 per mI. Media
and diluents were the same as those described in the standard transformation assay. At the times
indicated on the abscissa duplicate 0·3 mI. samples were removed from the incubation mixture
and added to 0·1 mI. of 20!-'g per mI. pancreatic DNase, incubated 5 min at 37°C and then plated.
The number of Gai" bacteria given on the ordinate is the sum of that for two duplicate incubation
mixtures.
2000
1500
o
'C
2u
o
.., 1000
+.
o
...o
\..J
L-
'"
~
500
::J
Z
10
20
30
DNA concentration {JLg/ml.l
FIG. 4. Dependence on the concentration of DNA. Duplicate samples of Mg DNA at the concentrations indicated on the abscissa were incubated with K12 Ga14 - ('Ai ( 3 4 ) at 5·6x 10· per mI.
and 'Ai 4 3 4 helper at 2·6 X 10 9 per mI. in a total volume of 0·3 ml. Mter 40 or 120 min at 37°C,
0'1 ml. pancreatic DNase at 30!-'g per ml. was added, the mixtures incubated 5 min at 37°C and
then plated. The number of Gal» recorded on the ordinate is the average of that for two duplicate
incubation mixtures.
402
A. D. KAISER AND DAVID S. ROGNESS
time which falls on the plateau of the time curve (Fig. 3), but also for an incubation
of 40 min, the time at which uptake is one-half the maximum plateau value.
The specific transforming activity measured in this experiment after 120 min
incubation is 75 Gal» per fLg DNA. More recently specific activities of 8 X 10⁵ Gal"
per fLg DNA have been obtained with the same DNA preparation but with different
conditions of helper infection and DNA uptake.j The specific activity of whole >"dg
phage as measured in a transduction assay (see Table 1) is 2x 10⁹ Gal+/fLg DNA.
Therefore, 4 X 10⁻⁴ of the activity present in Adg has been accounted for in terms of
transformation by >"dg DNA.
(iv) Dependence on the concentration of helper-infected bacteria
For a given amount of >"dg DNA, the number of Gal» bacteria produced during a
two-hour exposure is a linear function of the number of helper-infected bacteria,
1000
800
+.
o
o
.... 400
o
o
I
2
3
Concentration of bacteria
(I umt
4
=109 cellsj/rnl.)
FIG. 5. Dependence on the concentration of helper-infected recipient bacteria. A number of 0·3
ml. incubation mixtures were made, each containing 8 p.g per ml. Adg DNA and variable amounts
of K12 Gal. - (Ai 4 3< ) ranging from 5·7 X 10 8 to 4·7 x 10' per ml. as indicated on the abscissa.
The mixtures were completed by the addition of variable amounts of helper so as to keep a constant
ratio of 9 phage per bacterium. After 120 min incubation at 37°C, 0·1 ml, pancreatic DNase at
20 p.g per mI. was added, incubated 5 more min at 37°C, and then plated. The ordinate indicates
the total number of Gal» bacteria on plates from two duplicate incubation mixtures.
as can be shown by (1) varying the concentration of bacteria, keeping the multiplicity
of helper infection constant (Fig. 5), or (2) varying the multiplicity of helper infection
for a given bacterial concentration.
In an experiment of the latter type, the number of Gal» bacteria is directly proportional to the multiplicity of infection for multiplicities below 0·1. Above 0·1 the
t The conditions were as follows. Gal,- (Ai'M) were infected with Ai'" in P medium with MgSO.
added to 0·01 M. The multiplicity of infection was 10. After 15 min incubation at 37°C the infected bacteria were centrifuged and resuspended in a solution containing 0·01 M-tris, pR 7'1,
0·01 M-MgSO., 0·01 M-CaCI2• Adg DNA diluted in the same solution was added. Infected bacteria
and DNA were incubated for 60 min at 30°C; then pancreatic DNase, 10 p.gjmI. final concentration,
was added and the mixture plated.
TRANSFORJ\IATION OF E. GOLI
403
number of Gal" increases slowly with increasing multiplicity, reaching a maximum
at a multiplicity of 4. The maximum is broad, extending from 4 to 14. The growth
of the recipient bacteria is inhibited at multiplicities higher than 14.
(v) Procedure for a standard transformation assay
The following procedure was used to assay transforming activity in all subsequent
experiments unless otherwise indicated. DNA, helper phage, and recipient bacteria
were prepared as three separate reagents. The DNA was diluted to an appropriate
concentration in 0-15 !li.NaCI, 0·01 lIT-potassium phosphate buffer at pH 7·0. Helper
Ai4 34 was diluted to 1010 phage per ml. in A·dil. The recipient bacteria Gal 4 - ('\i 4 34 ) were
grown in P medium containing 1·25 mg /ml. glucose to 1·6 x 109 viable cellsnnl.,
chilled, and then MgSO 4 was added to a final concentration of 0·01 1\1The assay was begun by mixing 0·1 ml. each of the diluted DNA, helper, and
recipient bacteria. After 120 min at 37°C, 0·1 ml. of a 20 fLg per ml. solution of
pancreatic DNase was added, and the 37°C incubation was continued for 5 min more.
Finally, 2 ml. of TB soft agar was added and the contents poured onto an ElVIB·
galactose plate. The number of Gal» colonies was counted after 40 to 48 hr at 37°C.
Under the conditionsof this assay, Adg DNA had a specific transforming activity
of 75 Gal» per fLg DNA. The mean deviation between duplicate assays with the same
culture of bacteria was 15%, although the activities measured for the same DNA
preparation using different cultures of recipient bacteria might differ by several-fold.
(d) The nature of the active material
The chemical and physical properties of '\dg DNA are those of deoxyribonucleic
acid. However, since only 4 X 10⁻⁴ of the activity present in whole Adg has been
accounted for in terms of transformation by '\dg DNA, it is possible that only 4 X 10⁻⁴
of the Adg complements of DNA, or even 8 X 10⁻⁵ since no more than 20% of the
'\dg phage particles register in a transduction assay, are still biologically active. If
this were true, and if the loss in activity were due to a ehange in composition, the
bulk chemical properties of Adg DNA might not represent those of the active material.
It is necessary, therefore, to use other techniques to identify the active material.
(i) The effect of anti-A serum
Since the active material is obtained from phage particles, it is pertinent to compare
its properties with those of whole phage.
Neutralizing antibody reacts with the proteins of the phage tail to block some early
step in the infection process, either adsorption or injection (Nagano & Oda, 1955).
To see whether the active material in Adg DNA contains those structures of whole
phage which react with neutralizing antibody, Adg DNA was treated with rabbit
anti- A serum.
The antiserum was first heated to 70°C for 45 min to denature serum nucleases.
After heating, the serum contained less nuclease activityjml. than would be equivalent
to a solution containing 10-5 fLg per ml. of crystalline pancreatic DNase, measured
viscometrically with calf thymus DNA as substrate.
Results of this experiment are presented in Fig. 6. Whereas more than 95% of the
transducing activity of Adg was neutralized in 160 min, no neutralization of the infectivity of Adg DNA was detected. The 10% decrease in infectious activity of Adg DNA
which occurred in the presence of anti-A serum occurred also in its absence.
404
A. D. KAISER AND DAVID S. HOGNESS
To test the hypothesis that DNA might inhibit the neutralization reaction so that
a small amount of whole Adg could escape detection in a large amount of Adg DNA,
A DNA was added to Adg and the course of neutralization of the mixture followed.
The result, also presented in Fig. 6, was identical to the neutralization of Adg in the
absence of added DNA.
The conclusion is that those structures of whole phage responsible for its reaction
with neutralizing antibody are not necessary for the activity of Adg DNA .
.
. .
l>
ildg DNA
c:
o
..;0
v
.g
Ol
c:
.;;
.~
51
•
o
m
.Q
-I
Minutes
FIG. 6. The effect of anti'A serum on the transducing activity of Adg and the transforming
activity of Adg DNA.
1. (A) 112 p.g Adg DNA in 2 m!. anti-A serum. The anti'A serum had been diluted 1 to 33 in
0·15 M-NaCl, 0·01 M-potassium phosphate buffer, pH 7,0, heated 45 min at 70°C and further
diluted 1500-fold in the same diluent.
2. (L\) 112 p.g AgdDNA in 2 m!. 0·15 M-NaCl, 0·01 M-potassium phosphate buffer, pH 7 ,0.
3. (.) 1·6 X 10 5 Adg in 2 m!. ant.i- Aserum which had been treated as in 1.
4.
1·6x 105 Adg and 125 p.g A DNA in 2 m!. anti-'\' serum which had been treated as in 1.
The four mixtures were incubated at 37°C and at the times indicated duplicate 0'1 m!. samples
withdrawn and added to the standard transformation assay system as described in the text. A
low concentration of antiserum was employed in the experimental mixtures so that neutralization
of helper phage during the 2-hr assay would be negligible.
Initial values in the incubation mixtures were 7·8 X 10" Gal» per m!. for 1 and 2; 1·6 X 10'
Gol» per m!. for 3 and 4.
«»
(ii) The effect of pancreatic DNase
Whole phage is resistant to DNase because a shell of protein completely encases the
nucleic acid. By contrast the transforming activity of Adg DNA is sensitive to this
enzyme.
Sensitivity to pancreatic DNase was measured as a function of enzyme concentration from 101 to 10- 4 JLg per ml, For purposes of comparison whole Adg was treated
with the same concentrations of enzyme. Results of this experiment, presented in
Table 4, show that 10-4 JLg per ml. of enzyme was sufficient to destroy 94% of the
transforming activity in 30 min. It is unlikely, therefore, that inactivation is due to
other enzymes contaminating the preparation of DNase.
TRANSFORMATION OF E. COLI
405
The kinetics of inactivation of transforming activity and of decrease in viscosity
were measured during exposure to 8 X 10- 5 JLg per ml. pancreatic DNase at 37°0.
The results are plotted in Fig. 7. Transforming activity fell within 35 min to the limit
of detectability which was for this experiment 0·4% of the initial activity. The viscosity,
however, decreased more slowly; 70% remained after 50 min of enzyme treatment.
TABLE 4
Effect of D'Nase on the transducing activity of >"dg and on the transforming activity
of >..dg DNA
Gal»
DNase concentration
(in mixture)
Adg DNA
Whole Mg
fLg/m!.
10
1
10- 1
10-'
10-"
10-'
o
o
o
o
o
1
16
264
245
229
261
197
221
220
246
Whole Mg or 4·7 fLg Mg DNA and the indicated concentration of pancreatic DNase (in 0·01 MMgSO" 0·01 M-potassium phosphate buffer, pH 7, 12 f.Lg per m!. serum albumin) were incubated
at 28°C in a total volume of 0·4 m!. After 30 min incubation 0·1 m!. of a A suspension containing
4·4 X 10'0phage per m!. and 0·1 m!. of a TB culture of KI2 Gal,- containing 7·5 X 10' cellsjml,
were added. The mixtures were incubated 20 min more at 28°C; then 0·2 ml. was withdrawn and
plated.
The rate of inactivation of transforming activity is very close to that observed for
Hemophilus transforming DNA (Zamenhof, Alexander & Leidy, 1953). Moreover,
just as was observed for Hemophilus DNA, the decay of transforming activity is
faster than the decay of viscosity.
(iii) The effect of trypsin
The active material in >..dg DNA can be compared to the urea-treated T2 phage
(Pi particles) which are capable of infecting protoplasts of E. coli but not the normal
cells (Spizizen, 1957; Mahler & Frazer, 1959). The Pi particles are clearly differentiable
from T2 phage but apparently still retain a structure consisting of other components
in addition to the DNA.
The Pi particles exhibit a high and unique sensitivity to the action of trypsin.
Whereas T2 phage are insensitive to 30 min exposure at 37°0 to concentrations of
trypsin as high as 100 JLg per ml., Pi particles are over 90% inactivated at a trypsin concentration of 5 X 10- 4 JLg per mi. (Mahler & Frazer, 1959). When >..dg DNA was treated
with trypsin, no significant change in its activity could be demonstrated. Thus >"dg
DNA at a concentration of 130 JLg per mi. was mixed at 37°0 with from 1 to 90 JLg per
mi. of trypsin in either 0·05 M-potassium phosphate or tris buffer, pH 8·0. Samples of
the reaction mixture taken at zero and at 60 min after the addition of the trypsin were
diluted tenfold in 0·14 M-NaOI, 0·01 M-potassium phosphate buffer, pH 7,0, at 0°0 and
406
A. D. KAISER AND DAVID S. ROGNESS
then assayed for their activity. No significant difference (± 15%) in activity was
observed between the zero and 60-min samples, the results being the same for control
mixtures in which trypsin was absent.
While this result does not exclude the presence of some protein in the active 'Adg
DNA molecules, it does indicate that trypsin-sensitive proteins, such as those present
in Pi, are not necessary for activity.
..,..-no~c-e
°
:A"
0
•
\
0."
•
Viscosity
DNase present
/
<:
-2v
0
-J
~
g>
.;;
.~
~
~ -2
.Q
Activity
-3
0
10
20
30
40
50
Minutes
FIG. 7. Time course of the inactivation of )'dg DNA by pancreatic DNase. Two incubation
mixtures were prepared, each containing 210 fLgMg DNA, 20 p.moles MgS0 4 , 10 fLmoles potassium
phosphate buffer, pH 7,0, and 20 fLg serum albumin in a total volume of 1 ml. One mixture
contained in addition 8 X 1O- s fLg pancreatic DNase. After incubation for the times indicated at
37°C, 0·1 ml. samples were removed and diluted 1/20 in 0·15 M.NaCl, 0·01 M.potassium phosphate
buffer, pR 7·2. Duplicate 0·1 m!' samples of the diluted mixture were then assayed by the standard
transformation assay. Reconstruction controls carried out at the beginning and at the end of the
experiment showed that the carry-over of 4 X 10- 7 fLg of DNase into the assay. had no effect.
As soon as the samples for the transformation assay were removed the remainder of the 20·fold
dilution was used to measure the relative viscosity at 37°C.
(e) transforming activity, DNase present.
(0) transforming activity, DNase absent.
(,.) relative viscosity, DNase present.
(L,) relative viscosity, DNase absent.
The initial values were 5 X 10' Gal" per m!. in the incubation mixture and a 1).p of 0·037 for
the twentyfold dilution.
(iv) The heat denaturation of >.dg DNA
A further criterion for defining the molecular nature of the infectious agent in the
'Adg DNA preparation is its stability to heat. As the temperature is raised, the DNA
in an aqueous salt solution exhibits a transition from the relatively ordered structure
of a double helix to a disordered coil (Rice & Doty, 1957; Doty, Boedtker, Fresco,
Haselkorn & Litt, 1959). In the case of DNA from Hemophilus injluenzae and
Diplococcuspneumoniae, this transition results in the inactivation of that DNA with
respect to genetic transformation (Zamenhof et al., 1953; Marmur & Lane, 1960).
The temperature at the midpoint of this transition, T m' is a linear function of the
guanine-cytosine content of a given DNA preparation (i.e. the fraction of bases which
are guanine and cytosine) and lies between 84 ° and 96°C for the solutions of DNA from
natural sources that have been examined (Marmur & Doty, 1959). With a guaninecytosine content of 0·49, 'Adg DNA should have a T m of about 89°C, the exact value
depending upon the method used for measuring the transition.
TRANSFORMATION OF E. COLI
407
Bacteriophage, on the other hand, are inactivated at considerably lower temperatures since the mechanism of their attachment and DNA injection into the host cell
is dependent upon phage proteins which are more thermolabile than is the DNA.
The characterization of the heat stability of the infectious activity of the >..dg DNA
preparation should therefore determine whether the DNA or some phage protein is
the most thermolabile substance necessary for activity of the infectious agent.
•
1.0
f
~
1'
0.8
.,
c
.0
u
0
¢:
0.6
if\
f\
o Viscosity
• Activity
.
t
en
c
.>
"t
=>
V>
OA
02
70
FIG. 8. The heat denaturation of Adg DNA with respect to transformation activity (e) and
viscosity (0). The surviving fraction is the ratio of activity, or of viscosity, after heating for
60 min at the indicated temperature to that before heating. All activities and viscosities were
determined at 37°C after cooling the heated material quickly in an ice-water bath. The dashed
vertical lines associated with the activity values indicate the significance level (± a = ± 10%)
for this series of assays. Before heating, the 25 ",g per ml, solution of DNA in 0·15 M-NaCI and
0·015 M-sodium citrate, pH 7,7, had an activity of 2 X 10 3 transformation units (Gal+) per ml.
and a reduced viscosity of 65 dl. g-l.
The data presented in Fig. 8 indicate that the loss of transforming activity closely
parallels the transition of the DNA structure as it is measured by the drop in viscosity
attendant upon the loss of the double helical configuration. Thus, as the temperature
is raised, the first significant loss in infectious activity and in viscosity occurs after one
hour's exposure to a temperature between 90 and 91°0, the T m values being 92°0 for
the activity and 93°0 for the viscosity. In contrast, when complete >"dg phage are
heated under the conditions stated in Fig. 8, the surviving fraction of transducing
activity is only 4 X 10- 2 and 2 X 10⁻⁷ at 50° and 70°0, respectively.
It follows from these results that DNA is the most thermolabile substance in the
active material of the >'dg DNA preparation and further confirmation is given to the
hypothesis that the proteins necessary for adsorption and DNA injection of >"dg phage
are not operative in this agent.
(v) The buoyant density of the transforming agent in cesium chloride solutions
Rolfe & Meselson (1959) and Sueoka, Marmur & Doty (1959) have shown that
the buoyant density of DNA in cesium chloride solutions is related to its guaninecytosine content (GO) by the following empirical equation:
p = 1·66
0·10 (GO) g cm- s.
+
408
A. D. KAISER AND DAVID S. HOGNESS
Since 'Adg DNA has a guanine-cytosine content of 0,49, it would be expected to exhibit
a density of 1·71 g cm- 3 • The Adg phage used in these experiments has a density of
1·49 g cm- 3 , a value consistent with its 50% DNA content if one assigns a density of
1·3 g cm- 3 to the phage protein. Thus one would expect that any product of 'Adg phage
degradation would exhibit a density determined by its protein to DNA mass ratio.
Provided the active material in the 'Adg DNA preparation is large enough to form a
band in a cesium chloride gradient, the density at the band position should yield a
measure of the protein to DNA mass ratio of the active unit.
15
(a) Time (t)
10
= 166 hr
1.7
0
::J
<,
::;
5
1.6
0
20
15
0
::J
<,
::;
(b) Time. (tl
=214 hr
1.8
M
10
1.7
5
1.6
'E
<.>
en
>.~
c:
C1>
1.5
0
o
20
0
::J
<,
::;
15
(c) Time (t) =309 hr
1.8
10
1.7
5
1.6
o
7
Meniscus
8
9
10
II
12
131.5
Bottom
Radius
(I) Left-hand ordinate. The ratio of 260 mp' absorbancy (heavy solid line) or of transformation
activity (shaded) at time (t) to that at the beginning of centrifugation (t = 0).
(2) Right-hand ordinate. The density at 4°C of fractions whose size is indicated by the short
horizontal lines, the short vertical line being at the mean radius of each fraction. Density determinations are accurate to ± 0·0015 g cm- 3 •
(3) Conditions: At t = 0 hours, CsCI = 5·24 M: tris = 0·023 M; pH = 8'6; P. = 1·661; 26001P.
ahsorbancy = 0'77; activity = 8x 10 3 transformation units per 011.; and temperature = 4°C.
The solution was centrifuged in a Spinco SW 25·1 swinging bucket rotor at 22·5 X 10 3 rev/min and
the temperature at the end of each run was 5 ± 1°C.
(4) Percent recovery: 260 mp' absorbancy = (a) 101, (b) 103, and (c) 98; transformation
activity = (a) 96, (b) 108, and (c) 86.
To this end, 'Adg DNA in cesium chloride solutions was centrifuged for various times
under the conditions indicated in Fig 9. Fractions were collected from the centrifuge
tubes by the technique employed in the cesium chloride gradient purification of 'Adg
phage ("Materials and Methods"). Analysis of these fractions for their ultraviolet
TRANSFORMATION OF E. COLI
409
absorption spectrum, their density at 4 "C, and their transforming activity after
dialysis against 0·15 M-NaCl containing 0·01 l\I-potassium phosphate buffer, pH 7,0,
yielded the results given in Fig. 9 and Table 5.
Since the recovery of absorbancy at 260 miL and of transforming activity after each
centrifugation was complete within th e experimental error of the te chniques employed
(± 15% for activity and ± 4 % for the absorbancy) , and since better than 98% of the
recovered value was found in the visually obvious band regions of Fig. 9, it is sufficient
to limit the analysis of the fractions to this band region.
TABLE
5
Comparison of the DNA and transforming activity distributions during centrifugation
in a cesium chloride gradient
Mean density
(gem-a)
Standard deviation
(gem-a)
Time
(hours)
166
214
309
D ensity gr adient
(g em-C)
DNA
activity
DNA
activit y
1·691
1·687
1·685
1·692
1·687
1·685
0·0084
0·0061
0·0042
0·0080
0·0056
0·0043
0·045
0·048
0·048
The distributions analyzed are those shown in Fig. 9. The D NA was m easured by its absorbancy
at 260 tnu,
The mean density and standard deviation of density for the activity and absorbancy
distributions (Table 5) are not significantly different from each other at each centrifugation time. Furthermore, there are no significant differences in the transforming
activity per unit abso rbancy at 260 m iL (specific activity) among the various fractions
and that of the input material, except for one to two per cent of total recovered activity
occupying the lowest density region of the bands, in which case the specific activity
was about 60% of that found in the other fractions. The discrepancy between the
observed density of 1·685 g cm- 3 and the value of 1·71 g cm- 3 predicted above is due
to the different conditions employed in this experiment from those used in determining
the empirical equation relat ing density to guanine-cytosine content, since the DNA
used in t his experiment yielded a buoyant density of 1·708 ± 0·001 when meas ured
under t he latt er condit ions (R olfe, personal communication} .']
These results indic at e that the active molecules have t he same protein to DNA mass
ratio as that of the bulk of the DNA. As indicated in Section 1 t he value of this rat io
is less than or equal to 0·02 on the basis of the protein assay of Lowry et al. (1951) and
less than or equal to 0·001 on the basis of sulfur content. Furthermore, from the
equality of the activity and DNA distributions at the various times of centrifugation,
it is concluded that the size of the active molecules is of the same order of magnitude
as that of the DNA molecules. Thus th e conclusion derived from this experiment and
t The significant difference in the cond it ions is that the CsCI us ed in our experiments was
impure, containing 4·1 1% rubidium ch loride (see "Materials and Methods"), whereas that used
by Rolfe & Meselson (1959) was 99·9 % CsCI (Maywood Chemical Works). Thus we have recently
obtained a mean buoyant density of 1·71 for )"dg DNA under the conditions stated in Fig. 9 when
using the purer CsC!.
410
A. D. KAISER AND DAVID S. HOGNESS
consistent with the previous results is that the active material consists of molecules of
DNA in aqueous solution.
(e) Gotransformation of Gal and phage genes
The galactose-positive bacteria produced by exposure to >"dg DNA have two
characteristic properties. First, they are unstable. Isolated colonies, previously
purified by at least two single colony isolations, contain one galactose-negative
bacterium per several hundred galactose-positive bacteria. Secondly, they produce
lysates after irradiation with u.v, light which are capable of transducing the gene for
galactose-l-phosphate uridyl transferase at high frequency.
In both respects these strains behave like Gal- (>"dg). When a >"dg prophage is lost,
which happens about one in 10 3 cell generations, the host becomes Gal- (Morse et al.,
1956; Campbell, 1957). U.v. irradiation of bacteria doubly lysogenic for >..dg and >..
induces the production of both ,\ and >"dg in roughly equal amounts. The lysate
produced will, therefore, transduce with high frequency.
A quantitative comparison of segregation and production of >"dg for a series of
galactose-positive strains produced by exposure to >"dg DNA and those produced by
transduction with >"dg is presented in Table 6. The similarity of the results obtained
TABLE
6
Segregation of Gal- and phage production by Gal» transformants
Segregation of Gal- bacteria
Production of >'dg
number having >'dg/>'
values in the range
Donor
>'dgDNA
Mg
number
tested
number
segregating
number
tested
0·5-2·0
2·1-4·0
4'1-6-0
56
56
52
51
21
18
10
9
9
6
2
3
Using the procedure of the standard DNA transformation assay, galactose-positive bacteria
were isolated after exposure to >'dg DNA or to >'dg. From each of the two series a number of
galactose-positive bacteria were picked and streaked out on EMB-galactose plates. To avoid bias
in the selection of colonies, all galactose.positive bacteria within an arbitrary sector of each of two
plates were picked. A single galactose-positive colony was picked from each streak and restreaked
so as to obtain more than 500 isolated colonies. These streaks were examined for galactose-negative
colonies. From streaks which showed at least one galactose-negative colony a single galactosepositive colony was picked and grown in Hvglucose liquid medium and a lysate prepared by u.v.
induction. The lysates were assayed for their plaque-forming and transducing activities using the
assays for>' and >'dg described in the section on "Materials and Methods." It should be noted that
the helper phage for both series of experiments was M..••
with >"dg DNA and >"dg supports the hypothesis that bacteria transformed by >..dg
DNA become galactose-positive because they are lysogenic for >"dg. In both experiments >"i4 34 was helper. All of the lysates examined contained both i A and i 4 34 phages;
therefore, the dg prophage could be either i A or i 4 34 • It is conceivable that only the
segment bearing the galactose gene(s) came from >"dg DNA and the rest of the >"dg
TRANSFORMATION OF E. COLI
411
genome necessary for the formation of a complete prophage was supplied by recombination with the helper phage. This possibility was examined by using >"dg
derived from wild type ,.\ as the source of >"dg DNA and helper phage marked in the c
region and at the mi locus. The C region and rni are on the same side of the defective
region; c is 5 map units and rni 10 map units from the nearest end of the defective
region (see Fig. 1) (Arber, 1958). Genes present in >"dg can be detected among the
active>" produced by bacteria lysogenic for both >"dg and A because genetic recombination occurs between ,.\ and >"dg during their multiplication together in the same cell.
In the first experiment >"dg DNA was employed with>" COl mi as helper and nonlysogenic K12 Gal 4 - as recipient. The COl marker is in the C region. Control transductions
were performed in which >"dg replaced the DNA extract, the experiments being otherwise identical. Galactose-positive bacteria were picked and purified by three single
colony isolations in EMB-gal plates, grown in H-glucose medium, induced with u.v,
light, and plated on sensitive bacteria. These plates were examined for the presence
of COl ' COl +, rni, and mi», Approximately 200 plaques were examined from each lysate.
The results are presented in Table 7.
TABLE 7
Cotransformation of Gal» and phage genes by Mg DNA
Number of Gal » containing:
Agent
co+ and m i +
>'dg (I)
>'dg DNA (I)
co" only
mi + onl y
Total
neither
17
o
I
3
24
2
2
27
>'dg DNA input to CsCI, Fig. 9 (2)
P eak fraction, 214 hr, Fig. 9b (2)
Gal " tested
21
55
1746 (97% )
1935 ( > 99 %)
1808
1942
(I) 2'5 X 10' >'dg or 12 p.g My DNA were added to 2 X 10· KI2 Gal.- and 4 X 10· >. co mi and
the mixtures plated. Isolated Gal» colonies were picked and restreaked twice. The purified strains
were induced to produce phage by exposing them to u.v. light, and the active phage produced
exam ined by plating on C600 . >. co m i forms small clear plaques whil e co+ causes turbid plaques
and mi+ large plaques. At least 500 plaques were examined from each lysate. When either co+ or
mi + was present, it was present in roughly 25% of the active phage.
(~) Galactose-positive bacteria which had arisen from a standard transformation assay and were
growing on the EMB-galactose plate were scored for the presence of a halo of lysis. A halo would
indicate that the bacteria were producing phage with the immunity spocifioity of >., symbolized i A•
See the text for a more complete explanation of the technique.
In the control series with >"dg, 17 out of 21 or 81 % of the galactose-positive bacteria
isolated had both alleles of >"dg, cO l +, and mi», Among the Gal» arising from DNAtreated cells, 24 out of 55 or 44% had both COl + and mi»,
In another experiment the c gene was detected by making use of the fact that it
controls the specificity of immunity. Transformation with >"dg DNA was carried out
with ,.\i4 34 as helper and K12 Gal 4- (>..i 4 34 ) as recipient, plating finally on EMBgalactose agar. Normally the untransformed K12 Gal 4- (>..i 4 34 ) recipient bacteria grow
to form a confluent, white background on the EMB plates. Because bacteria carrying
a prophage with the immunity gene of A, symbolized i\ will produce some active
phage with the immunity specificity of A, a halo of lysis of the background will
KK
412
A. D. KAISER AND DAVID S. HOGNESS
surround a galactose-positive colony if it has received the i A gene in addition to a
galactose gene from the >tdg DNA. The EMB plates are therefore scored for the total
number of galactose-positive colonies and for the number of galactose-positive
colonies with a halo of lysis.
The results of this experiment are presented in Table 7 also. The i A gene was present
in at least 97% of the galactose-positive bacteria.
It should be pointed out that both experiments give minimum estimates of the
frequency of cotransfer of Gal and phage genes because loss of prophage genes is
known to occur during growth of polylysogenic bacteria (Appleyard, 1954; Campbell,
1957). The lower frequency of cotransfer in the first experiment might be explained
by the greater number of bacterial divisions occurring between exposure to DNA
and testing.
Thus bacteria which become galactose-positive because they have been transformed
by >tdg DNA have a high probability of receiving both the c and mi genes as well.
The interval between mi and the farthest end of the defective region is about 90% of
the known map of A (see Fig. 1). If it is assumed that cotransformation means that
Gal, c, and mi are on the same DNA molecule, this molecule must include essentially
all of the >tdg genome.
4. Discussion
A comparison of some of the chemical and biological properties of the >tdg DNA
system with those of the D. pneumoniae and H. injluenzae transformations, the >tdg
transduction, and with urea-treated T2 phage (Pi particles) is given in Table 8.
The active material in >tdg DNA is similar to the Pneumococcus- and Hemophilustransforming DNA in that their physical and chemical properties define them as
molecules of DNA in aqueous solution. This is not the case for the Pi particles which
evidently retain appreciable T2 protein as necessary components for infection.
The >tdg DNA system is appreciably less efficient than the other systems listed in
Table 8 in terms of the number of transformed cells per fLg of DNA added. This
difference is more marked relative to classical transformation if the measure of efficiency is the number of transformed cells per phage- or bacterial-equivalent of added
DNA, this being the closest approximation that can presently be made to the number
of cells transformed per donor genome. Because of the twenty-five- to sixty-fold
greater amount of DNA per bacterial cell than per Adg, the Adg DNA system is, on
this basis, 10- 3 to 10-4 as efficient as classical transformation. The lower efficiency
might be due either to the nature of the recipient cells, the DNA, or both.
The most important factor in determining the competence of recipient cells in the
>tdg DNA system is their infection with helper phage. If it is assumed that the active
DNA molecule contains essentially all of the >tdggenome, one of the roles played by
helper phage in transformation should be the same as that which it performs in
transduction: it should alleviate the dg defect in the reactions leading to lysogenization.
However, the effect of helper phage in the transformation system is to increase the
efficiency by a factor of at least 104 while having only a twenty-fold effect in the >tdg
transduction. Consequently it must be supposed that helper phage also supply a
function present in the whole >tdg phage, but absent in the >tdg DNA. This function
could involve the adsorption of the DNA to the cell surface, the penetration of that
surface, or the several reactions .by which the injected phage chromosome becomes
prophage. One would expect that >tdg DNA labeled with 32p could be used to further
explore these possibilities.
TRANSFORMATION OF E. COLI
413
8
TABLE
A comparison of the properties of the D. pneumoniae and H. influenzae transforming
DNA, >"dg DNA, >"dg phage and Pi particles
Transforming
DNA(1)
Property
1. Chemical
(I) effect of DNase
(2) effect of trypsin
<
1O- 4,..,g!ml.
inactivates
none
10- 4 ,..,g!ml.
inactivates
Pi particles( 2)
none
> 1O- 2,..,g!ml.
partially inact.
<
1O- 4,..,g!ml.
inactivates
none for
anti-a
anti-)'
inactivates
anti-T2
inactivatest")
same as DNA
more labile
than DNA
more labile
than DNA
same as
DNA (1'71)
less than
DNA (1-5)
inactivates
< ca. 1%
50%
I X 10·
2 X 10·
2 X 10'
2-5 X 1O-9,..,g
per bact.(O)
8 X 10-11 /l-g
per phaget")
8 X 1O-11/l-g
per phaget")
2 X 10⁻¹⁰ /l-g
per phage(')
ca. 1(8)
ca. 100
100
100
same as DNA
(5) density, CsCl
(6) protein content of
active preparation
<
Mg phage
none
(3) effect of antiserum
(4) thermolability
)'dg DNA
<
0·02%
C~Cl
II. Biological
(I) efficiency: no. of transformed cells per ,..,g
DNA addedt-)
(2) DNA per donor baeterium or phage
(3) Percent of genome
transferred
I X 10 8
.
(I) Zamenhof (1957).
(2) Mahler & Frazer (1959).
(3) Whether anti-T2 or DNase in the serum caused the inactivation was not determined
(Mahler & Frazer, 1959).
(4) This efficiency of transforming principle and of )'dg DNA varies with recipient cell concentration. The figure for transforming principle is for H. influenzae at 1·6 X 10 8 cells per ml. (Goodgal &
Herriott, 1957) and that for Mg DNA is with I X 10· helper-infected cells per ml. under the most
recent assay conditions (see "Experimental," Section 3c). The value for ).dg transduction is taken
from Table I, fraction CsCI-2. Pi particles were assayed at 2 x 10' protoplasts per ml., and the
efficiency was calculated assuming 2 X 10-16 g DNA per T2 particle and no loss of DNA during
preparation of Pi particles (Mahler & Frazer, 1959). In this latter case, one plaque is taken as one
"transformed" cell.
(5) H. injluenzae: 2 X 10-16 glcell (Zamenhof et al., 1953).
D. pneumoniae: 2 X 10-16 glcell (Fox, 1957).
D. pneumoniae: 5 X 10-16 g!cell (Lerman & Tolmach, 1957).
(6) See" Materials and Methods," Section 7.
(7) Herriott & Barlow (1952); Stent & Fuerst (1955).
(8) The value must be considerably less than 100% since most known transforming factors are
transferred independently (Hotchkiss, 1954). An estimate of this value can be made from the
molecular weight of 1·5 X 10' calculated for the streptomycin-resistance factor of H. injluenzae
(Goodgal & Herriott, 1957) and the value of 2 X 10-16 g DNA, or 80 DNA molecules of molecular
weight 1·5x 10' per cell. Assuming one genome contains these 80 molecules, genetic transfer
by one molecule would amount to the transfer of about I % of the genome.
414
A. D. KAISER AND DAVID S. ROGNESS
The unique features of the Adg system which most easily distinguish it from transformation in Pneumococcus and Hemophilus are the small size of the donor genome
and the knowledge of its structure from phage genetics. These characteristics are
reflected in the fact that the Gal" transformants always have c and in half of the cases
mi which come from the DNA. Since the linkage between Adg and c has been observed
at DNA concentrations as low as 0·1 Adg-equivalents per recipient bacterium, and
since the number of Gal» is a linear function of the DNA concentration, the simplest
interpretation is that the active molecules carry dg, c, and mi. Assuming that the
entire dg region, as mapped by Arber (1958), is present, and that the segments
between dg and c, and between c and mi are also present, this represents 90% of the
Adg map (Fig. 1). If the Adg genome contains all of the DNA in the phage, the active
molecules should have a molecular weight of 5 X 10 7 ("Materials and Methods,"
Section (g)).
In Pneumococcus and Hemophilus, on the other hand, most of the known transforming factors are transferred independently. This is to be expected in view of the fact
that a donor bacterium contains the equivalent of 25 to 60 DNA molecules of molecular weight 5 X 10⁷ whereas the molecule of transforming DNA is certainly not
more than 5 X 10 7 (see footnote 8, Table 8). Therefore, the Pneumococcus- and
Hemophilus-transforming DNA's are heterogeneous in that different molecules
represent different segments of the bacterial chromosome. Adg DNA does not exhibit
this form of heterogeneity since the active molecules comprise the entire donor phage
chromosome. The absence of this form of heterogeneity and the availability of a
variety of markers, all linked, should make Adg DNA useful for an analysis of the
chemical structure of the phage chromosome.
The authors wish to acknowledge the expert assistance given by Mr. and Mrs. R.
Barrand and thank Dr. B. N. Ames for the suggestion that the phenol technique be used
to extract A DNA.
REFERENCES
Adams, M. H. (1959). Bacteriophages, p. 443. New York-London: Interscience Publishers,
Inc.
Appleyard, R. K. (1954). Genetics, 39, 440.
Arbor, W. (1958). Arch. des Sci. Geneva, II, 259.
Beaven, G. H., Holiday, E. R. & Johnson, E. A. (1955). In The Nucleic Acids, ed. by
E. Chargaff & J. N. Davidson, Vol. I, p. 493. New York: Academic Press.
Campbell, A. (1957). Virology, 4, 366.
Chargaff, E. (1955). In The Nucleic Acids, ed, by E. Chargaff & J. N. Davidson, Vol. I,
p. 307. New York: Academic Press.
Dische, Z. (1955). In The Nucleic Acids, ed. by E. Chargaff & J. N. Davidson, Vol. I,
p. 285. New York: Academic Press.
Doty, P., Boedtker, H., Fresco, J. R., Haselkorn, R. & Litt, M. (1959). Proc. Nat. ,Acad.
Sci., Wash. 45, 482.
Fiske, C. H. & SubbaRow, Y. (1925). J. BioI. Chem, 66, 375.
Fox, M. (1957). Biochim. biophys. Acta, 26, 83.
Gandelman, B., Zamenhof, S. & Chargaff, E. (1952). Biochim. biophys. Acta, 9, 399.
Gierer, A. & Schramm, G. (1956). Z. Natur]. II6, 138.
Goodgal, S. H. & Herriott, R. M. (1957). In The Chemical Basis of Heredity, ed, by W. D.
McElroy & B. Glass, p. 336. Baltimore: Johns Hopkins Press.
Herriott, R. M. & Barlow, J. L. (1952). J. Gen. Physiol. 36, 17.
Hotchkiss, R. D. (1954). Harvey Lectures, 49, 124.
Jso.cob, F. & Wollman, E. (1954). Ann. Inst, Pasteur, 87, 653.
TRANSFORMATION OF E. COLI
415
Kaiser, A. D. (1955). Virology, 1, 424.
Kaiser, A. D. (1957). Virology, 3, 42.
Kaiser, A. D. & Jacob, F. (1957). Virology, 4, 509.
Kalckar, H. M., Kurahashi, K. & Jordan, E. (1959). Proc. Nat. Acad. Sci., Wash. 45, 1776.
Kay, E. M., Simmons, N. S. & Dounce, A. L. (1952). J. Amer. Ohern:Soc. 74, 1724.
Koerner, J. F. & Sinsheimer, R. L. (1957). J. Biol. Chern: 228, 1049.
Lederberg, J. (195'0). Methods in Medical Research, 3, 5.
Lederberg, J., Lederberg, E., Zinder, N. & Lively, E. (1951). Gold Spr. Harb. Symp.
Quant. Biol. 16, 413.
Lederberg, E. & Lederberg, J. (1953). Genetics, 38, 51.
Lee, K. Y., Wahl, R. & Barbu, E. (1956). Ann. Inst. Pasteur, 91, 212.
Lehman, 1. R., Bessman, M. J., Simms, E. S. & Kornberg, A. (1958). J. Biol. Ohem, 233,
163.
Lerman, L. S. & Tolmach, L. J. (1957). Biochim. biophys. Acta, 26, 68.
Lowry, O. R., Rosebrough, N. J., Farr, A. L. & Randall, R. J. (1951). J. Biol. Ghem. 193,
265.
Lwoff, A. (1953). Bact. Rev. 17, 320.
Mahler, H. R. & Frazer, D. (1959). Virology, 8, 401.
Marmur, J. & Doty, P. (1959). Nature, 183, 1427.
Marmur, J. & Lane, D. (1960). Proc. Nat. Acad. Sci., Wash. 46, 453.
Mejbaum, W. (1939). Z. physiol. Ohern: 258, 117.
Morse, M. L., Lederborg, E. & Lederberg, J. (1956). Genetics, 41, 143, 758.
Nagano, Y. & Oda, M. (1955). C.R. Soc. Biol., Paris, 149, 863.
Rice, R. A. & Doty, P. (1957). J. Amer. Chem. Soc. 79, 3937.
Rolfe, R. & Meselson, M. (1959). Proc. Nat. Acad. Sci., Wash. 45, 1039.
Schachman, H. K. (1957). In Methods in Enzymology, ed. by S. P. Colowick & N. O.
Kaplan, Vol. IV, p. 95. New York: Academic Press.
Sinsheimer, R. L. & Koerner, J. F. (1951). Science, 114, 42.
Spizizen, J. (1957). Proc, Nat. Acad. Sci., Wash. 43, 694.
Stent, G. S. & Fuerst, C. R. (1955). J. Gen. Physiol. 38, 441.
Sueoka, N., Marmur, J. & Doty, P. (1959). Nature, 183, 1429.
Watson, J. D. & Crick, F. H. C. (1953). Nature, 171, 737; Cold Spr, Harb. Symp. Quant.
Biol. 18, 123.
Weigle, J., Meselson, M. & Paigen, K. (1960). J. Mol. Biol. 1, 379.
Wollman, E., Jacob, F. & Hayes, W. (1956). Cold Spr. Harb. Symp. Quant. Biol. 21, 141.
Zamenhof, S. (1957). In The Chemical Basis of Heredity, ed. by W. D. McElroy & B.
Glass, p. 351. Baltimore: Johns Hopkins Press.
Zamonhof, S., Alexander, H. E. & Leidy, G. (1953). J. Exp. Med. 98, 373.