Arsenic pollution of groundwater in Vietnam exacerbated by deep aquifer exploitation for more than a century
Bạn đang xem bản rút gọn của tài liệu. Xem và tải ngay bản đầy đủ của tài liệu tại đây (2.69 MB, 6 trang )
Arsenic pollution of groundwater in Vietnam
exacerbated by deep aquifer exploitation
for more than a century
Lenny H. E. Winkela,1, Pham Thi Kim Trangb, Vi Mai Lanb, Caroline Stengela, Manouchehr Aminia,
Nguyen Thi Hac, Pham Hung Vietb, and Michael Berga,2
a
Eawag, Swiss Federal Institute of Aquatic Science and Technology, Ueberlandstrasse 133, 8600 Dübendorf, Switzerland; bCenter for Environmental
Technology and Sustainable Development (CETASD), Hanoi University of Science, 334 Nguyen Trai Street, Hanoi, Vietnam; and cVietnam Geological
Survey, Northern Hydrogeological and Engineering Geological Division (NHEGD), Nghia Tan ward, Cau Giay district, Hanoi, Vietnam
Edited by William A. Jury, University of California, Riverside, CA, and approved December 7, 2010 (received for review August 17, 2010)
Arsenic contamination of shallow groundwater is among the biggest health threats in the developing world. Targeting uncontaminated deep aquifers is a popular mitigation option although its
long-term impact remains unknown. Here we present the alarming
results of a large-scale groundwater survey covering the entire Red
River Delta and a unique probability model based on three-dimensional Quaternary geology. Our unprecedented dataset reveals
that ∼7 million delta inhabitants use groundwater contaminated
with toxic elements, including manganese, selenium, and barium.
Depth-resolved probabilities and arsenic concentrations indicate
drawdown of arsenic-enriched waters from Holocene aquifers
to naturally uncontaminated Pleistocene aquifers as a result of
>100 years of groundwater abstraction. Vertical arsenic migration
induced by large-scale pumping from deep aquifers has been discussed to occur elsewhere, but has never been shown to occur at
the scale seen here. The present situation in the Red River Delta is a
warning for other As-affected regions where groundwater is extensively pumped from uncontaminated aquifers underlying high
arsenic aquifers or zones.
three-dimensional risk modeling ∣ anthropogenic influence ∣ drinking
water resources ∣ geogenic contamination ∣ health threat
G
eogenic arsenic (As) contamination of groundwater is a
major health problem that has been recognized in several
regions of the world, especially in South and Southeast Asia
(Bengal delta (1, 2), Vietnam (3–5), Cambodia (6, 7), Myanmar
(8), and Sumatra (9)). In 2001 it was reported for the first time
that groundwater used as drinking water in the densely populated
Red River Delta in Vietnam contains high As levels (3). Since
then, regional groundwater studies have been carried out in
the vicinity of Hanoi city (10–30 km distance), on the banks of
the Red River and its adjacent floodplains (5, 10–14), and along
a 45 km transect across the southern and central part of the delta
(15). High As levels were found in both the Holocene and Pleistocene aquifers (3, 5, 10, 13). Private wells predominantly extract
water from the Holocene aquifers, whereas wells of urban treatment facilities tap Pleistocene aquifers (3). As is the case in other
areas in SE Asia, the mechanism responsible for high groundwater As levels is the microbial and/or chemical reductive
dissolution of As-bearing iron minerals in the aquifer sediments
(3–5, 10).
The Red River Delta is one of the most densely populated
regions in the world, with a population density of about
1;160 people∕km2 covering an area of some 14;000 km2 (16). Of
the 16.6 million (Mio) people that live in the Red River Delta,
11 Mio have no access to public water supply and are therefore
depending on other drinking water resources such as private tubewells. Given that groundwater is the main source of drinking
water (4), it is of crucial importance that contaminated wells be
identified. Here we present and discuss the results of an unprecedented groundwater study covering the entire Red River Delta.
1246–1251 ∣ PNAS ∣ January 25, 2011 ∣ vol. 108 ∣ no. 4
We report delta-wide concentrations of As and 32 other chemical
parameters and provide the complete geo-referenced database as
Dataset 1. We show that 65% of the studied wells exceed the
World Health Organization (WHO) guidelines for safe drinking
water for one or more chemical elements.
Arsenic risk maps for Southeast Asia were recently generated
using surface information such as surface geology and soil properties (8). In the present study we improved these subcontinental
scale predictions by developing a regional probability model for
the Red River Delta based on a new set of three-dimensionalgeological data (see Methods). Our data indicate that As enrichment in aquifers has been exacerbated by human activities, i.e.,
by the abstraction of large volumes of groundwater from Pleistocene aquifers. This finding has important implications for other
As-tainted regions in the world with comparable groundwater
flow systems and where water is pumped from deep aquifers at
high rates.
Results and Discussion
Arsenic Distribution in the Delta. The distribution of groundwater
As concentrations is illustrated in Fig. 1A. Maps depicting the
spatial distribution of an additional 32 chemical parameters
are provided in the hydrochemical atlas (SI Appendix: Section 5).
Arsenic concentrations were found to vary greatly throughout the
delta (<0.1 − 810 μgL−1 ) and 27% of the wells exceeded the
WHO guideline value of 10 μgL−1 . Our results imply that some
three million people are currently using groundwater burdened
with As concentrations >10 μgL−1 and one million people use
groundwaters containing >50 μgL−1 , with both rural and urban
populations being affected by toxic levels of As. The highest concentrations are present in a 20 km wide band along the NW-SE
boundary of the delta plain, to the SW of the modern Red River
course, and coinciding with the location of the palaeo-Red River
channel (9,000 y B.P.) (15). The spatial distribution of As in this
region matches a pattern of elevated PO4 3− , NH4 þ , and dissolved
organic carbon (DOC) concentrations, along with negative redox
Author contributions: P.T.K.T. and M.B. designed research and planned field campaigns;
L.H.E.W., P.T.K.T., V.M.L., C.S., M.A., N.T.H., P.H.V., and M.B. performed research;
L.H.E.W., M.A., and M.B. developed new modeling tools; L.H.E.W., P.T.K.T., and M.B.
analyzed and interpreted the data; and L.H.E.W. and M.B. wrote the paper.
The authors declare no conflict of interest.
This article is a PNAS Direct Submission.
Freely available online through the PNAS open access option.
Data deposition: Data, hydrochemical maps, modeled risk maps, and movies reported
in this paper were deposited on the website of Eawag and can be downloaded from
/>1
Present address: Institut des Sciences de la Terre, University of Grenoble, 1381 rue de la
Piscine, 38400 Saint Martin d’Heres, France.
2
To whom correspondence should be addressed. E-mail:
This article contains supporting information online at www.pnas.org/lookup/suppl/
doi:10.1073/pnas.1011915108/-/DCSupplemental.
www.pnas.org/cgi/doi/10.1073/pnas.1011915108
potentials (Eh) and low sulfate (SO4 ) concentrations indicating
anoxic groundwaters (Fig. 1 C and D and SI Appendix: Section 5).
These conditions are the trigger for reductive dissolution of iron
phases and subsequent release of surface-bound As (1, 17–21).
However, as is evident from Fig. 1E, As concentrations
only become particularly elevated (>50 μgL−1 ) where dissolved
sulfate levels are low, i.e., where sulfate reduction accompanied
by As sequestration in sulfide minerals is limited (20). Despite
the typically reducing conditions, at the scale of the delta, the
concentrations of As and Fe do not show a correlation. This
observation has previously been attributed to differential sequestration of As and Fe into sulphide minerals (17, 20, 22), or the
formation of other phases (e.g., siderite FeCO3 ) (10, 23).
Arsenic is the element of greatest toxicological concern in
the well waters. Second comes manganese (Mn) which can cause
malfunction in children’s development. Selenium (Se) and barium (Ba) are of lesser concern. With an average concentration
of 0.83 mgL−1 (max. 16.4 mgL−1 ), 44% of the wells exceed the
Mn WHO guideline of 0.4 mgL−1 . We estimate that this percentage corresponds to nearly five million people who thus consume
water with health-threatening Mn levels. Exposure to elevated
Mn in drinking water is associated with neurotoxic effects in
children, for example, a diminished intellectual function (24).
The spatial distribution of Mn (<0.01 − 16.4 mgL−1 ) (Fig. 2A)
and Fe (<0.05 − 140 mgL−1 ) is heterogeneous throughout the
delta (Fe map provided in SI Appendix), with Mn and As showing
an anticorrelation (R2 ¼ 0.00). The highest concentrations of Mn
and Fe are mainly found at negative Eh values (see Fig. 1 D and E
and SI Appendix), indicative of the reductive dissolution of Fe
Winkel et al.
and Mn-oxides according to the redox sequences of Fe and Mn
reduction. However, some overlap between Fe and Mn reduction
zones might occur (see Fig. 1E), as has also been observed on a
local scale (12). Further elements that notably exceed the WHO
guidelines are Se (19% >10 μgL−1 , max. 300 μgL−1 ) and Ba (7%
>700 μgL−1 , max. 5;100 μgL−1 ). The distribution of elevated Ba
and Se (Fig. 2B) closely resembles the distribution of Cl, SO4 ,
and Na in the coastal stretch, indicating a marine source. Nevertheless, Se concentrations are considerably higher than can be
expected from the Se/B ratio for seawater, which has an average
concentration of 0.45 μgL−1 Se compared to 4.5 mgL−1 B (25).
In summary, 65% of all studied wells exceed the WHO guideline values for As, Mn, Ba, Se, or a combination of these elements. Correspondingly, geogenic groundwater pollution in the
Red River Delta poses a serious long-term health threat to about
seven million people. This situation is particularly worrying because groundwater is the main source of drinking water (4).
Risk Modelling. Logistic regressions were applied to compute
weighting coefficients of independent variables for the two regional As risk models: one based on surface information and the other
based on three-dimensional geological data (see SI Appendix
and Movie S1). Table 1 lists the importance of, and weighting factors (λ) from the independent variables that showed significance
for the models. In agreement with the recently published subcontinental As prediction model for Southeast Asia (8), sedimentary
depositional environments make a larger contribution to the model than soil variables. Young organic-rich sediments (λ ¼ 1.46)
play a larger role than recent deltaic deposits (λ ¼ 0.60), which
PNAS ∣
January 25, 2011 ∣
vol. 108 ∣
no. 4 ∣
1247
ENVIRONMENTAL
SCIENCES
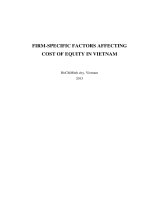
Fig. 1. Concentrations of As and selected parameters observed in groundwater of the Red River
Delta. High-resolution maps of each parameter are
in the SI Appendix. (A), Arsenic concentrations in
groundwater collected in the period from 2005 to
2007. (B), Depth of sampled tubewells. (C), Ammonium (NH4 þ ) concentration. (D), Redox potential
(Eh). (E), Concentration trends of As, Fe, Mn, phosphate (PO4 3− ), and sulfate (SO4 2− ) plotted against
measured redox potential (Eh). Concentrations were
normalized with regard to maximum concentrations
and smoothed, using a moving average filter with a
period of 30. (F), Simplified geological cross-section
along the transect D–D′ indicated in Fig. 1A. Further
geological transects are presented in Fig. S3.
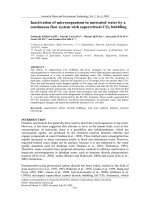
Fig. 2. Concentrations of Mn and Se observed in
groundwater of the Red River Delta. (A), Mn concentrations show a heterogeneous distribution throughout the delta. (B), Elevated Se concentrations are
found mainly along the coast and in aquifers affected
by seawater intrusions.
supports the importance of organic matter in the mobilization of
As (5, 26–28).
In the logistic regression model based on three-dimensional
geology data, the Lower Holocene (LH) aquifers (λ ¼ 3.95)
clearly show the highest probability (P) of being contaminated
with As. The sediments of this aquifer (lower boundary 3,000 y
B.P.; part of the Vinphuc and Haihung formations) are predominantly present in the incised valley of the Palaeo-Red River,
where they unconformably lie over the Pleistocene sediments
(Fig. 1F and geological cross-sections in Fig. S1). The LH aquifer
has a very irregular thickness and partly exists only as large
sandy lenses imbedded in a more silty matrix. The lithology is
characterized by gray, very fine-to-medium sands laminated with
greenish-gray silty-clays and organic-rich peat layers (5, 29, 30).
There are two Pleistocene aquifers. The Lower Pleistocene (LP)
aquifer, part of the Hanoi formation (lower boundary: 700,000 y
B.P.), mainly consists of coarse yellow and brown sediments
(15, 29) and is the only aquifer in the delta with an almost homogeneous presence. The Upper Pleistocene (UP) aquifer (lower
boundary 125,000 y B.P.; part of the Vinphuc formation) has a
more irregular appearance and generally shows a fining-upward
structure, starting off with pebbly sands and ending with fine
sands. Both Pleistocene aquifers play a minor role in the model
[λ ¼ 0.88 (LP) and 0.79 (UP)]. The youngest aquifer [Upper
Holocene (UH), lower boundary 1,000 y B.P.] mostly lies on
top of a massive clay layer and is part of the Thai Binh formation.
The UH aquifer consists of sandy silt and clay deposited in a delta
plain environment (29, 31). The UH aquifer did not show significance during logistic regressions (p − value > 0.05). The shallow
depth and near-coastal location of the UH aquifer indicate saline
groundwaters, which are generally not suitable for consumption.
Furthermore, the unconfined character of this aquifer in combiTable 1. Results of logistic regression analysis
Prediction model
Surface variables
Output variable
Organic-rich deposits
Deltaic deposits
Alluvial deposits
Medium-textured soils
−
Regression constant
Three-dimensional Lower Holocene aquifer
geology
Lower Pleistocene aquifer
Upper Pleistocene aquifer
−
Regression constant
λ
1.46
0.60
0.59
0.46
–1.55
3.95
0.88
0.79
–1.98
Wald p-value
14.44
5.53
4.08
4.19
73.65
54.81
5.26
4.48
41.38
0.000
0.019
0.043
0.041
0.000
0.000
0.022
0.034
0.000
Statistically evaluated weighting coefficients of the independent variables
in this study that were used to compute probabilities of As contamination are
denoted by λ. Wald and p-values indicate the significance of the variables.
Wald values give the relative importance in percentages and p-values the
absolute significance, where a value <0.05 indicates a significance of at
least 95%. Variables that were not statistically significant (p > 0.05) were
not considered in the modelling, i.e., other Holocene deposits, preHolocene sediments, coarse and fine soil textures, sand, silt, and clay soil
contents in the surface-based model, and the Upper Holocene aquifer in
the model based on three-dimensional geology.
1248 ∣
www.pnas.org/cgi/doi/10.1073/pnas.1011915108
nation with high SO4 levels and low organic matter minimizes the
probability of high As levels in the UH aquifer (20).
Arsenic Probability Maps. Fig. 3 A and B illustrate the probability of
groundwater As exceeding 10 μgL−1 , computed with the model
based on three-dimensional geology and surface information, respectively. The probability map derived from three-dimensional
geology (Fig. 3A) presents the average probability for all depths
between 0 and 50 m. The individual probability maps (at given
depths) locally indicate probabilities up to 0.9 (see Fig. 4). The
classification results of both models are given in the SI Appendix:
Sections 3.1 and 3.2. The model based on geology at depth is statistically better than the model based on surface parameters (74%
vs. 65% correct classifications). Apart from the soil imprint in the
surface model (P ¼ 0.4, orange color, Fig. 3B) which coincides
with the modern Red River course (medium soil), the distribution
of high and low probability levels is quite similar. The highest
probabilities are found where organic-rich sediments are present,
either at the surface (Fig. 3B) (organic-rich deposits) or at depth
(LH aquifer) (Fig. 3A), and both models correctly delineate the
20 km wide strip with elevated As levels to the SW of the modern
Red River course. This result underlines the strength of predictions solely based on surface parameters. Three-dimensional As
risk modeling is a very valuable tool that can be applied in other
As-affected regions of the world, but it must be kept in mind that
aquifers are complex and heterogeneous and that misclassifications at a local scale are inevitable. Monitoring of groundwater
quality will therefore remain an important task in the future.
Furthermore, actual groundwater flow paths can’t be modeled
with a static approach and therefore three-dimensional risk modeling would ideally be complemented with dynamic hydrological
models that could indicate flow directions and changes of flow.
Arsenic Risk Areas at Depth and Indication of Downward Arsenic Migration. Probability maps derived from the three-dimensional
model can potentially be an important resource for mitigation
of As because they indicate where and at which depths tubewells
can be expected to produce safe (low-As) groundwater. In the
last part of this section, we interpret the probability maps and
we show that depth-resolved probabilities in combination with
measured As concentrations indicate a vertical transport of As
from shallower Holocene aquifers into naturally uncontaminated
Pleistocene aquifers.
Fig. 4A shows the three-dimensional distribution of As exceeding 10 μgL−1 , stacked at 10 m depth intervals. Selected probability maps thereof are overlain by As concentrations at different
well-depth ranges (Figs. 4 B–D). Individual probability maps
at depths of 0–60 m and 0–100 m with As concentrations at
corresponding depths are provided in Figs. S8 and S10 and
Movie S2). The high-risk area (P > 0.4) at 10–20 m depth
(Fig. 4B) has a NW-SE trend and largely coincides with the position of the former Palaeo-Red River where sediments of the LH
aquifer unconformably overlie the Pleistocene sediments (see
Winkel et al.
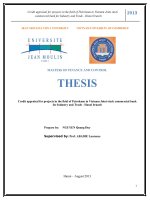
Fig. 3. Modeled probability of As concentrations
exceeding 10 μgL−1 . (A), Average probabilities based
on three-dimensional geology integrated over the
depth range of 0–50 m (74% correctly classified).
(B), Probabilities obtained from the prediction model
based on land-surface geology and soil data (65%
correctly classified).
high-As wells (>50 μgL−1 ) located in the low-risk area between
the two high-risk patches (Fig. 4C). These five wells actually
tap the UP aquifer below the As-contaminated LH aquifer
(Fig. 4B).
The high As concentrations in the generally low-As UP aquifer
could be explained by the reduction and mobilization of As
adsorbed to sediments, triggered by the leaching of organic
matter from peat deposits above (5, 21, 26, 27, 33). However,
considering the high As concentrations (>50 μgL−1 ) in those five
wells, a more plausible explanation would be vertical leaching of
As-enriched groundwater from the LH aquifer or clay-dominated
layer into the UP aquifer. This explanation is supported by the
results of in-depth groundwater studies conducted at Hoang
Liet village and in the area of Nam Du, where LH aquitards
were found to be leaky, causing vertical percolation of As-rich
groundwater from the LH to the Pleistocene aquifers (5, 13).
Impact of Long-Term Pumping. Below 50 m depth, no Holocene
aquifers are present in the delta, and therefore the calculated
probabilities of finding As are low (see probability map 50–60 m,
Fig. 4D and Fig. S8,). However, also in the Pleistocene aquifers,
ENVIRONMENTAL
SCIENCES
Movie S1 and Fig. S4). The 84% correctly classified As concentrations in the 10–20 m depth interval are an excellent result (see
Fig. 4B), particularly in light of the frequently observed heterogeneity of As concentrations, even over short distances (5, 21, 32).
With increasing depth (Fig. 4C), the high-risk area in the west
splits up into two main patches. The spatial agreement between
predicted and measured As concentrations is somewhat lower at
20–30 m than at 10–20 m (72% correctly classified, see Fig. 4C)
and especially the percentage of false-negative classifications
is higher (25% vs. 13%), indicating that As-tainted wells
(>10 μgL−1 ) are present in low-risk areas. Moreover, the As
concentrations at a depth of 20–30 m show a better match with
the probability map for 10–20 m, which is supported by a better
classification result (Fig. 4D). Furthermore, a McNemar’s chisquared test and a Kappa test showed that the agreement
between measured and predicted data is statistically significant
different (p < 0.05) between data shown in Fig. 4D and data
in Fig. 4 B and C. Particularly, the number of false-negative cases
was lowered from 25 to 17%, indicating that the number of
As-tainted wells lying in a low-risk area is markedly lower.
The better classification in Fig. 4D is demonstrated by the five
Fig. 4. Risk of As pollution plotted in three dimensions and at 10 m depth intervals. (A), three-dimensional distribution of As exceeding 10 μgL−1 , stacked
at 10 m depth intervals (see also Fig. S8). (B), Average
probability and measured As concentrations at a
depth of 10–20 m [mean sea level (m.s.l.)]. Model
classification results based on a probability cut-off
value of 0.4 are: 84% correctly classified, 3% falsepositive (As <10 μgL−1 in high-risk areas), and 13%
false-negative (As >10 μgL−1 in low-risk areas). (C),
Average probability and measured As concentrations
at a depth of 20–30 m (m.s.l.). Classification results
are: 72% correct, 3% false-positive, and 25% falsenegative. (D), Average probability and measured
As concentrations at a depth of 10–20 m (same probability data as in Fig. 4B) overlain by As concentrations from 20–30 m. Classification results are better
than those for Fig. 4C: 74% correct, 9% false-positive,
and 17% false-negative.
Winkel et al.
PNAS ∣
January 25, 2011 ∣
vol. 108 ∣
no. 4 ∣
1249
Fig. 5. As concentrations in Pleistocene aquifers of
the Red River Delta at depths >50 m. (A), Highest As
concentrations (up to 330 μgL−1 ) in the Pleistocene
aquifer are found in the same area where high As
concentrations are present in shallower, Holocene
aquifers (see also Fig. 1A). (B), The Hanoi area outlined by the box in Fig. 5A. Arsenic concentrations
of the Hanoi area were provided by the Vietnam
Geological Survey. The interpolated As concentration map was obtained by ordinary kriging of this
dataset (n ¼ 307). Contour lines of piezometric
heads (recorded in Dec. 2006) depict the pronounced
drawdown of Pleistocene groundwater levels (down
to −34 m), caused by extensive groundwater pumping by the Hanoi Water Works (5).
groundwater As concentrations exceed 10 or even 50 μgL−1 (max
330 μgL−1 ). It is noteworthy that the highest As concentrations
(>100 μgL−1 ) are present in the same stretch in which the
Holocene aquifers are contaminated by high As levels. Upon
closer inspection, wells with the highest As concentrations in
the Pleistocene aquifers (LP and UP) are mainly localized south
of Hanoi, i.e., in the densely populated former province of Ha
Tay (2,386,000 inhabitants in 1999) which merged with Hanoi in
2008, and in the vicinity of the cities Ninbinh, Namdinh, and
Thaibinh (see Fig. 5A). Berg et al. (5) have shown that the area
south of Hanoi contains elevated As concentrations (130 μgL−1 )
in the Pleistocene aquifer due to groundwater abstraction by
the Hanoi water works, resulting in the vertical downward migration of reducing conditions and/or downward transport of Astainted waters to the Pleistocene aquifers (see Fig. 5B).
To get a better understanding of the presence of As in Pleistocene aquifers of Hanoi, we established a local prediction model
based on three-dimensional geology (see Fig. S7 and Tables S6
and S7). This Hanoi model performs poorly with only 55% correct classifications, which indicates that in this area natural variables fail to explain the As concentrations in the groundwater.
This circumstance suggests the strong impact of human activities,
i.e., large-scale groundwater pumping, on the As concentrations
in the Pleistocene aquifers below Hanoi.
Groundwater exploitation from the deep aquifers in Hanoi
began more than 110 y ago (1894) (3) to meet the water needs
of the growing city under the French administration. The demand
for water for domestic and industrial purposes has gradually
increased since then, and the large quantity of 750;000 m3 ∕day
of groundwater is pumped today from the deep aquifers in the
Hanoi area alone, with an additional 500;000 m3 ∕day withdrawn
in the southern part of the Red River Delta (34). Our data indicate that large-scale groundwater abstraction from deep aquifers
has actually impacted a much larger area of Pleistocene groundwater resources in the Red River Delta than has been previously
known. Consequently, elevated As concentrations in the Pleistocene aquifers in Hanoi and in the vicinity of Ninh Binh, Nam
Dinh, and Thai Binh seriously threat the quality of urban drinking
water derived from these aquifers.
Implications and Future Prospects. It has been discussed in literature
that excessive groundwater withdrawal could induce downward
migration of As-enriched groundwater or organic matter and
eventually lead to the contamination of currently As-free Pleistocene aquifers, for example in the most severely As-affected
Bengal Basin, and elsewhere (21, 33, 35–38). Both Vietnam
and Bangladesh exploit deep aquifers for urban water supply.
However, whereas groundwater in Bangladesh is heavily used for
irrigation, agricultural fields in Vietnam are irrigated with river
water. Previously, it has been suggested that oxidized sediments
in Pleistocene aquifers have a significant capacity to attenuate As
over hundreds of years because of adsorption (39). However, our
present results indicate that this assumption might be proven
1250 ∣
www.pnas.org/cgi/doi/10.1073/pnas.1011915108
wrong in situations where groundwater drawdown is pronounced.
The lithologic composition and chemical conditions of Pleistocene sediments (i.e., oxidized pebbly coarse sand to fine sand)
as well as of Holocene sediments in the Red River Delta are comparable to those in the Bengal Basin (14, 21), but groundwater
exploitation from Pleistocene aquifers in Vietnam began some
50–70 y earlier than in Bangladesh. Therefore, the present situation in Vietnam should be considered a warning of what can
happen as a result of decades of groundwater abstraction from
deep aquifers located below As-rich zones: the significant propagation of As to previously safe aquifers.
Use of groundwater that contains elevated concentrations of
As and other geogenic contaminants, as well as groundwater
pumped from deep aquifers in the vicinity of shallow high-As
aquifers, should, in the long term, be avoided by the utilization
of other sources of drinking water. Alternatively, appropriate
water treatment technologies must be evaluated and installed
to produce sustainable drinking water that meets safe waterquality standards for both rural and urban populations.
Methods
Groundwater Data. Groundwater samples were collected from 512 private
tubewells in the Red River Delta floodplains during three field campaigns
(May–June 2005, November–December 2005, and January 2007), according
to a random sampling strategy. The delta area was divided into grid cells
of 25 km2 (5 × 5 km) and in each cell one tubewell was randomly chosen
(sampling locations are shown in the hydrochemical atlas of the SI
Appendix: Section 5). The study area is positioned at a latitude of 20.00°N
to 21.57°N and a longitude of 105.07°E to 106.99°E.
Procedures of sampling and analysis were carried out as described in
Berg et al. (2008)(5). Briefly, samples were collected after 15–30 min of
prepumping to obtain stable levels of dissolved O2 and Eh. Two samples
were collected from each groundwater well. One of these two samples
was filtered in the field (0.45 μm) and acidified (1% HNO3 ). All samples were
immediately shipped to the laboratory and stored at 4 °C in the dark until
analysis. The chemical constituents were quantified from triplicate analyses.
As concentrations were measured with high-resolution, inductivelycoupled-plasma mass spectrometry (HR ICP-MS, Element 2, Thermo Fisher)
and cross-checked by atomic fluorescence spectroscopy (AFS, PS Analytical)
or AAS (see Table S1). Fe, Mn, Na, K, Ca, Mg, and Ba concentrations were
measured by inductively-coupled-plasma optical emission spectroscopy
(ICP-OES, Spectro Ciros CCD, Kleve); Co, Ni, Cu, Zn, Pb, Cr, Cd, and Ba by
ICP-MS; ammonium and phosphate by photometry; nitrate, sulfate, and
chloride by ion chromatography (Dionex); alkalinity by titration; and DOC
with a TOC 5000 A analyzer (Shimadzu). Details on the robustness of the
measurements and limits of quantification are provided in SI Appendix:
Section 1 and in Berg et al. (2008) (5).
Model Variables: Geological Data. The three-dimensional geological data
between 0 and −100 m were obtained by the interpretation and interpolation (ordinary kriging) of 94 sediment cores in the Red River Delta (drilled by
Northern Hydrogeological and Engineering Geology Division). Quaternary
sedimentary units recognized in these sediment cores were correlated and
subsequently classified into aquifers and aquitards of the Holocene or
Pleistocene periods based on predominant lithology (grainsize) and age
[14 C dating (40, 41)]. On a regional scale, four different aquifers of the
Winkel et al.
the ratio of the probability (P) that an event occurs to the probability that
it fails to occur logðP∕ð1 − PÞ):
lnðoddsÞ ¼ C þ
n
∑
λi X i ;
[1]
i¼1
where C is the intercept of regression, X i are independent variables, and
λi are the weighting coefficients that were obtained using the maximum
likelihood procedure (42). Exponential values of coefficients, Wald statistics,
and p-values (Table 1) indicate the importance of each variable. Independent
variables that were statistically proven insignificant were excluded from the
model during one of the subsequent regression steps. The threshold for
maintaining a variable in the model was determined by the 95% significance
level (p < 0.05). According to the calculated odds, the probability (P) of
having an As concentration above 10 μgL−1 was calculated as follows:
P¼
n
λX Þ
∑i¼1 i i :
n
λX Þ
1 þ expðC þ
∑i¼1 i i
expðC þ
[2]
As Prediction Model Development. As prediction models were obtained by:
(i) binary coding of As groundwater concentration data (dependent variable),
using the WHO guideline value for As in drinking water (10 μgL−1 ) as a
threshold; (ii) conducting logistic regression; and (iii) calculating the probability of As contamination based on the threshold value. We used groundwater
As concentrations (see Dataset 1) as a dependent variable. Well depths were
corrected using a digital elevation model and are expressed relative to the
mean sea level.
Logistic regression was applied to determine the weighting of the independent variables (8). Briefly, log(odds) was modeled, which is defined as
ACKNOWLEDGMENTS. We gratefully acknowledge Dao Manh Phu and Bui
Hong Nhat for excellent support with groundwater sampling, M. Langmeier
and R. Illi for anion analyses, A. Ammann and D. Kistler for assistance in ICP
analyses, Luis Rodriguez-Lado for statistical tests, Nguyen Van Dan for access
to geological data, and R. Johnston for comments on the manuscript. This
work was substantially funded by the Swiss Agency for Development and
Cooperation within the capacity building project “Environmental Science
and Technology in Northern Vietnam.”
1. Nickson R, et al. (1998) Arsenic poisoning of Bangladesh groundwater. Nature
395:338–338.
2. Chowdhury UK, et al. (2000) Groundwater arsenic contamination in Bangladesh and
West Bengal, India. Environ Health Persp 108:393–397.
3. Berg M, et al. (2001) Arsenic contamination of groundwater and drinking water in
Vietnam: a human health threat. Environ Sci Technol 35:2621–2626.
4. Berg M, et al. (2007) Magnitude of arsenic pollution in the Mekong and Red River
Deltas—Cambodia and Vietnam. Sci Total Environ 372:413–425.
5. Berg M, et al. (2008) Hydrological and sedimentary controls leading to arsenic
contamination of groundwater in the Hanoi area, Vietnam: the impact of iron-arsenic
ratios, peat, river bank deposits, and excessive groundwater abstraction. Chem Geol
249:91–112.
6. Polya DA, et al. (2005) Arsenic hazard in shallow Cambodian groundwaters. Mineral
Mag 69:807–823.
7. Buschmann J, et al. (2008) Contamination of drinking water resources in the
Mekong delta floodplains: arsenic and other trace metals pose serious health risks
to population. Environ Int 34:756–764.
8. Winkel L, Berg M, Amini M, Hug SJ, Johnson CA (2008) Predicting groundwater arsenic
contamination in Southeast Asia from surface parameters. Nat Geosci 1:536–542.
9. Winkel L, Berg M, Stengel C, Rosenberg T (2008) Hydrogeological survey assessing
arsenic and other groundwater contaminants in the lowlands of Sumatra, Indonesia.
Appl Geochem 23:3019–3028.
10. Postma D, et al. (2007) Arsenic in groundwater of the Red River floodplain,
Vietnam: controlling geochemical processes and reactive transport modeling. Geochim Cosmochim Ac 71:5054–5071.
11. Larsen F, et al. (2008) Controlling geological and hydrogeological processes in an
arsenic contaminated aquifer on the Red River flood plain, Vietnam. Appl Geochem
23:3099–3115.
12. Eiche E, et al. (2008) Geochemical processes underlying a sharp contrast in groundwater arsenic concentrations in a village on the Red River delta, Vietnam. Appl Geochem 23:3143–3154.
13. Norrman J, et al. (2008) Arsenic mobilization in a new well field for drinking water
production along the Red River, Nam Du, Hanoi. Appl Geochem 23:3127–3142.
14. van Geen A, et al. (2008) Comparison of arsenic concentrations in simultaneouslycollected groundwater and aquifer particles from Bangladesh, India, Vietnam, and
Nepal. Appl Geochem 23:3244–3251.
15. Jessen S, et al. (2008) Palaeo-hydrogeological control on groundwater As levels in Red
River delta, Vietnam. Appl Geochem 23:3116–3126.
16. Luu TNM, et al. (2010) Hydrological regime and water budget of the Red River Delta
(Northern Vietnam). J Asian Earth Sci 37:219–228.
17. McArthur JM, Ravenscroft P, Safiullah S, Thirlwall MF (2001) Arsenic in groundwater:
testing pollution mechanisms for sedimentary aquifers in Bangladesh. Water Resour
Res 37:109–117.
18. Islam FS, et al. (2004) Role of metal-reducing bacteria in arsenic release from Bengal
delta sediments. Nature 430:68–71.
19. Ford RG, Fendorf S, Wilkin RT (2006) Introduction: controls on arsenic transport in
near-surface aquatic systems. Chem Geol 228:1–5.
20. Buschmann J, Berg M (2009) Impact of sulfate reduction on the scale of arsenic
contamination in groundwater of the Mekong, Bengal and Red River deltas. Appl
Geochem 24:1278–1286.
21. Fendorf S, Michael HA, van Geen A (2010) Spatial and temporal variations of groundwater arsenic in South and Southeast Asia. Science 328:1123–1127.
22. Moore JN, Ficklin WH, Johns C (1988) Partitioning of arsenic and metals in reducing
sulfidic sediments. Environ Sci Technol 22:432–437.
23. Herbel M, Fendorf S (2006) Biogeochemical processes controlling the speciation and
transport of arsenic within iron coated sands. Chem Geol 228:16–32.
24. Wasserman GA, et al. (2006) Water manganese exposure and children's intellectual
function in Araihazar, Bangladesh. Environ Health Persp 114:124–129.
25. Hem JD (1985) Study and interpretation of the chemical characteristics of natural
water. Water Supply Paper 2254 3rd Ed (US Geological Survey, Reston, VA).
26. McArthur JM, et al. (2004) Natural organic matter in sedimentary basins and its
relation to arsenic in anoxic ground water: the example of West Bengal and its
worldwide implications. Appl Geochem 19:1255–1293.
27. Meharg AA, et al. (2006) Codeposition of organic carbon and arsenic in Bengal Delta
aquifers. Environ Sci Technol 40:4928–4935.
28. Rowland HAL, et al. (2007) The control of organic matter on microbially mediated iron
reduction and arsenic release in shallow alluvial aquifers, Cambodia. Geobiology
5:281–292.
29. Nghi T, Ngo QT, Do TVT, Nguyen DM, Nguyen VV (1991) Quaternary sedimentation of
the principal deltas of Vietnam. J Southeast Asian Earth 6:103–110.
30. Tanabe S, et al. (2006) Holocene evolution of the Song Hong (Red River) delta system,
northern Vietnam. Sediment Geol 187:29–61.
31. Hanebuth TJJ, Saito Y, Tanabe S, Vu QL, Ngo QT (2006) Sea levels during late marine
isotope stage 3 (or older?) reported from the Red River delta (northern Vietnam) and
adjacent regions. Quatern Int 145–146:119–134.
32. Papacostas NC, Bostick BC, Quicksall AN, Landis JD, Sampson M (2008) Geomorphic
controls on groundwater arsenic distribution in the Mekong River Delta, Cambodia.
Geology 36:891–894.
33. Ravenscroft P, McArthur JM, Hoque BA (2001) Geochemical and palaeohydrologicical
controls on pollution of groundwater by arsenic. In Arsenic exposure & Health Effects
IV (Elsevier, Oxford).
34. Cao TH, et al. (2005) Improving the supply water quality of Hanoi. Part 1: current
situation of supply water and challenges for treatment technology. Magazine of
the Vietnam Water Supply and Sewerage Association 7:31–35 (in Vietnamese).
35. Harvey CF, et al. (2002) Arsenic mobility and groundwater extraction in Bangladesh.
Science 298:1602–1606.
36. van Geen A, et al. (2003) Spatial variability of arsenic in 6,000 tube wells in a 25 km(2)
area of Bangladesh. Water Resour Res 39:1140 10.1029/2002WR001617.
37. Michael HA, Voss CI (2008) Evaluation of the sustainability of deep groundwater as
an arsenic-safe resource in the Bengal Basin. Proc Natl Acad Sci USA 105:8531–8536.
38. Polizzotto ML, Kocar BD, Benner SG, Sampson M, Fendorf S (2008) Near-surface
wetland sediments as a source of arsenic release to ground water in Asia. Nature
454:505–508.
39. Stollenwerk KG, et al. (2007) Arsenic attenuation by oxidized aquifer sediments in
Bangladesh. Sci Total Environ 379:133–150.
40. Tanabe S, et al. (2003) Sedimentary facies and radiocarbon dates of the Nam Dinh-1
core from the Song Hong (Red River) delta, Vietnam. J Asian Earth Sci 21:503–513.
41. Tanabe S, et al. (2003) Song Hong (Red River) delta evolution related to millenniumscale Holocene sea-level changes. Quaternary Sci Rev 22:2345–2361.
42. Kleinbaum DG, Klein M (2002) Logistic Regression: a self-learning text (Springer,
New York).
Winkel et al.
PNAS ∣
January 25, 2011 ∣
vol. 108 ∣
no. 4 ∣
1251
ENVIRONMENTAL
SCIENCES
Quaternary period are present: LP aquifer (lower boundary 700,000 y B.P.),
UP aquifer (125,000 y B.P.), LH aquifer (3,000 y B.P.), and UH aquifer (1,000
B.P.). Three Quaternary aquitards were identified based on a lithology dominated by clay layers and occasionally intercalated peat lenses.
From the classified three-dimensional geology data, five litho-stratigraphical cross-sections were derived (Fig. 1F and Fig. S3) and 36 geological
maps were constructed for specific depths: 2 m depth intervals for depths
of 0–50 m below sea level (b.s.l.) and 10 m depth intervals for depths of
50–100 m b.s.l. (see Movie S1). These maps were used as independent
variables in our As prediction model for the Red River Delta. A second model
was made of the same area, but using surface data as independent variables.
For this second model the same independent variables were used as in the
SE-Asia model (8). These variables are deltaic deposits, alluvial deposits,
organic-rich deposits, tidal deposits, other and pre-Holocene deposits, as
well as percentages of silt, clay, and sand in both the topsoil (0–30 cm) and
subsoil (30–100 cm) and coarse, medium, and fine soil textures. For information on data sources, see Winkel et al. (2008)(8).