Chất lượng hình ảnh trong XQuang (Image quality dx rad imaging physics course)
Bạn đang xem bản rút gọn của tài liệu. Xem và tải ngay bản đầy đủ của tài liệu tại đây (822.43 KB, 19 trang )
Image Quality – Bushberg Chapter 10
Diagnostic Radiology Imaging Physics Course
16 December 2004
What Makes for a ‘Quality’ Image?
Image Quality – Chapter 10
¬
Insert audience participation here
Brent K. Stewart, PhD, DABMP
Professor, Radiology and Medical Education
Director, Diagnostic Physics
a copy of this lecture may be found at:
/>
Brent K. Stewart, PhD, DABMP
1
Brent K. Stewart, PhD, DABMP
Take Away: Five Things You should be able
to Explain after the Image Quality Lecture
¬
¬
¬
¬
¬
Image Quality - Motivation
The differences between subject, detector and
radiographic contrast and what factors affect each
How the Modulation Transfer Function (MTF) describes
an imaging system’s spatial resolution characteristics
How the number of photons used in imaging affects the
perceived quantum noise and contrast resolution
Why aliasing wraps high frequency image information
into lower frequencies and how this affects an image
Methods used to describe an imaging system’s
performance, including Detective Quantum Efficiency
(DQE), ContrastContrast-Detail curves and ROC curves
Brent K. Stewart, PhD, DABMP
Brent K. Stewart, PhD, DABMP
2
¬
¬
¬
¬
¬
3
Applies to all types of images
‘Quality’: subjective notion, dependent on image function
Bottom line outcome measure of a radiological image is
its usefulness in determining an accurate diagnosis
Understanding the image characteristics that comprise
image quality important so that radiologists can
recognize problems and articulate their cause
Introduction to the terminology used for various metrics
used by physicists and engineers to measure image
quality, e.g., contrast, spatial resolution and noise
Brent K. Stewart, PhD, DABMP
4
1
Image Quality – Bushberg Chapter 10
Diagnostic Radiology Imaging Physics Course
16 December 2004
Contrast
¬
¬
¬
Subject Contrast (Cs)
What is contrast?
The difference in the image
gray scale between closely
adjacent regions of the image
Medical image contrast the
result of many steps during
acquisition, processing and
display
¬
¬
¬
¬
¬
¬
¬
¬
Difference in some aspect of
the signal prior to it being
recorded
Consequence of fundamental
differences in the object, e.g.,
in xx-ray intensity based on
attenuation
Cs = (A(A-B)/A
µ(x+z)
For A=N0e-µx and B=N0e-µ(x+z)
-µz
Cs = 11-e
either µ(E) or z to Cs
E to µ(E) and thus Cs
Why low kVp used in
mammography
c.f. Bushberg, et al. The Essential Physics of Medical
Imaging, 2nd ed., p. 256.
5
¬
¬
¬
¬
c.f. Bushberg, et al. The Essential Physics of Medical
Imaging, 2nd ed., pp. 257257-258.
6
Brent K. Stewart, PhD, DABMP
Brent K. Stewart, PhD, DABMP
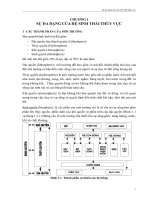
Detector Contrast (Cd)
Radiographic Contrast (Cr)
A detector’s characteristics
play an important role in
producing contrast in the final
image
Cd determined principally by
how the detector ‘maps’
detected energy into the output
signal
Characteristic curve (e.g., H&D
curve): input radiation
exposure to output value
(analog or digital)
Output of digital imaging
system a digital value for each
pixel: gray scale value
¬
¬
¬
¬
¬
¬
¬
c.f. Bushberg, et al. The Essential Physics of Medical
Imaging, 2nd ed., p. 260.
7
Brent K. Stewart, PhD, DABMP
Brent K. Stewart, PhD, DABMP
For screenscreen-film radiography
analog film OD the output
Cr = ODA - ODB
In radiography the contrast
cannot in general be adjusted
or enhanced on the analog film
How does the final light signal
reaching the radiologist’s eyes
depend on patient thickness
(assuming a constant µ)?
X ∝ e-µx
OD ∝ g · log10(X)
T = 10-OD
c.f. Bushberg, et al. The Essential Physics of Medical
Imaging, 2nd ed., pp. 259 and 261. 8
Brent K. Stewart, PhD, DABMP
2
Image Quality – Bushberg Chapter 10
Diagnostic Radiology Imaging Physics Course
16 December 2004
Huda 2nd Edition – Chapter 5 – Image Quality
Digital Radiographic and Displayed Contrast
¬
¬
¬
¬
ContrastContrast-toto-noise ratio (CNR)
= (A(A-B)/σ
B)/σ, with σ = image noise
Due to the ability to postpostprocess digital images, the
CNR is a more relevant
description of the contrast
potential in the image than
simply the contrast itself
Alter appearance of image
through looklook-upup-table (LUT)
transformation
LUT slope related to displayed
image contrast
¬
1. The object contrast does not depend on the lesion’s:
¬
A. Thickness
B. Density
C. Atomic number
D. Background composition
E. Temperature
¬
¬
¬
¬
c.f. Bushberg, et al. The Essential Physics of Medical
Imaging, 2nd ed., p. 262.
9
Brent K. Stewart, PhD, DABMP
Brent K. Stewart, PhD, DABMP
Raphex 2003 Diagnostic Question
Huda 2nd Edition – Chapter 5 – Image Quality
¬
D6.
D6. Which of the following will increase subject contrast
in a screenscreen-film imaging system?
¬
A. Decreasing the grid ratio
B. Decreasing the kVp
C. Increasing the developer temperature
D. Increasing the focal spot size
E. Increasing xx-ray beam filtration
¬
¬
¬
¬
Brent K. Stewart, PhD, DABMP
Brent K. Stewart, PhD, DABMP
¬
2. Subject contrast depends on:
¬
A. Focal spot to film distance
B. mAs
C. Tube voltage
D. Developer temperature
E. Film gradient
¬
¬
¬
¬
11
Brent K. Stewart, PhD, DABMP
10
12
3
Image Quality – Bushberg Chapter 10
Diagnostic Radiology Imaging Physics Course
16 December 2004
Huda 2nd Edition – Chapter 5 – Image Quality
Raphex 2000 Diagnostic Question
¬
D10.
D10. Image receptor contrast (as opposed to subject
contrast) depends on:
¬
A. H&D characteristic curve of the film.
B. kVp.
C. ScreenScreen-film contact.
D. SourceSource-toto-image receptor distance (SID).
¬
¬
¬
¬
3. Film contrast, as opposed to subject contrast, is
affected primarily by:
¬
A. Tube voltage
B. Iodine contrast
C. Use of grid
D. Differences in Z
E. Optical density
¬
¬
¬
¬
Brent K. Stewart, PhD, DABMP
13
Brent K. Stewart, PhD, DABMP
Spatial Resolution
¬
¬
¬
¬
Spatial Domain: the Point Spread Function
2D image really 3D: H, W (both spatial) and gray scale
Spatial resolution is a property that describes the ability
of an imaging system to accurately depict objects in the
two spatial dimensions of the image (x,y)
Classic notion: ability of an imaging system to distinctly
depict objects as they become smaller and closer
together
The spatial domain refers to the two spatial dimensions
(x,y) of an image
Brent K. Stewart, PhD, DABMP
Brent K. Stewart, PhD, DABMP
14
¬
One method of measuring the
spatial resolution to stimulate
system with a pointpoint-spread
function (PSF)
¬
Stationary: PSF constant over
entire fieldfield-ofof-view (FOV)
NonNon-stationary: PSF not const.
As each small area of the input
signal to an image acts as a
point stimulus, the output
image is just the collection of
these point stimuli convolved
with the PSF (convolution = )
¬
¬
¬
15
Isotropic and nonnon-isotropic
c.f. Bushberg, et al. The Essential Physics of Medical
Imaging, 2nd ed., p. 264.
16
Brent K. Stewart, PhD, DABMP
4
Image Quality – Bushberg Chapter 10
Diagnostic Radiology Imaging Physics Course
16 December 2004
Spatial Domain: the Point Spread Function
Image Processing Based on Convolution
¬
¬
stationary
¬
non-stationary
Input(x,y)
PSF(x,y)
Output(x,y)
Effect: blurring edges and fine detail*
¬
more regarding
in the DR lecture
c.f. Bushberg, et al. The Essential Physics of Medical
c.f. Bushberg, et al. The Essential Physics of Medical
Imaging, 2nd ed., p. 264.
Imaging, 2nd ed., p. 265.
Brent K. Stewart, PhD, DABMP
17
Convolution: Ch. 11 – Digital
Radiography and Ch. 13 - CT
Defined mathematically as
passing a NN-dimensional
convolution kernel over an NNdimensional numeric array (e.g.,
2D image or CT transmission
profile)
At each location (x, y, z, t, ...) in
the number array multiply the
convolution kernel values by the
associated values in the numeric
array and sum
Place the sum into a new numeric
array at the same location
c.f. Bushberg, et al. The Essential Physics of Medical
Imaging, 2nd ed., p. 312.
18
Brent K. Stewart, PhD, DABMP
10K 1K 100 10
Physical Mechanisms of Blurring
¬
¬
¬
¬
¬
¬
Defocusing (lens)
Optical diffusion (intensifying
screen)
Motion (involuntary, cardiac)
Slice thickness (angled
features) in tomography
Focal spot blurring and
magnification (Chapter 6)
Other spread functions
¬
¬
¬
¬
¬
¬
¬
Line spread function (LSF)
Edge spread function (ESF)
LSF = d(ESF)/dx
PSF = d(LSF)/dy
¬
c.f. Bushberg, et al. The Essential Physics of Medical
Imaging, 2nd ed., pp. 266 and 268.19
Brent K. Stewart, PhD, DABMP
Brent K. Stewart, PhD, DABMP
Spatial Frequency Domain
Temporal frequencies (middle
A: ν = 440 Hz) that comprise a
timetime-domain audio signal (t)
Similarly the objects in an
image (audio signal) can be
thought of as the superposition
of spatial frequencies
For objects in an image that
are separated by shorter
distances (mm, x), these
objects correspond to high
spatial frequencies
(cycles/mm, f)
Square wave
line pairs per
mm (lp/mm)
c.f. Bushberg, et al. The Essential Physics of Medical
Imaging, 2nd ed., p. 269.
20
Brent K. Stewart, PhD, DABMP
5
Image Quality – Bushberg Chapter 10
Diagnostic Radiology Imaging Physics Course
16 December 2004
Modulation Transfer
Function: MTF(f)
¬
¬
¬
¬
¬
Modulation Transfer Function: MTF(f)
Input constant amplitude sine
waves of various frequencies
(f) into an imaging system:
what is the amplitude of the
output wave?
MTF(f)
As f the MTF(f)
Modulation is essentially the
output contrast normalized by
the input contrast
Modulation vs. spatial freq. plot
Complete description of the
resolution properties
¬
Imaging chains:
¬
Image Intensifier Example
¬
¬
¬
¬
¬
¬
c.f. Bushberg, et al. The Essential Physics of Medical
Imaging, 2nd ed., pp. 270270-271.
Brent K. Stewart, PhD, DABMP
¬
¬
¬
¬
Compute the MTF(f) from the
LSF(x) using the Fourier
Transform (FT)
MTF(f) = |FT{LSF(x)}|
FT an integral calculus
operation that converts a
spatial domain (x) signal into a
spatial frequency (f) function
As LSF width MTF 0 faster
Method used in daily practice:
line pair phantom and star
phantom for quick
determination of lp/mm
Huda 2nd Edition – Chapter 5 – Image Quality
Brent K. Stewart, PhD, DABMP
¬
9. Screen-film resolution can best be improved by
changing to:
¬
A. Lower tube voltage
B. Slower film
C. Higher grid ratio
D. Thinner screens
E. Green sensitive film
¬
¬
¬
c.f. Bushberg, et al. The Essential Physics of Medical
Imaging, 2nd ed., pp. 272272-273.
23
Weakest link – item in imaging
chain with worst MTF often
determines the overall system,
“dragging”
dragging” the system down
Brent K. Stewart, PhD, DABMP
¬
Brent K. Stewart, PhD, DABMP
A: Optics MTF(f)
B: Image intensifier MTF(f)
C: Video camera MTF(f)
System (f) = Optics MTF(f) *
Image intensifier MTF (f) *
Video camera MTF(f)
c.f. Bushberg, et al. The Essential Physics of Medical
Imaging, 2nd ed., p. 272.
22
21
The LSF, MTF and Fourier Transform
¬
MTFtotal(f) = ∏ MTFi(f)
Brent K. Stewart, PhD, DABMP
24
6
Image Quality – Bushberg Chapter 10
Diagnostic Radiology Imaging Physics Course
16 December 2004
Huda 2nd Edition – Chapter 5 – Image Quality
Raphex 2003 Diagnostic Question
¬
D9.
D9. The modulation transfer function (MTF) is a tool for
describing the ______ of an imaging system.
¬
A. Properties of the characteristic (H&D) curve
B. Sharpness
C. Noise content
D. Latitude
¬
¬
¬
Brent K. Stewart, PhD, DABMP
¬
8. Spatial resolution cannot be assessed using:
¬
A. Line pair phantom
B. LSF image
C. Full-width half maximum
D. MTF curve
E. Pixel standard deviation
¬
¬
¬
¬
25
Brent K. Stewart, PhD, DABMP
Davis Notes - Image Quality
¬
8. Referring to Figure 1 (right),
which demonstrates three
different line spread functions
(LSF), which LSF will yield
the best spatial resolution?
¬
A. LSF A
B. LSF B
C. LSF C
¬
¬
Davis Notes - Image Quality
¬
10. Referring to Figure 1
which shows LSFs, and
Figure 2 which shows the
corresponding modulation
transfer functions (MTFs),
which MTF corresponds to
LSF C?
¬
A. MTF number 1
B. MTF number 2
C. MTF number 3
¬
¬
Brent K. Stewart, PhD, DABMP
Brent K. Stewart, PhD, DABMP
26
27
Brent K. Stewart, PhD, DABMP
28
7
Image Quality – Bushberg Chapter 10
Diagnostic Radiology Imaging Physics Course
16 December 2004
Davis Notes - Image Quality
¬
¬
¬
¬
¬
¬
Noise
11. Referring to Figure 2
illustrating MTFs, the axes
should be labeled ____________
for the y-axis and ____________
for the x-axis:
¬
Noise injects a random or
stochastic component into an
image – many sources
Definitions, first:
¬
Mean:
¬
Standard Deviation – measure
of variability, either naturally
occurring or random
fluctuation:
N
¬
A. Relative amplitude, distance
(mm)
B. Spatial frequency (lp/mm),
distance (mm)
C. Lateral dimension (mm),
Fresnel ratio
D. Relative amplitude, spatial
frequency (lp/mm)
E. Relative amplitude, relative
amplitude
σ =
Brent K. Stewart, PhD, DABMP
Gaussian (normal) distribution:
G( x ) = ke
¬
¬
¬
1⎛ x − x ⎞
− ⎜
2 ⎝ σ ⎟⎠
∑(x − x )
i =1
2
i
N −1
c.f. Bushberg, et al. The Essential Physics of Medical
Imaging, 2nd ed., p. 273.
30
Brent K. Stewart, PhD, DABMP
Poisson Probability Distribution Function
¬
Poisson distribution:
2
Poisson Distribution
m x −m
P( x ) =
e
x!
x and describe the shape
¬
Many commonly encountered
measurements of people and
things make for this kind of
distribution (Gaussian) hence
the term “normal”
e.g., the height of 1000 third
grade school children
approximates a Gaussian
¬
¬
¬
¬
c.f. Bushberg, et al. The Essential Physics of Medical
Imaging, 2nd ed., p. 275.
31
0.4
0.35
m = mean, shape governed by
one variable
P(x) difficult to calculate for
large values of x due to x!
X-ray and γ-ray counting
statistics obey P(x)
Used to describe
¬
Brent K. Stewart, PhD, DABMP
Brent K. Stewart, PhD, DABMP
1 N
∑ xi
N i =1
29
Gaussian Probability Distribution Function
¬
x=
0.3
m=1
m=2
0.25
m=4
m=6
0.2
m=8
0.15
m=10
m=20
0.1
0.05
0
0
10
20
30
40
Radioactive decay
Quantum mottle
Brent K. Stewart, PhD, DABMP
32
8
Image Quality – Bushberg Chapter 10
Diagnostic Radiology Imaging Physics Course
16 December 2004
Probability Distribution Functions
¬
Probability of observing an
observation in a range:
integrate area (for G):
¬
¬
¬
¬
¬
¬
Quantum Noise
¬
¬
¬
1 = 68.25%
1.96 = 95%
2.58 = 99%
¬
¬
Error bars and confidence
intervals
P(x) very similar to G(x) when
≈ √x
use G(x) as approx.
Can adjust the noise ( ) in an
image by adjusting the mean
number of photons used to
produce the image
c.f. Bushberg, et al. The Essential Physics of Medical
Imaging, 2nd ed., pp. 276 - 277. 33
¬
¬
¬
¬
¬
N = mean photons/unit area
2
= √N, from P(x)
(variance) = N
P(x)
Relative noise = coefficient of variation = /N = 1/√
1/√N ( with N)
SNR = signal/noise = N/ = N/√
N/√N = √N ( with N)
TradeDose 4x
Trade-off between SNR and radiation dose: SNR 2x
c.f. Bushberg, et al. The Essential Physics of Medical
Imaging, 2nd ed., p. 278.
34
Brent K. Stewart, PhD, DABMP
Brent K. Stewart, PhD, DABMP
Contrast Resolution
Noise Frequency
Ability to detect a lowlowcontrast object
Related to how much
noise there is in the image
SNR
As SNR the CR
Rose criterion: SNR > 5 to
reliably identify an object
Quantum noise and
structure noise both affect
the conspicuity of a target
¬
¬
¬
¬
¬
c.f. Bushberg, et al. The Essential Physics of Medical
Imaging, 2nd ed., p. 281.
35
Brent K. Stewart, PhD, DABMP
Brent K. Stewart, PhD, DABMP
Although noise appears
random, the noise has a
frequency distribution
Example: ocean waves
Take a flatflat-field xx-ray image
(still has noise variations)
Fourier Transform (FT) the flat
image
Noise Power
Spectrum: NPS(f)
NPS(f) is the noise variance
( 2) of the image expressed as
a function of spatial freq. (f)
c.f. Bushberg, et al. The Essential Physics of Medical
Imaging, 2nd ed., p. 282.
36
Brent K. Stewart, PhD, DABMP
9
Image Quality – Bushberg Chapter 10
Diagnostic Radiology Imaging Physics Course
16 December 2004
Huda 2nd Edition – Chapter 5 – Image Quality
Detective Quantum Efficiency (DQE)
¬
¬
¬
DQE: metric describing
overall system SNR
performance and dose
efficiency
2
SNRout
DQE = SNRin2
SNR2in = N (
¬
15. Which of the following is not true for Poisson
distributions?
¬
A. They are used to describe radioactive decay
B. They are used to describe quantum mottle
C. The variance is equal to the mean
D. They are always symmetrical
E. They are approximate to a Gaussian for means
greater than 10
¬
¬
SNR = √N)
¬
[MTF (f )]
2
¬
SNR2out =
¬
NPS(f )
k [MTF (f )]
DQE(f) =
N ⋅ NPS(f )
2
¬
DQE(f=0) = QDE
c.f. Bushberg, et al. The Essential Physics of Medical
Imaging, 2nd ed., p. 282.
37
Brent K. Stewart, PhD, DABMP
Brent K. Stewart, PhD, DABMP
Raphex 2000 Diagnostic Question
Huda 2nd Edition – Chapter 5 – Image Quality
¬
D9. The degree of mottle in a screenscreen-film xx-ray image is:
¬
A. Usually determined by the number of primary xx-ray
photons absorbed in the film.
B. Independent of the mAs.
C. An inherent property of the AgBr structure in the film
emulsion.
D. Increased by increasing the film speed.
E. Measured in line pairs per millimeter (lp/mm).
¬
¬
¬
¬
Brent K. Stewart, PhD, DABMP
Brent K. Stewart, PhD, DABMP
¬
17. The speed of screen/film can be increased without
increasing noise by:
¬
A. Using a faster film
B. Using phosphor with a higher conversion efficiency
C. Increasing the processor developer temperature
D. Increasing the phosphor absorption efficiency
E. Decreasing screen thickness
¬
¬
¬
¬
39
Brent K. Stewart, PhD, DABMP
38
40
10
Image Quality – Bushberg Chapter 10
Diagnostic Radiology Imaging Physics Course
16 December 2004
Huda 2nd Edition – Chapter 5 – Image Quality
Davis Notes - Image Quality
¬
6. A student technologist has a cadaver on the table and
is practicing manual technique factors for a digital
photospot system that is not phototimed. Circle each of
the following techniques that will result in higher
quantum mottle in the image:
¬
19. Image contrast-to-noise ratio could not be increased
by using:
¬
A. Lower tube voltages
B. Higher-ratio grids
C. Larger x-ray beam areas
D. Screens with lower conversion efficiency
E. Slower films
¬
¬
¬
¬
¬
¬
A. Higher kVp, higher mAs
B. Lower mAs, same kVp
C. Higher mAs, same kVp
D. Higher kVp, same mAs
E. Lower kVp, lower mAs
Brent K. Stewart, PhD, DABMP
¬
¬
¬
41
Brent K. Stewart, PhD, DABMP
Raphex 2000 Diagnostic Question
¬
Sampling and Aliasing in Digital Images
D8 Low contrast detectability refers to the ability of a
system to distinguish:
¬
Array of detector elements
¬
¬
¬
¬
¬
¬
¬
¬
A. A calcified lung nodule.
B. A nonnon-calcified lung nodule.
C. Between overlying and underlying tissues.
D. The size of a small fracture.
E. Vessels during the arterial phase of a normal
angiogram.
¬
¬
¬
¬
Brent K. Stewart, PhD, DABMP
Brent K. Stewart, PhD, DABMP
42
43
Sampling (pixel) pitch
Detector aperture width
The spacing between samples
determines the highest
frequency that can be imaged
Nyquist frequency: FN = 1/2∆
1/2∆
If a frequency component in an
sampled <
image > FN
2x/cycle: aliasing
Wraps back into the image as
a lower frequency
Moiré
Moiré pattern, spoke wheels
c.f. Bushberg, et al. The Essential Physics of Medical
Imaging, 2nd ed., p. 284.
44
Brent K. Stewart, PhD, DABMP
11
Image Quality – Bushberg Chapter 10
Diagnostic Radiology Imaging Physics Course
16 December 2004
Aliasing due to Reciprocating Grid Failure
Sampling and Aliasing in Digital Images
Example: sampling pitch of
100 µm
FN = 5 cycles/mm
When input f > FN then the
spatial frequency domain signal
at f is aliased down to:
fa = 2F
2FN – f
Not noticeable with patient
Antiscatter grids
Aperture blurring - signal
averaging across the detector
aperture
sin(aπ f)
MTF(f)=FT{rect(a)}=sinc(af)=
aπ f
¬
¬
¬
¬
¬
¬
Brent K. Stewart, PhD, DABMP
ContrastContrast-Detail (C(C-D) Curves
¬
¬
¬
¬
¬
¬
¬
¬
¬
Brent K. Stewart, PhD, DABMP
Receiver Operating Characteristic (ROC) Curves
¬
Spatial resolution: MTF(f)
Contrast resolution: SNR
Combined quantitative: DQE(f)
Qualitative: CC-D curve
C-D phantom: holes in plastic
of depth and diameter
What depth hole at which
diameter can just be visualized
Connect the dots
C-D line
Better spatial resolution: highhighcontrast, small detail
Better contrast resolution: lowlowcontrast
¬
¬
¬
¬
¬
¬
¬
¬
c.f. Bushberg, et al. The Essential Physics of Medical
Imaging, 2nd ed., p. 287.
47
Brent K. Stewart, PhD, DABMP
Brent K. Stewart, PhD, DABMP
c.f. Bushberg, et al. The Essential Physics of Medical
Imaging, 2nd ed., pp. 285285-286.
46
45
Diagnostic task: separate
abnormal from normal
Usually significant overlap in
histograms
Decision criterion or threshold
Based on threshold: either
normal (L) or abnormal (R)
N cases: 2 x 2 decision matrix
TPF= TP/(TP+FN)= Sensitivity
FPF = FP/(FP+TN)
Specificity = (1(1-FPF) = TNF
ROC curve: sensitivity vs.
1-specificity usu. @ five
threshold levels
c.f. Bushberg, et al. The Essential Physics of Medical
Imaging, 2nd ed., pp. 288288-289.
48
Brent K. Stewart, PhD, DABMP
12
Image Quality – Bushberg Chapter 10
Diagnostic Radiology Imaging Physics Course
16 December 2004
ROC Questionnaire: 5 Point Confidence Scale
Receiver Operating Characteristic Curves
¬
¬
¬
¬
¬
Brent K. Stewart, PhD, DABMP
The ROC curve is essentially a
way of analyzing the SNR
associated with a specific
diagnostic task
Az: area under the curve –
concise description of the
diagnostic performance of the
systems (including observers)
being tested
Measure of detectability
Az = 0.5 guessing
Az = 1.0 perfect
c.f. Bushberg, et al. The Essential Physics of Medical
Imaging, 2nd ed., p. 291.
50
49
Brent K. Stewart, PhD, DABMP
Huda 2nd Edition – Chapter 5 – Image Quality
Huda 2nd Edition – Chapter 5 – Image Quality
¬
21. Sensitivity is given by:
¬
22. Specificity is given by:
¬
A. False positive fraction (FPF)
B. True positive fraction (TPF)
C. False negative fraction (FNF)
D. True negative fraction (TNF)
E. Area under ROC curve (Az)
¬
A. The true-negative fraction (TNF)
B. The true-positive fraction (TPF)
C. (1 – TPF)
D. (1 + TNF)
E. Area under the ROC curve (Az)
¬
¬
¬
¬
Brent K. Stewart, PhD, DABMP
Brent K. Stewart, PhD, DABMP
¬
¬
¬
¬
51
Brent K. Stewart, PhD, DABMP
52
13
Image Quality – Bushberg Chapter 10
Diagnostic Radiology Imaging Physics Course
16 December 2004
Huda 2nd Edition – Chapter 5 – Image Quality
Davis Notes - Image Quality
¬
23. A ROC curve is used to measure diagnostic imaging:
¬
A. Performance
B. Accuracy
C. Specificity
D. Sensitivity
E. Cost benefit ratio
¬
¬
¬
¬
¬
26. In Figure 5, showing an
ROC curve, the X-axis should
be labeled (circle all that are
correct):
¬
A. True Positive Fraction
B. False Positive Fraction
C. Sensitivity
D. Specificity
E. 1 – Specificity
¬
¬
¬
¬
Brent K. Stewart, PhD, DABMP
53
Brent K. Stewart, PhD, DABMP
Davis Notes - Image Quality
¬
¬
¬
¬
¬
¬
Davis Notes - Image Quality
27. In Figure 5 showing the
ROC curves, the Y-axis
should be labeled (circle all
that are correct):
¬
¬
A. True Positive Fraction
B. False Positive Fraction
C. Sensitivity
D. Specificity
E. 1 – Specificity
Brent K. Stewart, PhD, DABMP
Brent K. Stewart, PhD, DABMP
54
¬
55
C
28. Curve letter ___________
represents pure guessing.
29. Curve letter ___________
A
represents the best diagnostic
approach.
D
30. Curve letter ___________
represents an Az value of
about 0.3.
Brent K. Stewart, PhD, DABMP
56
14
Image Quality – Bushberg Chapter 10
Diagnostic Radiology Imaging Physics Course
16 December 2004
Huda 2nd Edition – Chapter 5 – Image Quality
End of Lecture, Additional Questions Follow
¬
16. Quantum mottle is determined primarily by which of
the following factors?
¬
A. X-ray beam filtration
B. X-ray photons absorbed in screen
C. X-ray photon energy
D. Screen conversion efficiency
E. Screen thickness
¬
¬
¬
¬
Brent K. Stewart, PhD, DABMP
57
Brent K. Stewart, PhD, DABMP
Huda 2nd Edition – Chapter 5 – Image Quality
Raphex 2003 Diagnostic Question
¬
D5. Which of the following will increase the image
contrast that is due to the screenscreen-film image receptor?
¬
A. Decreasing the grid ratio
B. Decreasing the kVp
C. Increasing the developer temperature
D. Increasing the focal spot size
E. Increasing xx-ray beam filtration
¬
¬
¬
¬
Brent K. Stewart, PhD, DABMP
Brent K. Stewart, PhD, DABMP
58
¬
7. Gastrointestinal tract contrast could be improved by all
of the following except:
¬
A. Infusion of barium
B. Reduced tube voltage
C. Increased tube current
D. Increased grid ratio
E. Reduced field size
¬
¬
¬
¬
59
Brent K. Stewart, PhD, DABMP
60
15
Image Quality – Bushberg Chapter 10
Diagnostic Radiology Imaging Physics Course
16 December 2004
Davis Notes - Image Quality
Davis Notes - Image Quality
¬
12. In a 9” (23 cm) image intensifier with a 0.9” (2.3 cm)
output phosphor, a resolution cell measured at the input
plane is 0.5 mm. At the output phosphor, the resolution
cell dimension is now ________________.
¬
A. 0.50 mm
B. No change
C. 5 mm
D. 50 mm
E. 50 µm
¬
¬
¬
¬
¬
9. Referring to Figure 1 showing
three line spread functions, the
best choices for the axes labels
are ________ for the y-axis and
_________ for the x-axis:
¬
A. Frequency, amplitude
B. Blur distance (mm), frequency
C. Relative amplitude, frequency
D. Relative amplitude, distance
(mm)
E. Distance (mm), relative
amplitude
¬
¬
¬
¬
Brent K. Stewart, PhD, DABMP
61
Brent K. Stewart, PhD, DABMP
Huda 2nd Edition – Chapter 5 – Image Quality
¬
18. The major contributor to noise in a fluoroscopic
image is variations in the:
¬
A. Input phosphor thickness
B. Accelerating tube voltage
C. Output phosphor thickness
D. Display screen brightness
E. Quantum mottle
¬
¬
¬
¬
Davis Notes - Image Quality
¬
13. For a non-phototimed system, a technologist gets a properly
exposed film but it lacks good bone contrast. They decide to
increase the mAs by a factor of 2, allowing them to reduce the kVp.
If they was originally at around 100 kVp, what kVp should the
technologist choose to get a properly exposed film of the same
patient?
¬
A. 115 kVp
B. 85 kVp
C. 70 kVp
D. 50 kVp
E. Need technique charts to determine
¬
¬
¬
¬
Brent K. Stewart, PhD, DABMP
Brent K. Stewart, PhD, DABMP
62
63
Brent K. Stewart, PhD, DABMP
64
16
Image Quality – Bushberg Chapter 10
Diagnostic Radiology Imaging Physics Course
16 December 2004
Huda 2nd Edition – Chapter 5 – Image Quality
Davis Notes - Image Quality
¬
5. Assume that a properly calibrated phototimed
(automatic exposure control) system is used to produce
a clinical radiograph. Increased quantum mottle will
occur with:
¬
11. Poor screen/film contact will primarily result in a
significant loss of:
¬
A. Contrast
B. Magnification
C. Image detail
D. X-ray absorption efficiency
E. Conversion efficiency
¬
¬
¬
¬
¬
A. A thinner screen
B. A screen-film using a reflective layer in the screens
C. A thinner patient
D. Faster film, same screen
Brent K. Stewart, PhD, DABMP
¬
¬
¬
65
Brent K. Stewart, PhD, DABMP
Huda 2nd Edition – Chapter 5 – Image Quality
Huda 2nd Edition – Chapter 5 – Image Quality
¬
25. In screen/film radiography, raising the kilovolt peak
will increase all of the following except:
¬
13. Which of the following factors would have the least
effect on image sharpness?
¬
A. Half-value layer
B. Scatter
C. Patient transmission (%)
D. Subject contrast
E. Grid penetration
¬
A. Film type
B. Focal spot size
C. Motion
D. Screen thickness
E. Screen/film contact
¬
¬
¬
¬
Brent K. Stewart, PhD, DABMP
Brent K. Stewart, PhD, DABMP
66
¬
¬
¬
¬
67
Brent K. Stewart, PhD, DABMP
68
17
Image Quality – Bushberg Chapter 10
Diagnostic Radiology Imaging Physics Course
16 December 2004
Huda 2nd Edition – Chapter 5 – Image Quality
¬
Davis Notes - Image Quality
¬
10. Compared with a regular screen, a detail screen of
the same phosphor will have a lower:
¬
¬
¬
¬
¬
¬
A. Spatial resolution
B. Speed
C. Noise level
D. Conversion efficiency
E. Linear attenuation coefficient
Brent K. Stewart, PhD, DABMP
¬
¬
¬
69
Brent K. Stewart, PhD, DABMP
Davis Notes - Image Quality
¬
¬
¬
¬
¬
¬
¬
D8 Geometric magnification can improve the detection of
high contrast objects. The fundamental limitation on
useful magnification is:
¬
A. Blurring due to focal spot size..
B. Blurring due to removal of the grid..
C. H&D curve of the image receptor..
D. MTF of the image receptor..
E. Size of the image receptor..
¬
A. Higher kVp, higher mAs
B. Lower mAs, same kVp
C. Higher mAs, same kVp
D. Higher kVp, same mAs
E. Lower kVp, lower mAs
Brent K. Stewart, PhD, DABMP
70
Raphex 2001 Diagnostic Question
7. A student technologist has a cadaver on the table
and is practicing manual technique factors for a digital
photospot system that is not phototimed. Which
techniques would result in a higher absorbed dose to
the cadaver? :
Brent K. Stewart, PhD, DABMP
15. MTF number __________
3
demonstrates the best spatial
resolution.
1
16. MTF number __________
is
probably for an image intensifier
(9”
(9” II in 9”
9” mode).
17. MTF number __________
is
3
probably for a general screenscreenfilm system.
2 has
18. MTF number _________
a maximum resolving power of
about 100 mm.
1 has
19. MTF number _________
a cutcut-off resolution of about 3
lp/mm.
¬
¬
¬
71
Brent K. Stewart, PhD, DABMP
72
18
Image Quality – Bushberg Chapter 10
Diagnostic Radiology Imaging Physics Course
16 December 2004
Huda 2nd Edition – Chapter 5 – Image Quality
Raphex 2002 Diagnostic Question
¬
D12 A newly installed bucky radiographic system
produces abdominal images that are of acceptable
density over the spine and progressively lighter toward
both lateral edges of the film. The most likely reason for
this finding is improper:
¬
14. The MTF is not:
¬
A. A description of any imaging system resolution
performance
B. The ratio of image to subject contrast at each spatial
frequency
C. Equal to the unity when the spatial resolution is
perfect
D. Usually lower at high spatial frequencies
E. Fifty percent at half the limiting spatial resolution
¬
¬
¬
¬
¬
¬
A. Collimator tracking.
B. Focal distance for grid.
C. Grid ratio.
D. kVp calibration of the system.
E. Programming of the AEC system.
Brent K. Stewart, PhD, DABMP
¬
¬
¬
73
Brent K. Stewart, PhD, DABMP
74
Raphex 2002 Diagnostic Question
¬
D13 The impression of noise in an x-ray image is:
¬
A. Increased by increasing the film speed in a screenfilm cassette.
B. Decreased by increasing the film speed in a screenfilm cassette.
C. Increased by decreasing the focal-spot size.
D. Decreased by decreasing the focal-spot size.
E. Mainly determined by imperfections in the-image
receptor.
¬
¬
¬
¬
Brent K. Stewart, PhD, DABMP
Brent K. Stewart, PhD, DABMP
75
19