Nguyên lý tạo ảnh trong MRI (NMR dx rad imaging physics course) phần 2
Bạn đang xem bản rút gọn của tài liệu. Xem và tải ngay bản đầy đủ của tài liệu tại đây (1.2 MB, 18 trang )
Nuclear Magnetic Resonance – Bushberg Chapter 14
Diagnostic Radiology Imaging Physics Course
Take Aways:
Aways: Five Things You should be able
to Explain after the NMR Lectures
¬
Nuclear Magnetic Resonance – Chapter 14
¬
¬
Brent K. Stewart, PhD, DABMP
Professor, Radiology and Medical Education
Director, Diagnostic Physics
¬
¬
a copy of this lecture may be found at:
/> />05.html
© UW and Brent K. Stewart, PhD, DABMP
1
The magnetic characteristics of the nucleus and the
magnetic properties of matter
How the NMR signal is generated and detected
T1 and T2 relaxation: how they arise and how they are
measured
Pulse sequence methods used and pulse sequence
timing (e.g., TR and TE) and inherent NMR parameters
(e.g., T1 and T2) give rise to tissue contrast
How a 1D gradient can be used to provide an echo and
allow for quick imaging with shallow flip angle sequences
© UW and Brent K. Stewart, PhD, DABMP
2
2003 Nobel Prize
for Medicine - MRI
Soft Tissue Transparency and First NMR Image
¬
¬
¬
¬
Laterbur and Mansfield
(2003, medicine):
discoveries concerning
magnetic resonance
imaging (MRI)
Rabi (1944, physics):
nuclear magnetic
resonance (NMR)
methodology
Bloch and Purcell (1952,
physics): NMR precision
measurements
Ernst (1991, chemistry):
highhigh-resolution NMR
spectroscopy
c.f. Mokovski, A. Medical Imaging Systems, p. 3.
© UW and Brent K. Stewart, PhD, DABMP
9, 19 and 26 May 2005
3
© UW and Brent K. Stewart, PhD, DABMP
4
1
Nuclear Magnetic Resonance – Bushberg Chapter 14
Diagnostic Radiology Imaging Physics Course
NMR T1 for Tumor
and Normal Tissue
Nuclear Magnetic Resonance
¬
¬
¬
¬
¬
¬
¬
NMR the study of the magnetic properties of the nucleus
Magnetic field associated with nuclear spin/chg. distr.
Not an imaging technique – provides spectroscopic data
Magnetic Resonance Imaging – magnetic gradients and
mathematical reconstruction algorithms produce the NNdimensional image from NMR freefree-induction decay data
High contrast sensitivity to soft tissue differences
Does not use ionizing radiation (radio waves)
Important to understand the underlying principles of
NMR in order to transfer this knowledge to MRI
© UW and Brent K. Stewart, PhD, DABMP
5
Image Contrast – What does it depend on?
¬
¬
¬
¬
¬
¬
c.f. Mansfield, et al. NMR Imaging in
Biomedicine, 1982, p. 22.
¬
¬
¬
Exception: permanent magnet
Magnetic susceptibility – extent to which a material
becomes magnetized when placed in a magnetic field
Three categories of magnetic susceptibility
¬
Diamagnetic – opposing applied field
¬
Paramagnetic – enhancing field, no selfself-magnetism
¬
Ferromagnetic – ‘superparamagnetic’, greatly enhancing field
¬
¬
¬
© UW and Brent K. Stewart, PhD, DABMP
9, 19 and 26 May 2005
6
Mag. field generated by moving charges (e- or quarks)
Most materials do not exhibit overt magnetic properties
¬
¬
intrinsic: ρH,T1, T2, flow, perfusion, diffusion, ...
extrinsic: TR, TE, TI, flip angle, ...
c.f. Bushberg, et al. The Essential Physics
of Medical Imaging, 2nd ed., p. 257.
© UW and Brent K. Stewart, PhD, DABMP
Magnetism and the Magnetic Properties of Matter
Radiation needs to interact with the body’s tissues in
some differential manner to provide contrast
X-ray/CT: differences in e- density (e-/cm3 = ρ · e-/g)
Ultrasound: differences in acoustic impedance (Z = ρ·c)
Nuclear Medicine: differences in tracer concentration (ρ
(ρ)
MRI: many intrinsic and extrinsic factors affect contrast
¬
c.f. /> />
7
Ca, H2O, most organic materials (C and H)
O2, deoxyhemoglobin and GdGd-based contrast agents
Exhibits selfself-magnetism: Fe, Co and Ni
© UW and Brent K. Stewart, PhD, DABMP
8
2
Nuclear Magnetic Resonance – Bushberg Chapter 14
Diagnostic Radiology Imaging Physics Course
Magnetism and the Magnetic Properties of Matter
¬
Magnetic fields arise from magnetic dipoles (N/S)
¬
¬
¬
N – side the origin of magnetic field lines (arbitrary)
Attraction (N(N-S) and repulsion (N(N-N & SS-S)
Magnetic field strength (flux density): B
¬
¬
¬
Magnetism and the Magnetic Properties of Matter
Measured in tesla (T) and gauss (G): 1 T = 10,000 G
Earth magnetic field ~ 1/20,000 T or 0.5 G
Magnetic fields arise from
¬
¬
Permanent magnets
Current through a wire or solenoid (current amplitude sets B
magnitude)
© UW and Brent K. Stewart, PhD, DABMP
9
Magnetic Characteristics of the Nucleus
¬
¬
¬
¬
¬
c.f. Bushberg, et al. The Essential Physics of
Medical Imaging, 2nd ed., p. 374 and 377.
© UW and Brent K. Stewart, PhD, DABMP
10
Nuclear Magnetic Characteristics of the Elements
Magnetic properties of nuclei determined by the spin and charge
distribution (quarks) of the nucleons (p+ and n)
Magnetic moment (µ
(µ) describes the nuclear B field magnitude
Pairing of p+-p+ or nn-n causes µ to cancel out
So if P (total p+) and N (total n) is even
no/little µ
If N even and P odd or P even and N odd
resultant µ (NMR eff.)
eff.)
¬
¬
¬
¬
¬
¬
c.f. Bushberg, et al. The Essential Physics
of Medical Imaging, 2nd ed., p. 375.
© UW and Brent K. Stewart, PhD, DABMP
9, 19 and 26 May 2005
11
Biologically relevant elements that are candidates for NMR/MRI
Magnitude of µ
Physiologic concentration
Isotopic abundance
Relative sensitivity
1H (p+) provide 104-106 times the signal from 23Na or 31P
c.f. Bushberg, et al. The Essential Physics of Medical
Imaging, 2nd ed., p. 376.
© UW and Brent K. Stewart, PhD, DABMP
12
3
Nuclear Magnetic Resonance – Bushberg Chapter 14
Diagnostic Radiology Imaging Physics Course
Nuclear Magnetic Characteristics of the Elements
¬
¬
¬
¬
¬
¬
Spinning p+ considered ‘classically’ as a bar magnet
Thermal energy randomizes direction of µ
no net magnetization
Application of an external magnetic field (B0)
two energy states
Lower energy µ parallel w/ B0 and higher energy µ antianti-parallel w/ B0
Number of excess µ @ 1.0T and 310 K
3 ppm (very small effect)
For typical voxel in MRI: 1021 p+
3x10¹⁵ more µ in lower state
Larmor Frequency
¬
¬
¬
¬
¬
¬
‘Classically’ a torque on µ by B0 causes precession
Precession occurs at an angular frequency (rotations/sec or radians/sec)*
radians/sec)*
Larmor equation: ω0(radians/sec)= γ·B0 ; f0(rotations/sec or Hz)= (
)·B0
= gyromagnetic ratio (MHz/T) unique to each element
Choice of freq.
the resonance phen. to be ‘tuned’ to a specific element
For 1H @ 1.5T = 64 MHz (Channel 3)
* Note: 360° = 2π
radians,
1 radian = 57.3°
c.f. Bushberg, et al. The Essential Physics
of Medical Imaging, 2nd ed., p. 377.
© UW and Brent K. Stewart, PhD, DABMP
c.f. />/lectures/
/lectures/gpl_page.html
13
Larmor Frequency & US VHF Broadcast Spectrum
c.f. Hendee, et al. Medical Imaging Physics,
4th ed., p. 357.
¬
¬
¬
3.0 T = 128 MHz
¬
c.f. Bushberg, et al. The Essential Physics
of Medical Imaging, 2nd ed., p.18.
© UW and Brent K. Stewart, PhD, DABMP
9, 19 and 26 May 2005
c.f. />telex/telex3.html
15
c.f. Bushberg, et al. The Essential Physics of
Medical Imaging, 2nd ed., p. 379.
14
Nuclear Magnetic Characteristics of the Elements
¬
1.5 T = 64 MHz
© UW and Brent K. Stewart, PhD, DABMP
At equilibrium, no B field ⊥ B0
(all along zz-axis)
Random distribution of µ in xx-y
plane averages out: Bxy = 0
Small µz add up to measurable
M0 (equilibrium magnetization)
Absorbed radiofrequency EM
radiation
lowlow-E to highhigh-E
HighHigh-E nuclei lose energy to
environment: return to
equilibrium state and Mz
(longitudinal magnetization)
M0
c.f. Bushberg, et al. The Essential Physics
of Medical Imaging, 2nd ed., p. 378.
© UW and Brent K. Stewart, PhD, DABMP
c.f. />/lectures/gpl_page.html
/lectures/gpl_page.html
16
4
Nuclear Magnetic Resonance – Bushberg Chapter 14
Diagnostic Radiology Imaging Physics Course
Raphex 2000 Diagnostic Questions
¬
¬
¬
¬
¬
¬
Raphex 2003 Diagnostic Questions
D42.
D42. Which of the following elements would not be of
interest in an MRI image?
Element
Z
A
A. Hydrogen
1
1
B. Carbon
6
13
C. Oxygen
8
16
D. Sodium
11
23
E. Phosphorus
15
31
© UW and Brent K. Stewart, PhD, DABMP
¬
D53.
D53. For hydrogen imaging in a 1.0 T MRI unit, the
frequency of the RF signal is about:
¬
A. 400 kHz
B. 4 MHz
C. 40 MHz
D. 400 MHz
E. 4 GHz
¬
¬
¬
¬
17
© UW and Brent K. Stewart, PhD, DABMP
Geometric Orientation
¬
¬
¬
¬
Resonance and Excitation
Two frames of reference used
¬
Laboratory frame – stationary
reference from observer’s
POV
Rotating frame – angular
frequency equal to the Larmor
precessional frequency
¬
¬
¬
Rotating Frame
Both frames are useful in
explaining various interactions
Mxy: transverse magnetization,
¬
¬
¬
⊥ B0 (at equilibrium = 0)
¬
Return to equilibrium results in RF emission from µ with
¬
Lab Frame
18
When RF applied, Mz tipped
into the xx-y (transverse) plane
¬
Amplitude proportional the number of excited nuclei (spin ρ)
Rate depends on the characteristics of the sample (T1 and T2)
Excitation, detection & analysis the basics for NMR/MRI
Resonance occurs when applied RF magnetic field (B1)
is precisely matched in frequency to that of the nuclei
Absorption of RF energy promotes lowhighlow-E µ
high-E µ
Amplitude and duration of RF pulse determines the
number of nuclei that undergo the energy transition (θ
(θ)
Continued RF application induces a return to equilibrium
Rotating Frame
c.f. Bushberg, et al. The Essential Physics
of Medical Imaging, 2nd ed., pp. 380380-381.
© UW and Brent K. Stewart, PhD, DABMP
9, 19 and 26 May 2005
19
© UW and Brent K. Stewart, PhD, DABMP
20
5
Nuclear Magnetic Resonance – Bushberg Chapter 14
Diagnostic Radiology Imaging Physics Course
Resonance and Excitation
Changing Reference Frames
RF
Pulse
Angle
Tip:
¬
¬
¬
0°
¬
¬
Why is MRI so hard to learn?
Changing reference frames
Classical versus Quantum
Mechanical explanation
Lab and rotating frames
Changing scales
¬
90°
90°
¬
¬
¬
180°
180°
Higher energy state
c.f. Bushberg, et al. The Essential Physics
of Medical Imaging, 2nd ed., p. 382.
© UW and Brent K. Stewart, PhD, DABMP
Start with a voxel of 1 mm x 1 mm
x 10 mm as a starting point and
then split up later into smaller and
smaller pieces
21
© UW and Brent K. Stewart, PhD, DABMP
Resonance and Excitation
¬
¬
¬
¬
¬
22
Resonance and Excitation
B1 field component rotating at Larmor f0 (offlittle effect)
(off-freq.
Rotating reference frame: B1 stationary in xx-y plane
B1 applied torque to Mz
rotation: θ = γ · B1· t
Flip angle (θ
(θ) describes the rotation through which the longitudinal
magnetization (Mz) is displaced to generate transverse
magnetization (Mxy)
Common angles: 90°
90° (π/2 radians: π/2 pulse) and 180°
180° (π radians)
¬
¬
¬
Time required 1010-100 µsec
90°
largest Mxy
90° pulse
(signal) generated
For flip angle (θ)
(θ) < 90°
90°
¬
¬
¬
¬
Rotating Frame
Macroscopic
Intermediate (spin isochromats)
isochromats)
Microscopic/QM
smaller Mxy component
generated and less signal
less time necessary to
displace Mz
greater amount of Mxy (signal)
per excitation time
Low flip angle (θ) very
important in rapid MRI
scanning
Lab Frame
c.f. Bushberg, et al. The Essential Physics
of Medical Imaging, 2nd ed., p. 384.
© UW and Brent K. Stewart, PhD, DABMP
9, 19 and 26 May 2005
23
c.f. Bushberg, et al. The Essential Physics
of Medical Imaging, 2nd ed., p. 384.
© UW and Brent K. Stewart, PhD, DABMP
24
6
Nuclear Magnetic Resonance – Bushberg Chapter 14
Diagnostic Radiology Imaging Physics Course
Free Induction Decay: T2 and T2* Relaxation
Free Induction Decay: T2 and T2* Relaxation
¬
¬
¬
90°
90° pulse produces phase coherence of nuclei
As Mxy rotates at f0 the receiver coil (lab frame) through
magnetic induction (dB/dt) produces a damped
sinusoidal electronic signal: free induction decay (FID)
¬
¬
¬
c.f. Bushberg, et al. The Essential Physics
of Medical Imaging, 2nd ed., p. 385.
25
© UW and Brent K. Stewart, PhD, DABMP
c.f. Bushberg, et al. The Essential Physics
of Medical Imaging, 2nd ed., p. 385.
¬
¬
¬
¬
¬
¬
T2 decay mechanisms det. by the molecular structure of the sample
sample
Mobile molecules (e.g., CSF) exhibit a long T2 as rapid molecular
molecular
motion reduces intrinsic B inhomogeneities
Large, stationary structures have short T2
B0 inhomogeneities and susceptibility agents (e.g., contrast
materials) cause more rapid dephasing
T2* decay
c.f. Bushberg, et al. The Essential Physics
of Medical Imaging, 2nd ed., p. 386.
© UW and Brent K. Stewart, PhD, DABMP
9, 19 and 26 May 2005
c.f. />/lectures/gpl_page.html
/lectures/gpl_page.html
26
© UW and Brent K. Stewart, PhD, DABMP
Return to Equilibrium: T1 Relaxation
Free Induction Decay: T2 and T2* Relaxation
¬
Decay of the FID envelope due to loss of phase
coherence of the individual spins due to intrinsic micro
magnetic field variations in the sample: spinspin-spin
interaction
T2 decay constant
Mxy(t) = M0e-(t/T2): decay of Mxy after 90°
90° pulse
T2: time required for Mxy to to 37% (1/e) peak level
T2 relaxation relatively unaffected by B0
27
¬
¬
¬
Loss of Mxy phase coherence
(T2 & T2* decay) occurs
relatively quickly
Return of Mz to M0
(equilibrium) takes longer
Excited spins release energy
to local environment (‘lattice’):
spinT1
spin-lattice relaxation
decay constant
Mz(t) = M0[1[1-e-(t/T1)]: recovery of
Mz after 90°
90° pulse
T1: time required for Mz to to
63%: (1(1-e-1) M0
After t = 5 T1
Mz(t) ≅ M0
c.f. Bushberg, et al. The Essential Physics
of Medical Imaging, 2nd ed., p. 387.
© UW and Brent K. Stewart, PhD, DABMP
c.f. />/lectures/
/lectures/gpl_page.html
28
7
Nuclear Magnetic Resonance – Bushberg Chapter 14
Diagnostic Radiology Imaging Physics Course
Return to Equilibrium: T1 Relaxation
¬
¬
¬
Return to Equilibrium: T1 Relaxation
Method to determine T1: use
various ∆t between 90°
90° pulses
pulses
and estimate by curve fitting
Dissipation of absorbed energy
into the lattice (T1) varies
substantially for various tissue
structures and pathologies
(prev. Damadian table)
Energy transfer most efficient
when the precessional
frequency of the excited nuclei
overlaps with the vibrational
frequencies of the lattice
c.f. Bushberg, et al. The Essential Physics
of Medical Imaging, 2nd ed., p. 388.
© UW and Brent K. Stewart, PhD, DABMP
¬
¬
¬
¬
¬
¬
29
Comparison of T1 and T2
¬
¬
¬
¬
¬
c.f. Bushberg, et al. The Essential Physics
of Medical Imaging, 2nd ed., p. 389.
© UW and Brent K. Stewart, PhD, DABMP
9, 19 and 26 May 2005
© UW and Brent K. Stewart, PhD, DABMP
30
T1 and T2 versus B Field Strength
T1 > T2 > T2* (T2 44-10X
shorter than T1)
Small molecules: long T1 and
long T2 (e.g., water, CSF)
Intermediate molecules: short
T1 and short T2 (most tissues)
Large/bound molecules: long
T1 and short T2
The differences in T1 and T2,
as well as spin density (ρ
(ρ)
provide much to MRI contrast
and exploited for the diagnosis
of pathologic conditions
c.f. Bushberg, et al. The Essential Physics
of Medical Imaging, 2nd ed., pp. 390390-391.
Large slowslow-moving molecules
low vibrational freq. (very small
overlap with f0: longest T1)
Moderately sized molecules (e.g.,
lipids, proteins and fat) and
viscous fluids
low & intermed.
freq. (great overlap: short T1)
Small molecules
low,
intermediate and high freq. (small
overlap with f0: long T1)
T1: Soft tissue [0.1,1] and
aqueous substances [1,4]
T1 relaxation as B0
Contrast agents: spinspin-lattice sink
1.5 T = 64 MHz
3.0 T = 128 MHz
31
c.f. Mansfield, et al. NMR Imaging in
Biomedicine, 1982, p. 23
© UW and Brent K. Stewart, PhD, DABMP
32
8
Nuclear Magnetic Resonance – Bushberg Chapter 14
Diagnostic Radiology Imaging Physics Course
Raphex 2003 Diagnostic Questions
Raphex 2003 Diagnostic Questions
¬
D56.
D56. In MRI, pure water will have a ______ T1 and a
______ T2.
¬
D55.
D55. In MRI contrast is created by all of the following
except:
¬
A. long, long
B. long, short
C. short, long
D. short, short
¬
A. Administration of a contrast agent.
B. Differences in atomic number.
C. Differences in hydrogen content.
D. Differences in T1 time of tissues.
E. Differences in T2 time of tissues.
¬
¬
¬
¬
¬
¬
¬
© UW and Brent K. Stewart, PhD, DABMP
33
© UW and Brent K. Stewart, PhD, DABMP
Raphex 2002 Diagnostic Questions
¬
D52. In biological tissue, relaxation times are ordered:
¬
A. T1 < T2 < T2*
B. T1 < T2* < T2
C. T2* < T2 < T1
D. T2 < T2* < T1
E. T2 < T1 < T2*
¬
¬
¬
¬
Raphex 2000 Diagnostic Questions
¬
D46.
D46. The T2 relaxation time of a tissue is about 60 msec
on an MRI system with a 0.5 Tesla magnet. On a 1.5
Tesla MRI system, one might expect the T2 relaxation
time to:
¬
A. Decrease significantly.
B. Decrease slightly.
C. Increase significantly.
D. Increase slightly.
E. Remain the same.
¬
¬
¬
¬
© UW and Brent K. Stewart, PhD, DABMP
9, 19 and 26 May 2005
34
35
© UW and Brent K. Stewart, PhD, DABMP
36
9
Nuclear Magnetic Resonance – Bushberg Chapter 14
Diagnostic Radiology Imaging Physics Course
Pulse Sequences
¬
¬
¬
Spin Echo (SE) - Echo Time (TE)
¬
Tailoring pulse sequence
emphasizes the image contrast
dependent on ρ, T1 and T2
contrast weighted images
Timing, order, polarity, pulse
shaping, and repetition
frequency of RF pulses and
gradient (later) application
Three major pulse sequences
¬
¬
¬
¬
¬
¬
¬
Spin echo
Inversion recovery
Gradient recalled echo
c.f. />© UW and Brent K. Stewart, PhD, DABMP
37
c.f. Bushberg, et al. The Essential Physics
of Medical Imaging, 2nd ed., p. 392.
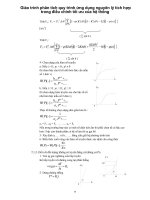
Spin Echo (SE) - Echo Time (TE)
¬
¬
¬
¬
¬
Initial 90°
maximal Mxy and phase coherence
90° pulse (t = 0)
FID exponentially decays via T2* relaxation
At t = TE/2 a 180°
induces spin rephasing
180° pulse is applied
Spin inversion: spins rotate in the opposite direction, undoing all the
T2* dephasing through ∆t = TE/2 at t = TE (∆
(∆t = 2·
2·TE/2)
An FID waveform echo (“
(“spin echo”
echo”) produced at t = TE
© UW and Brent K. Stewart, PhD, DABMP
9, 19 and 26 May 2005
38
SE - Repetition Time (TR) & Partial Saturation
Maximum echo amplitude depends on T2 and not T2*
FID envelope decay still dependent on T2*
SE formation separates RF excitation and signal acquisition events
events
FID echo envelope centered at TE sampled and digitized with ADC
Multiple echos generated by successive 180°
180° pulses allow
determination of sample T2 - exponential curve fitting: Mxy(t) ∝ e-t/T2
c.f. Bushberg, et al. The Essential Physics
of Medical Imaging, 2nd ed., p. 393.
© UW and Brent K. Stewart, PhD, DABMP
¬
¬
¬
¬
39
Standard SE pulse sequences use a series of 90°
90° pulses separated
by ∆t = TR (repetition time, msec): [300,3000]
This ∆t allows recovery of Mz through T1 relaxation processes
After the 2nd 90°
90° pulse, a steadysteady-state Mz produces the same FID
amplitude from subsequent 90°
90° pulses: partial saturation
Degree of partial saturation dependent on T1 relaxation and TR
c.f. Bushberg, et al. The Essential Physics
of Medical Imaging, 2nd ed., p. 394.
© UW and Brent K. Stewart, PhD, DABMP
40
10
Nuclear Magnetic Resonance – Bushberg Chapter 14
Diagnostic Radiology Imaging Physics Course
Spin Echo Contrast Weighting
¬
¬
¬
¬
¬
Spin Echo: T1T1-weighting
How the NMR signal changes with different tissue types and pulse
sequence parameters
S ∝ ρ · [1[1-e-(TR/T1)] · e-(TE/T2)
ρ, T1 and T2 are tissue properties
TR and TE are pulse sequence parameters
Each of these values can alter voxel contrast
¬
¬
¬
¬
¬
Short TR to maximize differences in Mz during return to equilibrium
Short TE to minimize differences in T2 dependency of the FID
How T1 values modulate the FID
When TR ranges 400400-600 msec differences in Mz emphasized
Short TE preserves the T1 FID differences with minimum T2 decay
(x,y)
c.f. Bushberg, et al. The Essential Physics
of Medical Imaging, 2nd ed., p. 394.
© UW and Brent K. Stewart, PhD, DABMP
41
c.f. Bushberg, et al. The Essential Physics
of Medical Imaging, 2nd ed., p. 395.
Spin Echo: T1T1-weighting
© UW and Brent K. Stewart, PhD, DABMP
42
Spin Echo: Spin (Proton) Density Weighting
(TR=549,
TE=11)
¬
¬
¬
¬
¬
T1T1-weighted (TR=500, TE=8)
Fat most intense signal
White and gray matter with
intermediate signal
CSF with lowest signal
Typical pulse sequence
parameters
¬
¬
¬
¬
¬
¬
¬
Image contrast due to differences in the nuclear spin density (ρ
(ρ)
Very hydrogenous tissues (e.g., lipids and fats) have high ρ
compared with proteinaceous soft tissues
Aqueous tissues (e.g., CSF) also have a relatively high ρ
Long TR to minimize T1 differences (CSF > fat > GM > WM)
Short TE to minimize T2 decay
TR: 400400-600 msec
TE: 55-30 msec
T1
c.f. Bushberg, et al. The Essential Physics
of Medical Imaging, 2nd ed., p. 395.
© UW and Brent K. Stewart, PhD, DABMP
9, 19 and 26 May 2005
43
c.f. Bushberg, et al. The Essential Physics
of Medical Imaging, 2nd ed., p. 397.
© UW and Brent K. Stewart, PhD, DABMP
44
11
Nuclear Magnetic Resonance – Bushberg Chapter 14
Diagnostic Radiology Imaging Physics Course
Spin Echo: Spin (Proton) Density Weighting
Spin Echo: T2T2-weighting
(TR=2400,
TE=30)
¬
¬
¬
¬
ρ-weighted (TR=2,400, TE=30)
Fat and CSF – relatively bright
Slight contrast inversion
between WM and GM
Typical pulse sequence
parameters
¬
¬
¬
¬
¬
¬
¬
¬
Reduce T1 effects with long TR,
TR, accentuate T2 effects with long TE
T2T2-weighted signal usu. the second echo of a multimulti-echo sequence
Compared with a T1inversion of tissue contrast
T1-weighted image
Short T1 tissues
short T2, long T1 tissues
long T2
TR: 1,5001,500-3,500 msec
TE: 55-30 msec
Highest SNR for SE pulse
sequences
Image contrast relatively poor
ρ
c.f. Bushberg, et al. The Essential Physics
of Medical Imaging, 2nd ed., p. 397.
© UW and Brent K. Stewart, PhD, DABMP
45
c.f. Bushberg, et al. The Essential Physics
of Medical Imaging, 2nd ed., p. 398.
© UW and Brent K. Stewart, PhD, DABMP
46
T1
Spin Echo: T2T2-weighting
Spin Echo Parameters
(TR=2400,
TE=90)
¬
¬
¬
T2−
T2−weighted (TR > 2,000,
TE > 80)
As TE increased, more T2
contrast is achieved at the
expense of reduced Mxy
Typical pulse sequence
parameters
¬
¬
TR: 1,5001,500-3,500 msec
TE: 6060-150 msec
T2
c.f. Bushberg, et al. The Essential Physics
of Medical Imaging, 2nd ed., p. 398.
© UW and Brent K. Stewart, PhD, DABMP
9, 19 and 26 May 2005
T1
ρ
47
c.f. Bushberg, et al. The Essential Physics
of Medical Imaging, 2nd ed., p. 399.
© UW and Brent K. Stewart, PhD, DABMP
48
12
Nuclear Magnetic Resonance – Bushberg Chapter 14
Diagnostic Radiology Imaging Physics Course
Raphex 2002 Diagnostic Questions
Raphex 2000 Diagnostic Questions
¬
D51. A higher intensity MRI spin echo signal is produced
by:
¬
A. Long T1, long T2.
B. Long T1, short T2.
C. Short T1, long T2.
D. Short T1, short T2.
¬
¬
¬
¬
D43. A spin echo pulse sequence is used with a TE time
of 20 ms and a TR of 3000 ms. The MR image obtained
by this technique will be ______ weighted.
¬
A. Atomic number (Z)
B. Mass number (A)
C. Proton density (PD)
D. T1
E. T2
¬
¬
¬
¬
© UW and Brent K. Stewart, PhD, DABMP
49
© UW and Brent K. Stewart, PhD, DABMP
Raphex 2001 Diagnostic Questions
¬
¬
¬
¬
¬
¬
¬
¬
¬
Raphex 2000 Diagnostic Questions
D47D47-D49. Using a normal spinspin-echo pulse sequence in MRI, match
the timing with the type of image:
TE (msec)
TR (msec)
A.
20
400
B.
100
400
C.
100
2000
D. 1000
400
E.
20
2000
9, 19 and 26 May 2005
¬
D47.
D47. A spinspin-echo MRI pulse sequence in which water is
bright and soft tissues are darker would utilize:
¬
A. Long TE, long TR.
B. Long TE, short TR.
C. Short T1, long T2.
D. Short TE, long TR.
E. Short TE, short TR.
¬
¬
¬
¬
D47.
D47. T1T1-weighted.
D48.
D48. T2T2-weighted.
D49.
D49. Proton density weighted.
© UW and Brent K. Stewart, PhD, DABMP
50
51
© UW and Brent K. Stewart, PhD, DABMP
52
13
Nuclear Magnetic Resonance – Bushberg Chapter 14
Diagnostic Radiology Imaging Physics Course
Inversion Recovery (IR)
Inversion Recovery (IR)
¬
¬
¬
¬
¬
¬
¬
¬
Emphasizes T1 by expanding the amplitude of Mz by 2X
Initial 180°
- Mz
180° pulse inverts Mz
After ∆t = TI (inversion
(inversion time),
time), a 90°
90° pulse rotates Mz into Mxy
At ∆t = TI + TE/2, a second 180°
180° pulse induces an FID echo at TE
TR = period between initial 180°
180° pulses
TR < 5 T1 causes partial saturation
¬
¬
¬
Echo amplitude depends on TI, TE, TR and |Mz|
S ∝ ρ · [1[1-2e-(TI/T1)+e-(TR/T1)] · e-(TE/T2)
TI controls contrast between tissues
Can produce negative Mz (out of phase) when short TI used
FID amplitude phase (phase sensitive detection – quadrature
receiver coil) can be preserved or the magnitude taken
(x,y)
c.f. Bushberg, et al. The Essential Physics
of Medical Imaging, 2nd ed., p. 400.
© UW and Brent K. Stewart, PhD, DABMP
53
c.f. Bushberg, et al. The Essential Physics
of Medical Imaging, 2nd ed., p. 400.
IR - T2 Short Tau IR
54
© UW and Brent K. Stewart, PhD, DABMP
IR - T2 Short Tau IR
(TI=150, TR=5520, TE=29)
¬
¬
¬
¬
¬
Short Tau Inversion Recovery (STIR)
Uses very short TI and magnitude signal processing
Materials w/ short T1 have lower sig. intensity (reverse of std. T1T1-weighting)
All tissues pass through zero amplitude (Mz = 0)
Judicious TI selection
suppress a given tissue signal (bounce point)
¬
¬
¬
¬
(TR=750, TE=13)
Null point: TI = ln(2) · T1
Example: fat suppression; T1 =
260 msec (B0=1.5T)
TI =
180 msec
Compared with a T1T1-weighted
sequence, STIR ‘fat
suppression’
suppression’ reduces
distracting fat signal and
eliminates chemical shift
artifacts
Typical STIR: TI = 140140-180
msec; TR = 2,500 msec
FLAIR
(TI=2400 TR=10K, TE=150)
c.f. Bushberg, et al. The Essential Physics
of Medical Imaging, 2nd ed., p. 402.
© UW and Brent K. Stewart, PhD, DABMP
9, 19 and 26 May 2005
55
c.f. Bushberg, et al. The Essential Physics
of Medical Imaging, 2nd ed., p. 402.
© UW and Brent K. Stewart, PhD, DABMP
T2
(TR=2400, TE=90)
56
14
Nuclear Magnetic Resonance – Bushberg Chapter 14
Diagnostic Radiology Imaging Physics Course
IR - Field Attenuated IR and Contrast Comparison
¬
¬
¬
¬
¬
Long TI increases the signal levels of CSF & other long T1 tissues
tissues
FLuid
FLuid Attenuated IR (FLAIR): bounce point at CSF T1 (3,500 msec)
Nulling CSF requires: TI = ln(2) · T1 = 2,400 msec
TR = 7,000 typically employed to allow reasonable Mz recovery
Contrast comparison: T1T1-, ρ-, and T2T2-weighted plus FLAIR
Raphex 2001 Diagnostic Questions
¬
D44. In MRI:
¬
A. For most soft tissues, T2 is longer than T1.
B. T1 decreases with field strength.
C. T1 of CSF is longer than T1 of soft tissue.
D. T2 increases with field strength.
E. T2 of soft tissue is longer than T2 of CSF.
¬
¬
¬
¬
c.f. Bushberg, et al. The Essential Physics
of Medical Imaging, 2nd ed., p. 403.
© UW and Brent K. Stewart, PhD, DABMP
57
© UW and Brent K. Stewart, PhD, DABMP
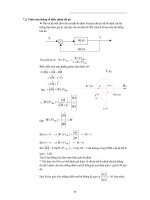
Gradient Recalled Echo (GRE)
¬
¬
¬
¬
¬
Gradient Recalled Echo (GRE)
Magnetic field gradient used to induce the formation of an echo
Gradient changes local magnetic field (B0+∆B): f = (γ/2π)
(γ/2π)··(B0+∆B)
FID signal generated under a linear gradient dephases quickly
Inverted gradient (opposite polarity) used to produce an FID echo
echo
Not a spinspin-echo technique; does not cancel T2* effects
c.f. Bushberg, et al. The Essential Physics
of Medical Imaging, 2nd ed., p. 404.
© UW and Brent K. Stewart, PhD, DABMP
9, 19 and 26 May 2005
58
¬
¬
¬
¬
59
Echo time controlled through gradient magnitude or time offset
Flip angle (θ) a major variable determining contrast in GRE seq.
Less time to excite the spins
short TR
smaller flip θ
For short TR (< 200 msec) more Mz generated w/ small flip θ
c.f. Bushberg, et al. The Essential Physics
of Medical Imaging, 2nd ed., p. 404.
© UW and Brent K. Stewart, PhD, DABMP
60
15
Nuclear Magnetic Resonance – Bushberg Chapter 14
Diagnostic Radiology Imaging Physics Course
GRE - SteadySteady-state Precession with
Short TR (< 50 msec)
GRE Sequence with Long TR (> 200 msec)
¬
For long TR (> 200 msec) GRE and flip θ > 45°
45°: contrast
behavior similar to SE
¬
Major difference signal dependence on T2* rather than T2
Mechanisms of T2* contrast different than T2, especially for
contrast agents
T1T1-weighting achieved with short TE
¬
¬
¬
¬
¬
¬
For flip θ < 30°
30°: small Mxy reduces T1 differences
¬
¬
¬
¬
¬
ρ differences the major contrast attributes for short TE
Longer TE provides T2*T2*-weighting
¬
¬
GRE not useful with long TR except for demonstrating
magnetic susceptibility differences
© UW and Brent K. Stewart, PhD, DABMP
¬
¬
61
© UW and Brent K. Stewart, PhD, DABMP
GRE - SteadySteady-state Precession with
Short TR (< 50 msec) and Contrast Weighting
¬
¬
¬
¬
¬
¬
Small flip θ = 55-30°
30°: ρ-weighted
contrast;
Moderate flip θ = 3030-60°
60°:
T2/T1T2/T1-weighted contrast (some
T1)
Large flip θ = 7575-90°
90°: T2*T2*- and
T1T1-weighted contrast
Typical parameter values for
contrast desired in GRE and
steadysteady-state acquisitions
GRASS/FISP TR = 35 msec,
TE = 3 msec and flip θ = 20°
20°
Unremarkable contrast but flow
¬
¬
¬
GRASS sequence (TR = 24 msec, TE = 4.7
msec, flip θ=50°
50°) volume acquisition. Contrast
unremarkable for white/gray matter due to
T2/T1T2/T1-weighting dependence. Blood appears
bright – MR angiography – reduce contrast of
anatomy relative to vasculature.
9, 19 and 26 May 2005
62
GRE - “SPoiled
SPoiled”” GRE
GRE Techniques (SPGR)
¬
c.f. Bushberg, et al. The Essential Physics
of Medical Imaging, 2nd ed., pp. 406406-407.
© UW and Brent K. Stewart, PhD, DABMP
SteadySteady-state precession: equilibrium of Mz and Mxy from
pulse to pulse in a repitition sequence
For very short TR (< T2*), persistent Mxy occurs
During each pulse aMxy
Mz and bMz
Mxy (a, b <1)
Steadystate
M
and
M
components
coexist
in
Steady
co
z
xy
dynamic equilibrium
GRASS = Gradient Recalled Acq.
cq. in the Steady State
FISP = Fast Imaging with Steadyteady-state Precession
FAST = Fourier Acquired STeady
STeady state
Practical only with short and very short TR
Flip θ has the major impact on contrast
63
¬
Very short TR
poor T1T1weighting
T2* influence reduced by
“spoiling”
spoiling” the steadysteady-state Mxy
by adding phase shift to
successive RF pulses
Mostly T1T1-weighted contrast
Short TR, short TE, moderate
to large flip θ and spoiled Mxy
produces greatest T1 contrast
Better gadolinium contrast than
comparable spin echo, but
increased artifacts and SNR
SPGR sequence (TR = 8 msec, TE = 1.9
msec, flip θ = 20°
20°) 3D volume acquisition.
T1 contrast evident as well as bright blood
and magnetic susceptibility artifact (?).
c.f. Bushberg, et al. The Essential Physics
of Medical Imaging, 2nd ed., p. 408.
© UW and Brent K. Stewart, PhD, DABMP
64
16
Nuclear Magnetic Resonance – Bushberg Chapter 14
Diagnostic Radiology Imaging Physics Course
Signal from Flow
¬
The MR signal from moving fluids (vascular and CSF) is
complicated by many factors:
¬
¬
¬
¬
¬
¬
Signal from Flow
Flow velocity
Vessel orientation
Laminar vs. turbulent flow patterns
Pulse sequences
Image acquisition modes
¬
¬
¬
BlackBlack-blood: double IR (TI ≈ 600 ms)
¬
FlowFlow-related enhancement
¬
¬
¬
65
¬
¬
¬
¬
and 19F experimental procedures
Intravascular bloodblood-pool agents: GdGd-DTPA
¬
Endogenous tracer methods
¬
Labeling of inflowing spins (‘black blood’): tagging
Tagged spins perfuse into tissues
MR signal intensity
¬
BOLD (B
(Blood Oxygen Levelevel-Dependent)
¬
¬
¬
Differential contrast generated by blood metabolism in brain
Oxyhemoglobin
deoxyhemoglobin (paramagnetic) increases
magnetic susceptibility and induced signal loss (increased T2*)
Areas of metabolic activity
correlated signal (functional MR)
© UW and Brent K. Stewart, PhD, DABMP
9, 19 and 26 May 2005
EvenEven-echo rephasing (prominent in slow laminar flow – veins)
Gradient echo images (unsaturated blood): ∝ velocity, slice
‘thinness’
thinness’ and TR
© UW and Brent K. Stewart, PhD, DABMP
¬ 2H, 3He, 17O
¬
IR sequence prefaced with nonnon-selective, volume 180°
180° pulse
66
Perfusion and Diffusion Contrast
Perfusion of cells via capillary bed
Exogenous tracer methods
¬
Dephasing of spins in blood (confused spin alignment)
¬
Perfusion and Diffusion Contrast
¬
Nuclei move out of slice during echo reformation (nothing
focused in Mxy plane
no or little FID signal)
signal)
Flow turbulence: flow voids
¬
‘Bright‘Bright-blood’ to ‘black‘black-blood’
Can be a source of artifacts
Exploited to produce MR angiography images
© UW and Brent K. Stewart, PhD, DABMP
Low signal intensities: highhigh-velocity signal loss
¬
¬
Flow related mechanisms combine with image
acquisition parameters to alter contrast
¬
¬
67
¬
Subtract postpost-stimulus image from prepre-stimulus image
ColorColor-coded overlay to a grayscale anatomic image
demonstrate activity(t)
activity(t) correlating with stimulus(t)
stimulus(t)
Diffusion depends on the random motion of H2O
molecules in tissues
Interactions of the local cellular structure with the
diffusing H2O molecules produces anisotropic,
directionally dependent diffusion
DiffusionDiffusion-weighted sequences use a strong gradient
signal differences based on mobility/directionality
© UW and Brent K. Stewart, PhD, DABMP
68
17
Nuclear Magnetic Resonance – Bushberg Chapter 14
Diagnostic Radiology Imaging Physics Course
Perfusion and Diffusion Contrast
¬
¬
¬
Tissues with H2O mobility have
greater signal loss
In vivo structural integrity of
tissues measured
apparent
diffusion coefficient maps
Sensitive indicator for early
detection of
¬
¬
¬
¬
Magnetization Transfer Contrast
¬
Spine and spinal cord
pathophysiology
Ischemic injury
¬
¬
SpinSpin-echo and echoplanar pulse
sequences with diffusion gradients
Obstacles
¬
¬
DiffusionDiffusion-weighted image (DWI) with gray
scalescale-encoded diffusion coefficients.
Sensitivity to head/brain motion
Eddy currents
c.f. Bushberg, et al. The Essential Physics
of Medical Imaging, 2nd ed., p. 410.
¬
T1
ρ
© UW and Brent K. Stewart, PhD, DABMP
T2
FLAIR
69
c.f. Bushberg, et al. The Essential Physics
of Medical Imaging, 2nd ed., p. 412.
Magnetization Transfer Contrast
¬
¬
¬
¬
¬
¬
¬
¬
MR arthrograms of shoulder in 32-year-old man with suspected glenohumeral instability. Axial 3D gradient-echo MR image obtained using
parametric magnetization transfer pulses no discernible magnetization
transfer contrast in injected fluid or in fatty marrow spaces, whereas
degree of magnetization transfer contrast varies in skeletal muscle,
cartilage, and capsular supporting structures (color scale = 0-100%).
© UW and Brent K. Stewart, PhD, DABMP
9, 19 and 26 May 2005
© UW and Brent K. Stewart, PhD, DABMP
70
Raphex 2000 Diagnostic Questions
This process affects only those
p+ having chemical exchange
with the macromolecules and
improves image contrast
Anatomic imaging of heart,
eye, MS, knee cartilage and
general MR angiography
Tissue characterization
possible as the magnetization
transfer ratio (MTC
(MTCon/MTCoff) is
caused in part by tissuetissuespecific surface chemistry
c.f. Yao L, Thomasson D. Magnetization
transfer contrast in rapid threethree-dimensional
MR imaging using segmented
radiofrequency prepulses.
prepulses. AJR 2002; 179:
863863-5 .
Result of selective observation
of the interaction between the
p+ in free H2O molecules and
p+ in macromolecular proteins
due to coupling or chemical
exchange
Can be excited separately
using narrownarrow-band RF
Magnetization transferred from
macromolecular p+ to free H2O
p+
Reduced signal from adjacent
free H2O p+
71
¬
D45.
D45. A 90°
90° RF pulse followed within 100 ms by a 180°
180°
pulse with a repetition rate of 3000 ms would produce
images designated as:
A. Fast gradient echo
B. Fast spin echo
C. Inversion recovery
D. Spin echo T1T1-weighted
E. Spin echo T2T2-weighted
© UW and Brent K. Stewart, PhD, DABMP
72
18