The Market Forces of Supply and Demand
Bạn đang xem bản rút gọn của tài liệu. Xem và tải ngay bản đầy đủ của tài liệu tại đây (362.92 KB, 30 trang )
The Market Forces of
Supply and Demand
Chapter 4
Markets
A market is a group of buyers and sellers
of a particular good or service.
The terms supply and demand refer to the
behavior of people . . . as they interact
with one another in markets.
And Economics, especially
Microeconomics is about how supply and
demand interact in markets.
Market Types or Structures
Competitive Markets
Products are the same,price takers
Monopoly
Monopolistic Competition
Oligopoly
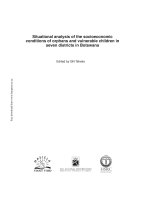
Demand Curve
Price of
Ice-Cream
Cone
$3.00
2.50
2.00
1.50
1.00
0.50
0 1
2 3 4 5 6 7 8 9 10 11 12
Quantity of
Ice-Cream
Cones
Why does the Demand
Curve Slope Downward?
Law of Demand
Inverse relationship between price and
quantity.
Law of Diminishing Marginal Utility.
Utility is the extra satisfaction that one
receives from consuming a product.
Marginal means extra.
Diminishing means decreasing.
Market Demand
Market demand refers to the sum of
all individual demands for a
particular good or service.
Graphically, individual demand
curves are summed horizontally to
obtain the market demand curve.
Ceteris Paribus
Ceteris paribus is a Latin phrase that
means all variables other than the
ones being studied are assumed to be
constant. Literally, ceteris paribus
means “other things being equal.”
The demand curve slopes downward
because, ceteris paribus, lower prices
imply a greater quantity demanded!
Two Simple Rules for
Movements vs. Shifts
Rule One
When an independent variable changes and that
variable does not appear on the graph, the curve on
the graph will shift.
Rule Two
When an independent variable does appear on the
graph, the curve on the graph will not shift, instead
a movement along the existing curve will occur.
Let’s apply these rules to the following cases of
supply and demand!
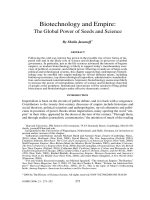
Change in Quantity Demanded
versus Change in Demand
Change in Quantity Demanded
Movement along the demand curve.
Caused by a change in the price of
the product.
Price of
Cigarettes
per Pack
$4.00
Changes in Quantity
Demanded
C
A tax that raises the
price of cigarettes
results in a movement
along the demand
curve.
A
2.00
D1
0
12
20
Number of Cigarettes
Smoked per Day
Change in Quantity Demanded
versus Change in Demand
Change in Demand
A shift in the demand curve, either
to the left or right.
Caused by a change in a
determinant other than the price.
Determinants of Demand
Market price
Consumer income
Prices of related goods
Tastes
Expectations
What are some examples?
Consumer Income
Price of
Ice-Cream
Cone
Normal Good
$3.00
An increase
in income...
2.50
Increase
in demand
2.00
1.50
1.00
0.50
D1
0 1
2 3 4 5 6 7 8 9 10 11 12
D2
Quantity of
Ice-Cream
Cones
Consumer Income
Price of
Ice-Cream
Cone
Inferior Good
$3.00
2.50
An increase
in income...
2.00
Decrease
in demand
1.50
1.00
0.50
D2
0 1
D1
2 3 4 5 6 7 8 9 10 11 12
Quantity of
Ice-Cream
Cones
Prices of Related Goods
Substitutes & Complements
When a fall in the price of one good
reduces the demand for another good,
the two goods are called substitutes.
When a fall in the price of one good
increases the demand for another
good, the two goods are called
complements.
Change in Quantity Demanded
versus Change in Demand
Variables that
Affect Quantity
Demanded
A Change in
This Variable . . .
Price
Represents a movement
along the demand curve
Income
Shifts the demand curve
Prices of related
goods
Shifts the demand curve
Tastes
Shifts the demand curve
Expectations
Shifts the demand curve
Number of
buyers
Shifts the demand curve
Price of
Ice-Cream
Cone
Supply Curve
$3.00
2.50
2.00
1.50
1.00
0.50
0
1 2 3 4 5 6 7 8 9 10 11 12
Quantity of
Ice-Cream
Cones
Law of Supply
The law of supply states that there is a
direct (positive) relationship between
price and quantity supplied.
Supply
Quantity supplied is the amount of a
good that sellers are willing and able
to sell.
Change in Quantity Supplied
Price of
Ice-Cream
Cone
S
C
$3.00
A
1.00
0
1
5
A rise in the price
of ice cream cones
results in a
movement along
the supply curve.
Quantity of
Ice-Cream
Cones
Market Supply
Market supply refers to the sum of
all individual supplies for all sellers
of a particular good or service.
Graphically, individual supply
curves are summed horizontally to
obtain the market supply curve.
Determinants of Supply
Market price
Input prices
Technology
Expectations
Number of producers
What are some examples?
Change in Supply
S3
Price of
Ice-Cream
Cone
S1
S2
Decrease in
Supply
Increase in
Supply
0
Quantity of
Ice-Cream
Cones
Change in Quantity Supplied
versus Change in Supply
Variables that
Affect Quantity Supplied
A Change in This Variable . . .
Price
Represents a movement along
the supply curve
Input prices
Shifts the supply curve
Technology
Shifts the supply curve
Expectations
Shifts the supply curve
Number of sellers
Shifts the supply curve
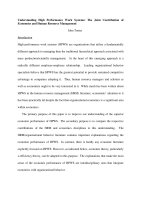
Equilibrium of
Supply and Demand
Price of
Ice-Cream
Cone
Supply
$3.00
Equilibrium
2.50
2.00
1.50
1.00
Demand
0.50
0
1 2 3 4 5 6 7 8 9 10 11 12
Quantity of
Ice-Cream
Cones