Vietnam ma research report 2016
Bạn đang xem bản rút gọn của tài liệu. Xem và tải ngay bản đầy đủ của tài liệu tại đây (1.33 MB, 78 trang )
M&A Opportunities from Global Integration
Vietnam M&A Research Report 2016 – Issue 6
08 January 2016
Thuan Nguyen, FCCA
Lan Nguyen
Hai Khieu
Anh Nguyen
CEO
Senior Manager
Research Associate
Research Associate
StoxPlus Corporation
StoxPlus Corporation
StoxPlus Corporation
StoxPlus Corporation
+84(4) 35626962 (ext. 111)
+84(4) 35626962 (ext. 109)
+84(4) 35626962 (ext. 108)
+84(4) 35626962 (ext. 108)
Table of contents
PREFACE
3
ACRONYMS
4
Our Methodology
5–6
Important Disclosures
7
EXECUTIVE SUMMARY
8-9
VIETNAM M&A ACTIVITIES REVIEW
11 - 31
OPPORTUNITIES FROM FTAs
32 - 46
UPDATE ON REALIZATION OF OPPORTUNITIES FROM SOE PRIVATIZATION
47 - 54
REGULATORY FRAMEWORK FOR M&A IN VIETNAM
55 - 64
Appendix 1: In-bound M&A Transactions Factsheet
65 - 77
About StoxPlus Corporation
78
@ 2016 StoxPlus Corporation.
All rights reserved. All information contained in this publication is copyrighted in the name of StoxPlus, and as such no part of this publication
may be reproduced, repackaged, redistributed, resold in whole or in any part, or used in any form or by any means graphic, electronic or
mechanical, including photocopying, recording, taping, or by information storage or retrieval, or by any other means, without the express written
consent of the publisher.
Vietnam M&A Research Report 2016 | Issue 6 | 8 January 2016
2
Preface
We are pleased to bring you the Vietnam M&A
Research Report 2016 (Issue 6). In addition to
the M&A data mining, we also focus on M&A
opportunities and capital flows into Vietnam
thanks to a number of FTAs, namely VietnamSouth Korea FTA, TPP.
Our M&A report utilized extracted database
with over 5 years of historical data in
Vietnam. In addition to data analysis, the
report also relies on the authors extensive
knowledge and experience in advising deals in
Vietnam. We have surveyed relevant foreign
and local institutional investors as well as
conducting a number of in-depth interviews in
with experienced M&A advisers and
Government officials in during our
preparation.
We strongly believe that this report will be
valuable to institutional investors, investment
companies and foreign players who are
considering M&A as a strategy to set a
foothold or to expand your businesses in
Vietnam.
Vietnam M&A Research Report 2016 | Issue 6 | 8 January 2016
About StoxPlus
This report is prepared by a team of
experienced analysts, researchers and data
clerks at StoxPlus. StoxPlus is a leading
financial and business information provider in
Vietnam. Our services include provision of
high quality data feeds, analytic tools and
market research.
StoxPlus is now serving a client portfolio of
over 100 corporate data clients including
securities companies, research houses, asset
managers, investment companies, and
thousands of sophisticated individual
investors.
Our Research division has been established as
an independent research house in Vietnam to
provide local insights to our clients at quality
standards of the World’s prestige advisory
firms. More details can be found at
www.StoxResearch.com.
If you have any questions about this report or
our services, please don not hesitate to
contact Thuan Nguyen, CEO of StoxPlus at
or +84- 4-3562
6962, ext 111.
3
Acronyms
No.
1
2
3
4
5
6
7
8
9
10
11
12
13
14
15
16
17
18
19
20
21
22
23
24
25
26
Word
AEC
AnDate
ASEAN
BOD
CAGR
CF
ECs
EGs
FTAs
GCs
GRDI
GSO
HNX
HOSE
IPSI
MAC
MARD
MM
MNCs
SBV
SCs
SEGs
SOE
SSC
TBT
WEF
Stands for
ASEAN Economic Community
Announcement Date
The Association of Southeast Asian Nations
Board of Directors
Compounding Annual Growth Rate
Consumer Finance
Economic Corporations
Economic Groups
Free Trade Agreements
Government Corporations
Global Retail Development Index
General Statistics Office
Hanoi Stock Exchange
Ho Chi Minh City Stock Exchange
Industrial Policy and Strategy Institute
Middle and Affluent Class
Ministry of Agriculture and Rural Development
Money Market
Multi-National Corporations
The State Bank of Vietnam
State Corporations
State Enterprise Groups
State-Owned Enterprise
State Securities Commission
Technical Barriers to Trade
World Economic Forum
Vietnam M&A Research Report 2016 | Issue 6 | 8 January 2016
4
Our Methodology
Sources and Completeness of Data
• Data works in Vietnam are actually a very tedious and time consuming job due to lack of a
sound reporting system and regulations. This is particularly true for M&A activities. In many
case where the seller finds it positive for their public relation or investor relation works,
they would be proactive in spreading the news.
• In many cases, including the public and listed companies, we found it hard to obtain an
official explanation in a deal that has been actually concluded. This is particularly true in
Real Estate sector where it is sensitive from tax perspective if the deal value and details are
announced.
• As such, we combine a variety of sources and data mining skills to uncover as many as
possible unannounced M&A deals that have happened. Even though our database is yet
comprehensive, we believe our methodology is as exhaustive as possible to identify M&A
deals in Vietnam.
Public domains
Unannounced deals –
Surveyed by StoxPlus
Unannounced deals – Unidentified
(Unknown unknown)
Vietnam M&A Research Report 2016 | Issue 6 | 8 January 2016
5
Our Methodology
Sources and Completeness of Data
• Our sources of M&A data include:
• Public information and media releases;
• Data announced by reliable portals such as Bloomberg and Thomson Reuters;
• Large shareholder transactions on HOSE and HNX from Fiinpro platform;
• Review changes of management team of all public companies from Fiinpro
platform;
• Data mining from financial statements of large corporations in Vietnam;
• Press release from all private equity funds.
• We believe that our database might not include all M&A transactions but it is the most
comprehensive in Vietnam and have covered all the market in all material aspects.
Deal Value
• If deal value is not publicly and explicitly disclosed, we calculate the deal size from
deal parameters such as purchase price per share. We also obtained deal size and
value from our intelligent network where possible.
Deal Valuation Multiples
• In calculating price earning ratio (P/E), we use the acquiree latest EPS. For deal P/B,
we take the deal price divided by book value per share in a pre-deal basis, this means
the cash proceed from the transaction is not included in the book value.
Sector Classification
• We adopt the Industrial Classification Benchmark (ICB) for all sector classification.
Vietnam M&A Research Report 2016 | Issue 6 | 8 January 2016
6
Important Disclosures
• This material is prepared by StoxPlus Corporation for information purpose
only. This material is not intended to recommend or suggest any
particular transaction.
• Any information contained in this material shall be used at your own
discretion and risk. StoxPlus Corporation will not be subject to any
liability for any consequence caused by the information contained in this
material.
• This material may be changed without any prior notice. Content of this
material may be changed according to any changes in the situation, or
effects of the additional information after its preparation, and StoxPlus
Corporation shall undertake no obligation to update, revise or
complement the content of this material according to the changes.
• While this material is prepared based on the public information and other
information StoxPlus Corporation duly obtained, StoxPlus Corporation has
not independently verified its accuracy, completeness, or suitability for
your use, also shall not guarantee them.
• StoxPlus Corporation reserves the copyright of this material. This material
is protected in accordance with the copyright laws of Vietnam and other
countries, as well as the treaty provisions regarding the copyrights signed
between Vietnam and other countries. For any purpose whatsoever, no
one shall be entitled to duplicate, summarize, quote, or reprint this
material, or disclose it to the third party without StoxPlus Corporation’s
prior consent.
Vietnam M&A Research Report 2016 | Issue 6 | 8 January 2016
7
Executive Summary
Vietnam M&A continued its upward trend: Vietnam
M&A in 2015 recorded 341 deals completed with total
value of US$5.20bn. This indicates a 23.1% increase in
terms of number of deals (compared to 277 deals in
2014) and 9.7% increase in deal value (compared to
US$4.74bn).
Small and medium deals still dominated the market.
Particularly, M&A deals with value less than US$25mn
stayed at 288 out of 341, equivalent to 84% of total
deal number.
Inbound M&A into Vietnam accounted for 46% of
M&A deal value and totaled US$2.42bn in 2015, 21%
lower than in 2014. There were only 98 inbound deals
originated by investors from familiar countries such as
Hong Kong, Thailand, Japan, South Korea, US, Malaysia
and Singapore. In terms of deal volume, Japanese were
the most active investors with 15 inbound deals,
totaling US$310.4mn, or 12.8% of total inbound value.
In terms of deal value, Hong Kong investors topped
with 05 Real Estate deals, 02 Retail deals and 01 Travel
& Leisure deal, having total investment of
US$1,101.5mn or 45.5% total inbound M&A deal value.
This page is intentionally removed for demo purpose
Inbound M&A in 2015
0
300
600
900
1,200
Hong Kong
Japan
Thailand
South Korea
US
Malaysia
Singapore
Canada
Finland
Taiwan
Philippines
Kazakhstan
na
UK
Caymand Islands
Majority
Minority
Vietnam M&A Research Report 2016 | Issue 6 | 8 January 2016
8
Executive Summary (Cont’d)
Capital flow from Japan has dropped in recent years,
but is expected to bounce back after TPP is signed.
In 2015, two-way trade between Vietnam and Japan
totaled US$24bn, with Vietnam experiencing a trade
surplus. Due to TPP and removed tariffs, trade
activities will likely increase, especially seafood
exported from Vietnam and plastic products imported
from Japan to Vietnam.
Japanese firm could increase investment in textile,
which is the top sector from Vietnam to Japan
currently. One such case is Itochu, who invested 5% in
Vinatex – the leading textile corporation in Vietnam –
back in 2014. After the deal, Itochu continued to sign a
business alliance with Vinatex to build its capacity on
dyeing and textile materials production. The reason is
to take advantage of TPP and country of origin
(“COG”) requirement. Currently, Vietnamese
companies imported most of the textile materials. If
the materials are not made in Vietnam, the product
cannot meet the COG requirement of TPP and thus
export taxes would still be applied. Therefore, the
investment of Itochu in Vinatex made sense in order
for them to take advantage of TPP’s removed tariffs.
This page is intentionally removed for demo purpose
Top 5 export sectors from Vietnam to
Japan by value (US$mn)
490
Crude Oil
1,502
650
Seafood products
1,195
932
Machinery & parts
1,431
1,255
Transportation vehicles & parts
2,065
1,774
Textile products
-
500
8M2015
2,620
1,000 1,500 2,000 2,500 3,000
2014
Vietnam M&A Research Report 2016 | Issue 6 | 8 January 2016
9
Section 1: Vietnam M&A Activity
Review
1.1
Vietnam M&A Activities Review
1.2
Inbound M&A
1.3
Domestic M&A
1.4
Outbound M&A
Vietnam M&A Research Report 2016 | Issue 6 | 8 January 2016
10
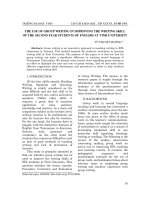
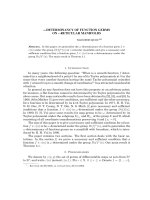
Section 1: Vietnam M&A Activities Review
M&A activity in Vietnam has been on an upward trend
US$ trillion
Figure 1: Global M&A deals forecast, 1996-2015
Global M&A deals are on an
upward trend with forecasted
deal value of US$4.1 trillion in
2015. The strength of BOM,
regulatory pressures and
economic patterns — GDP
growth, equity market stability
and cost of capital — will be
the key factors to support or
disrupt the projected growth.
In this respect the recent full
value of major equity market
indices, which is in line with
the high of 2009, should be
followed closely for signs of
excess valuations.
4.50
4.00
3.50
3.00
2.50
2.00
1.50
1.00
0.50
0.00
4.1
3.9
3.3
3.6
3.2
2.7
2.3
1.1
2.7
2.1
1.3
1996 1998 2000 2002 2004 2006 2008 2010 2012 2014 2015
Source: StoxPlus from Dealogic, IMF
Note: “The forecast was based on the hypothesis that the M&A/GDP pattern could repeat
itself, global activity as a % of GDP could reach 3%, 3.1% & 4% in 2014, 2015 and 2016
respectively, mirroring the actual GDP growth rates of 2002, 2003 and 2004. When matched
with the IMF GDP forecast for the same years, this means that activity could eventually reach
U.S.$4.1 trillion by 2016”.
Figure 2: Vietnam M&A deal size and number of deals, 2003 – 2015
This page is intentionally removed for demo purpose
Source: StoxPlus
Notes: 14 out of 341 deals do not disclose their deal values and do not provide reasonable
estimation basis.
Vietnam M&A Research Report 2016 | Issue 6 | 8 January 2016
11
Section 1: Vietnam M&A Activities Review
Deal size analysis: Small & medium deals continued to dominate the market
Figure 3: M&A number of deal by size, 2013 - 2015
Our database recorded an
increase in the number of mega
deals in 2015 which are mainly
in real estate and banking
sector.
100%
More than US$100mn
90%
80%
US$50-100mn
70%
60%
US$25-50mn
50%
US$5-25mn
40%
30%
US$1-5mn
20%
10%
Less than US$1mn
0%
2015
2014
2013
Source: StoxPlus
This page is intentionally removed for demo purpose
Figure 4: Vietnam M&A deal size and number of deals, 2015
Source: StoxPlus
Vietnam M&A Research Report 2016 | Issue 6 | 8 January 2016
12
Section 1: Vietnam M&A Activities Review
Vietnam M&A Marker 2015: Further Data and Figures
Figure 5: Breakdown of deals by value in 2015
Source: StoxPlus
Figure 6: M&A Vietnam Market by sector in 2015
This page is intentionally removed for
demo purpose
2015
M&A Market by Sector
US$m
Value
Vol (#)
Minority
Majority
Real Estate
Banks
Construction & Materials
Food & Beverage
Retail
Industrial Goods & Services
Financial Services
Insurance
Media
Basic Resources
Travel & Leisure
Utilities
Health Care
Technology
Personal & Household Goods
Chemicals
Oil & Gas
Telecommunications
Total
Source: StoxPlus
Vietnam M&A Research Report 2016 | Issue 6 | 8 January 2016
13
Section 1: Vietnam M&A Activities Review
Vietnam M&A Market 2015: Further Data and Figures
Figure 7: M&A Vietnam Market by sub-sector ICB level 4 in 2015
M&A Market by Sub-sector level 4
M&A Market by Sub-sector level 4
US$m
US$m
2015
Value
Vol
2015
Value
Real Estate Holding & Development
Business Support Services
Banks
Clothing & Accessories
Heavy Construction
Hotels
Farming, Fishing & Plantations
Commercial Vehicles & Trucks
Food Products
Paper
Specialty Retailers
Recreational Services
Soft Drinks
Electrical Components & Equipment
Containers & Packaging
Commodity Chemicals
Full Line Insurance
Health Care Providers
Consumer Finance
Iron & Steel
Broadline Retailers
Integrated Oil & Gas
Broadcasting & Entertainment
Footwear
Investment Services
Water
Building Materials & Fixtures
Financial Administration
This page is intentionally removed
for demo purpose
Software
Nonferrous Metals
Transportation Services
Delivery Services
Pharmaceuticals
Travel & Tourism
Electricity
Restaurants & Bars
General Mining
Specialty Chemicals
Real Estate Services
Food Retailers & Wholesalers
Marine Transportation
Internet
Industrial Suppliers
Brewers
Home Improvement retailers
Waste & Disposal Services
Business Training & Employment
Durable Household products
Furnishings
Trucking
Apparel Retailers
Conventional Electricity
Telecommunications Equipment
Media Agencies
Medical Equipment
Fixed Line Telecommunications
Distillers & Vintners
Financial Service
Asset Managers
Computer Services
Oil Equipment & Services
Consumer Electronics
Specialized Consumer Services
Alternative Electricity
Gas distribution
Electronic Equipment
Industrial Machinery
Publishing
Total
Source: StoxPlus
Vietnam M&A Research Report 2016 | Issue 6 | 8 January 2016
14
Vol
Section 1: Vietnam M&A Activity
Review
1.1
Vietnam M&A Activities Review
1.2
Inbound M&A
1.3
Domestic M&A
1.4
Outbound M&A
Vietnam M&A Research Report 2016 | Issue 6 | 8 January 2016
15
Section 1: Vietnam M&A Activities Review
M&A activity in Vietnam has been on an upward trend
Figure 8: Breakdown of M&A deal size by category
100%
80%
60%
40%
20%
0%
2011
Source: StoxPlus
2012
Domestic
2013
Inbound
2014
Outbound
2015
This page is intentionally removed for demo purpose
Figure 9: Inbound M&A in 2014
Figure 10: Inbound M&A in 2015
Thailand
US
Malaysia
Israel
Hong Kong
Japan
Singapore
UK
Indonesia
Denmark
Finland
Undisclosed
Norwegian
NGO
Ireland
Minority
Majority
Source: StoxPlus
Vietnam M&A Research Report 2016 | Issue 6 | 8 January 2016
Source: StoxPlus
16
Section 1: Vietnam M&A Activities Review
Inbound M&A: Sector analysis
Figure 11: Inbound deal value by sector in 2015
Foreign investors’ preference
changed from customeroriented sectors to industrials
sector to take advantages of
FTAs and warming up real
estate sector.
Source: StoxPlus
This page is intentionally removed for demo purpose
Figure 12: Inbound M&A deal value by sector, 2014
Figure 13: Inbound M&A deal value by sector, 2015
Retail
Real Estate
Food & Beverage
Oil & Gas
Travel & Leisure
Banks
Chemicals
Industrial Goods & Services
Construction & Materials
Personal & Household Goods
Automobiles & Parts
Technology
Utilities
Financial Services
Basic Resources
Minority
Majority
Source: StoxPlus
Vietnam M&A Research Report 2016 | Issue 6 | 8 January 2016
Source: StoxPlus
17
Section 1: Vietnam M&A Activities Review
Inbound M&A: Real estate spotlight
1800
1600
1400
1200
1000
800
600
400
200
0
25
20
15
10
5
0
2012
2013
Value
Source: StoxPlus
Acquiror name
Acquiror
nation
Target company/
asset
2014
Vol
% Stake
acquired
Seller
2015
Type
Deal value
(US$ mn)
Gaw Capital Partners
Chow Tai Fook Corp (Hong
Kong)
Creed Group
Warburg Pincus LLC
This page is intentionally removed for demo purpose
Figure 15: Inbound Real Estate M&A by country, 2014 -2015
Others
2%
US
4%
Singapore
4%
Japan
21%
Hong Kong
28%
Israel
41%
Malaysia
4%
South
Korea
US
5%
6%
Japan
16%
Singapore
1%
Caymand
Islands
1%
Hong
Kong
67%
Source: StoxPlus
Vietnam M&A Research Report 2016 | Issue 6 | 8 January 2016
18
No. of deals
Deal value (US$ million)
Figure 14: Inbound Real Estate M&A , 2012 – 2015
Section 1: Vietnam M&A Activities Review
Inbound M&A: Real estate spotlight (cont’d)
Figure 16: Inbound Real Estate M&A , 2012 – 2015
The average size of inbound
real estate M&A valued at
US$88.16 mn, much bigger
than the figure in the previous
years.
Source: StoxPlus
This page is intentionally removed for demo purpose
Vietnam M&A Research Report 2016 | Issue 6 | 8 January 2016
19
Section 1: Vietnam M&A Activities Review
Inbound M&A: Industrial Goods & Services
Deal value (US$ million)
200
18
16
14
12
10
8
6
4
2
0
150
100
50
0
2012
Source: StoxPlus
2013
Value
2014
Vol
2015
This page is intentionally removed for demo purpose
Vietnam M&A Research Report 2016 | Issue 6 | 8 January 2016
20
No. of deal
Figure 17: Inbound Industrial Goods & Services M&A, 2012 - 2015
Industrial Goods & Service
caught the eye of foreign
investors in 2015 with total
deal value of US$178.18mn.
Section 1: Vietnam M&A Activities Review
Inbound M&A: Industrial Goods & Services (cont’d)
Figure 18: Inbound Industrial Goods & Services M&A Average deal
size, 2011 - 2015
Source: StoxPlus
• The average size of inbound Industrial Goods & Services M&A deals for 2015 indicated an upward
trend compared to that figure in 2014 since there was several majority take over in Packaging and
Delivery Services.
Figure 19: Inbound Industrial Goods & Services M&A by country, 2015
South Korea is eyeing at
Vietnam Industrial Goods &
Services.
This page is intentionally removed for demo purpose
Source: StoxPlus
Vietnam M&A Research Report 2016 | Issue 6 | 8 January 2016
21
Section 1: Vietnam M&A Activities Review
Inbound M&A: Spotlight in Packaging Sector
Figure 20: Major Inbound M&A deal in Vietnam Packaging Sector
Source: StoxPlus
(*) Deal value is based on public announcement of the companies.
This page is intentionally removed for demo purpose
Overview about Vietnam Flexible Packaging Market
Figure 21: Plastic Packaging Production Volume
800
Thousand Tons
Figure 22: Top Manufacturers’ Revenue in 2014
40%
30%
600
20%
400
10%
200
0
US$ mn
1,000
80
70
60
50
40
30
20
10
0
0%
Prodution volume
Source: StoxPlus from GSO
Vietnam M&A Research Report 2016 | Issue 6 | 8 January 2016
Source: StoxPlus
22
Section 1: Vietnam M&A Activities Review
Inbound M&A: Construction & Materials
Deal value (US$ million)
700
20
18
16
14
12
10
8
6
4
2
0
600
500
400
300
200
100
0
2011
Source: StoxPlus
2012
2013
Value
2014
No. of deal
Figure 23: Inbound Construction & Materials M&A, 2011 - 2015
Construction & Material M&A
is on the upward trend in 2015
in terms of deal value with
active participation of foreign
funds.
2015
Vol
This page is intentionally removed for demo purpose
Figure 24: Inbound Construction & Materials M&A deal value by country, 2015
Source: StoxPlus
Vietnam M&A Research Report 2016 | Issue 6 | 8 January 2016
23
Section 1: Vietnam M&A Activity
Review
1.1
Vietnam M&A Activities Review
1.2
Inbound M&A
1.3
Domestic M&A
1.4
Outbound M&A
Vietnam M&A Research Report 2016 | Issue 6 | 8 January 2016
24
Section 1: Vietnam M&A Activities Review
Domestic M&A: Overall
Figure 25: Domestic M&A deal value, 2011 - 2015
Figure 26: Domestic M&A by target ownership, 2015
Local
SOE
36%
Local
Private
64%
Source: StoxPlus
Source: StoxPlus
This page is intentionally removed for demo purpose
Figure 27: Domestic M&A by sector in 2014
Figure 28: Domestic M&A by sector in 2015
Real Estate
Food & Beverage
Chemicals
Construction & Materials
Industrial Goods & Services
Financial Services
Personal & Household goods
Utilities
Banks
Technology
Retail
Health Care
Oil & Gas
Travel & Leisure
Basic Resources
Minority
Majority
Source: StoxPlus
Vietnam M&A Research Report 2016 | Issue 6 | 8 January 2016
Source: StoxPlus
25