Economic Values of Coral Reefs, Mangroves, and Seagrasses A Global Compilation 2008
Bạn đang xem bản rút gọn của tài liệu. Xem và tải ngay bản đầy đủ của tài liệu tại đây (743.48 KB, 42 trang )
Economic Values of Coral Reefs,
Mangroves, and Seagrasses
A Global Compilation
2008
WORLD
RESOURCES
INSTITUTE
Conservation International (CI)
Conservation International’s mission is to preserve the Earth’s living heritage, our
global biodiversity, and to demonstrate that human societies can live harmoniously with
nature.
Coastal Ocean Values Center (COVC)
The mission of The Ocean Foundation’s Coastal Ocean Values Center is to create a
national program of coordinated research and data collection on economic indicators
of coastal ecosystem health, to educate the public and coastal managers about the
economic importance of coastal activities, and to provide economic data and analysis to
improve coastal and ocean management.
World Resources Institute (WRI)
The World Resources Institute’s mission is to move human society to live in ways that
protect Earth’s environment and its capacity to provide for the needs and aspirations of
current and future generations.
NOAA
The mission of the United States National Oceanic and Atmospheric Administration
(NOAA) is to understand and predict changes in Earth’s environment and conserve
and manage coastal and marine resources to meet our Nation’s economic, social, and
environmental needs.
International Coral Reef Initiative (ICRI)
ICRI is a unique public-private partnership that brings together governments, international
organizations, scientific entities, and non-governmental organizations committed to
reversing the global degradation of coral reefs and related ecosystems, such as mangrove
forests and seagrass meadows, by promoting the conservation and sustainable use of
these resources for future generations.
© Copyright 2008 by Conservation International. All rights reserved.
Conservation International
Center for Applied Biodiversity Science (CABS)
Marine Management Area Science Program (MMAS)
2011 Crystal Drive, Suite 500
Arlington, VA 22202 USA
Phone: +1 703 341-2718
Fax:
+1 703 979-0953
Web: www.conservation.org/MMAS
Contact:
Giselle Samonte-Tan
E-mail:
Suggested citation: Conservation International. 2008. Economic Values of Coral Reefs, Mangroves, and
Seagrasses: A Global Compilation. Center for Applied Biodiversity Science, Conservation International,
Arlington, VA, USA.
Photos:
Front cover: [left and center] CI / Sterling Zumbrunn; [right] Mark and Dianne Littler / Smithsonian Institution
Back cover: [left] Mark and Dianne Littler / Smithsonian Institution; [center] Marine Photobank/Craig Shuman, Reef Check;
[right] CI / Sterling Zumbrunn
Valuation cases compiled by Sharon Khan and Cecilia Larrosa.
Foreword
T
ropical marine and coral reef ecosystems, including mangroves
and seagrasses, are vulnerable environmental resources that provide significant economic goods and services and contribute to the livelihoods, food
security and safety of millions of people around the world. The health of these
resources is critical to human well-being. By accounting for coastal marine
and coral reef ecosystem values in management decisions, we can sustain their
flow of goods and services in the interest of current and future generations.
Recognizing the importance of economic valuations, in January 2008, the
International Coral Reef Initiative (ICRI) established an Ad Hoc Committee on Economic Valuation of Coral Reef Ecosystems. The Committee is
co-chaired by the Mexico-United States ICRI Secretariat and the World Resources Institute (WRI), and has as its primary responsibility the compilation
of an inventory of studies, articles and publications to support ICRI members
in coral reef valuation.
Toward this effort, Conservation International’s Marine Management
Area Science Program has produced “Coral Reefs, Mangroves and Seagrass
Economic Values: A Global Compilation,” in cooperation with The Ocean
Foundation’s Coastal Ocean Values Center, the WRI, and the United States
National Oceanic and Atmospheric Administration (NOAA). The booklet
compiles the results of a wide variety of economic valuation studies on coral
reef and related ecosystems around the world, with a focus on the following
ecosystem goods and services:
•
Tourism: People the world over visit coral reefs to enjoy the recreational opportunities that these ecosystems provide, including
SCUBA diving, snorkeling, and glass-bottom-boat viewing.
•
Fisheries: Coral reefs and their surrounding ecosystems, including mangroves and seagrass beds, provide important fish
habitat.
•
Coastal protection: Coral reefs serve as natural barriers to
storm surges that can cause great destruction to coastlines and
communities.
•
Biodiversity: The United Nations’ Atlas of the Oceans describes
coral reefs as among the most biologically rich ecosystems
Economic Values of Coral Reefs, Mangroves, and Seagrasses: A Global Compilation 2008
i
Foreword
on earth, with about 4,000 species of fish and 800 species of
reef-building corals described to date.
•
Carbon sequestration: Coral reefs remove carbon dioxide from
the atmosphere and are thus important for the mitigation of
global warming.
Section 1 of the booklet summarizes a sample of economic values for coral
reef and surrounding ecosystems estimated at global, regional and site-specific
levels. Section 2 provides a summary of values with a focus on tourism and
recreation, fisheries, coastal protection, biodiversity, and carbon sequestration.
Section 3 provides a sample of values for the degradation or loss of ecosystem
services. References for these valuations are listed at the end of the booklet.
The studies referenced have been peer-reviewed and published. However, their
inclusion here is not an affirmation of the findings. It is also important to
note that many of the values presented are not necessarily comparable across
studies and sites. We encourage the readers to view the original sources for
details on the contexts, methodologies and suitable uses of each result in this
booklet.
We hope this global compilation will be a useful reference for marine area
managers, policy makers, community stakeholders, and others interested in
improving the conservation of coral reef and associated coastal ecosystems.
The data presented in this booklet are highlighted in a global map available
online at www.consvalmap.org. For more details, you can access many of the
referenced technical papers and journal articles by joining the Coral Reef
Economics Community of Practice; www.communities.coastalvalues.org/
coralreef.
There are many efforts currently underway to value coral reefs, mangroves
and seagrasses. The website will continue to be updated and we welcome additional statistics, which can be sent to www.consvalmap.org.
Ricardo Gómez Lozano
Mexico Co-Chair, ICRI
Director of the National Park
of Cozumel
CONANP
ii
Stephanie J. Caswell
United States Co-Chair, ICRI
Director, Office of Ecology &
Natural Resource Conservation
United States Department of State
Table of Contents
Section 1: Global, Regional, and Site-Specific Values........................ 1
Global Values.......................................................................... 1
Regional Values....................................................................... 1
Site-Specific Values................................................................... 2
Section 2: Ecosystem Goods and Services Values.............................. 8
Tourism and Recreation............................................................ 8
Fisheries................................................................................ 15
Coastal Protection.................................................................. 20
Biodiversity............................................................................ 22
Carbon Sequestration............................................................. 23
Section 3: Degradation or Loss of Ecosystem Services Values............ 24
References................................................................................... 27
Index........................................................................................... 33
Economic Values of Coral Reefs, Mangroves, and Seagrasses: A Global Compilation 2008
iii
Section 1: Global, Regional, and Site-Specific Values
This section contains a sample of values for coral reefs and surrounding
ecosystems estimated at the global, regional and site-specific levels. Some of
these summaries note values for ecosystem goods and services including tourism
and recreation, fisheries, coastal protection, biodiversity, and carbon sequestration that are presented in Section 2.
Global Values
By one estimate, the total net benefit per year of the world’s coral reefs
is $29.8 billion. Tourism and recreation account for $9.6 billion of this
amount, coastal protection for $9.0 billion, fisheries for $5.7 billion, and
biodiversity for $5.5 billion (Cesar, Burke and Pet-Soede, 2003).
A 2006 meta-analysis of wetlands valuation studies around the world
found that the average annual value is just over $2,800 per hectare
(Brander, Florax and Vermaat, 2006).
A 2007 study found that the total value of ecosystem services and products provided by the world’s coastal ecosystems, including natural (terrestrial and aquatic) and human-transformed ecosystems, added up to
$25,783 billion per year (Martinez et al., 2007).
Regional Values
Southeast Asia
The total potential sustainable annual economic net benefits per km² of
healthy coral reef in Southeast Asia is estimated to range from $23,100 to
$270,000 arising from fisheries, shoreline protection, tourism, recreation,
and aesthetic value (Burke, Selig and Spalding, 2002).
Caribbean
The annual net benefits provided by coral reefs through fisheries, dive
tourism, and shoreline protection services were between $3.1 billion and
$4.6 billion in 2000. The net benefits from dive tourism were the largest
share of this total, at $2.1 billion, followed by shoreline protection services at $700 million to $2.2 billion, and fisheries at $300 million (Burke
and Maidens, 2004).
Economic Values of Coral Reefs, Mangroves, and Seagrasses: A Global Compilation 2008
1
Section 1: Global, Regional, and Site-Specific Values
Site-Specific Values
Citations are listed alphabetically by country.
Atlantic Ocean
The incremental benefits of the coral reefs and mangroves in Jamaica’s Portland Bight Protected Area (PBPA) were estimated to be $52.6 million in
present value terms for an optimistic tourism scenario, and $40.8 million
in a pessimistic tourism case, calculated over a 25-year period and at a
10% discount rate. Fisheries accounted for about $19.0 million of the
net present value, tourism for about $11.0 million, carbon sequestration
for $4.0 million, coastal protection for $366,000, and biodiversity for
$18.0 million. The incremental costs of the PBPA estimated in net present values terms amounted to $19.2 million (Cesar et al., 2000).
The net present value of Jamaica’s Montego Bay reefs is approximately
$400.0 million, with tourism and recreation, fisheries, and coastal protection accounting for $315.0 million, $1.3 million and $65.0 million,
respectively. The biodiversity of Montego Bay reefs has a net present value
of $13.6 million to tourists and $6.0 million to Jamaica residents (Ruitenbeek and Cartier, 1999).
The coral reefs in Jamaica’s Montego Bay Marine Park were valued for
tourism, fisheries, and coastal protection. The Net Present Value (NPV)
in 1996 associated with tourism ranged from $210.0 million (using a
15% discount rate) to $630.0 million (using a 5% discount rate). The
NPV in constant 1996 dollars associated with fishing ranged from
$1.7 million to $7.5 million. The NPV of the total amount (250 acres)
of land at risk of erosion was estimated to be $65.0 million (in constant
1996 dollars) (Gustavson, 1998).
A 2005 report found that coral reefs make a valuable contribution to
the Turks and Caicos Islands, estimated at $47.3 million a year. Tourism and diving accounted for $18.2 million per year, fisheries $3.7 million per year, coastal protection $16.9 million per year, and biodiversity
$4.7 million per year. Of this total, $17.7 million a year fed directly into
the GDP, constituting 7.8% of the annual GDP for this small country
(Carleton and Lawrence, 2005).
Indian Ocean
In 2002, a study evaluated the Total Economic Value (TEV) of the mangroves in Egypt, finding that it could be as high as $182,000 per year
2
To view or contribute additional case studies, go to www.consvalmap.org
Section 1: Global, Regional, and Site-Specific Values
($91,000/ha/yr) at Ras Mohammed Park and as high as $1.3 million per
year ($24,000/ha/yr) at Nabq Protected Area (Spurgeon, 2004).
Using a dynamic simulation model, a study analyzed the Total Economic
Value (TEV) of the Leuser National Park, Indonesia, from 2000–2030.
With a 4% discount rate, the accumulated TEV for the ecosystem over
the 30-year period was $7.0 billion under the ‘deforestation scenario’,
$9.5 billion under the ‘conservation scenario’, and $9.1 billion under the
‘selective utilization scenario’. Water supply, flood prevention, tourism and
agriculture contributed the most in the conservation and selective utilization scenarios (Van Beukering, Cesar and Janssen, 2003).
A 2005 Total Economic Value (TEV) assessment of the Rekawa mangrovelagoon ecosystem, Sri Lanka, found that it was $1,088/ha/year, or $217,600
per year, based on 200-ha of mangrove. Forestry net benefits accounted for
$4,800 per year, lagoon fishery $53,600 per year, coastal fishery $98,600
per year, erosion control and buffer against damage from storms $60,000
per year, and existence, bequest and option values to local communities
$520 per year (Gunawardena and Rowan, 2005).
In 1998, a study estimated the value of Sri Lanka’s coral reefs to be between
$140,000 and $7.5 million per km² over a period of 20 years (Berg et al.,
1998).
A 2003 study estimated the monetary benefits of wetlands in Muthurajawela,
Sri Lanka, finding an economic value of $8.1 million a year, or $2,700 per
hectare. Flood attenuation accounted for $5.4 million; industrial wastewater
treatment $1.8 million, support to downstream fisheries $220,000, firewood
$88,000, fishing $70,000, leisure and recreation $60,000, domestic sewage
treatment $48,000, freshwater supplies for local populations $42,000, and
carbon sequestration $8,700. As is typical for urban wetlands, ecosystem services contributed most (90%) of this value, followed by fisheries (36% of
total resource use values) (Emerton and Kekulandala, 2003).
A 1998 study found that converting the Surat Thani mangrove system
in the south of Thailand to aquaculture did not make economic sense
once external costs were included. The value of the original mangrove
cover — from timber, charcoal, non-timber forest products, offshore
fisheries, and storm protection — fell to almost zero following conversion. Summing all measured goods and services, the total economic value of intact mangroves was 3.6 times as high as that of shrimp farming
Economic Values of Coral Reefs, Mangroves, and Seagrasses: A Global Compilation 2008
3
Section 1: Global, Regional, and Site-Specific Values
($60,400 compared to $16,700 Net Present Value, using a 6% discount
rate over 30 years (Sathirathai, 1998 cited in Barbier, 2000).
Contingent valuation was used to estimate utility values associated with
coral reef biodiversity at Phi Phi, Thailand. The mean Willingness To
Pay (WTP) per visit was estimated at $7.17 for domestic visitors and
$7.15 for international visitors, or $147,000 a year for domestic visitors
and $1.2 million a year for international visitors. The study also calculated
the mean WTP of vicarious domestic users at $15.85. The total value of
the reefs was estimated to be $497.4 million per year, or $15,118 per hectare per year (Seenprachawong, 2004).
Pacific Ocean
The total value-added economic contribution of tourism, commercial
fishing, and cultural and recreational activity to Australia’s Great Barrier Reef Catchment Area was estimated at $3.7 billion per year (Access
Economics, 2007).
The annual values of coral reefs of American Samoa were estimated at
$5.1 million per year, and the Territory’s mangroves at $750,000 per year.
The added values account for 1.2% of the American Samoa GDP. A few
of the most important benefits provided by coral reefs and mangroves
included $755,000 per year from fisheries, $73,000 per year benefit resulting from recreational uses, $70,000 per year from bottom fishing,
and $582,000 per year from benefits relating to shoreline protection
(JacobsGIBB Ltd., 2004).
An economic analysis of Ream National Park, Cambodia (2000) surveyed households in local communities, looking at social, economic and
ecological data, and the costs and benefits of three protected area management scenarios: (1) some protection is achieved, but fisheries eventually collapse; (2) the “ghost park” scenario, in which all timber and
fish are harvested, destroying the area; and (3) the “dream park” scenario
that allows subsistence activities, recreation, education and research. At
a 10% discount rate, the dream park had the highest net present value
($11.9 million). This compared with $10.0 million for the ghost park
and $9.8 million for partial protection scenario. The dream park scenario had the highest Net Present Value, exceeding the ghost park by
nearly $2.0 million. However, protection scenarios allocated the bulk
of the Park’s benefits to local communities. The dream park conferred
three times more benefit value to villagers compared with the ghost
park; $2,729 per household versus $919 per household. The dream park
4
To view or contribute additional case studies, go to www.consvalmap.org
Section 1: Global, Regional, and Site-Specific Values
scenario confered a present value (before costs) of $12.6 million to local
communities, compared with $7.3 million for the partially protected park,
and $4.3 million for the ghost park. The Present Value (10%, 20 years)
of fisheries for the partially protected park was $5.2 million; for the ghost
park it was $3.6 million; for the dream park it was $7.9 million; and for
recreation it was $21,390 to $699,636 (De Lopez, 2003).
The average yearly household value of the Veun Sean wetland, Cambodia was $3,200 in 2005, with $425 per household per year in fisheries
value, or $650 per year to poorer households from income earned from
selling fish, mainly used to purchase the food staple, rice (De Groot et
al., 2006).
The Total Economic Value (TEV) of the reefs of Commonwealth of
the Northern Mariana Islands was estimated at $61.2 million per year.
The market values comprised 73% of the TEV, and the non-values comprised the rest. Tourism accounted for $42.3 million per year, fisheries for
$1.3 million per year, coastal protection for $8.0 million per year, and
diving and snorkeling $5.8 million per year (Van Beukering, 2006).
In 2007, the Total Economic Value for Guam’s reefs was estimated at
$127.3 million per year, with tourism accounting for approximately
75% of this value ($94.6 million per year), diving and snorkeling for
$8.7 million per year, fisheries for $4.0 million per year, biodiversity for
$2.0 million per year, and coastal protection for $8.4 million per year
(Van Beukering et al., 2007).
The average annual value of the coral reef ecosystems of the main
Hawai’ian Islands (Hawai’i, Maui, Oahu, Kauai, and Molokai) has been
found to amount to $364.0 million. This leads to a Net Present Value of
nearly $10.0 billion calculated over 50 years with a discount rate of 3%
(Cesar and Van Beukering, 2004).
Potential sustainable economic net benefits per year from coral reefs in
Indonesia — from fisheries, shoreline protection, tourism, and aesthetic
value — have been estimated at $1.6 billion per year (Burke, Selig and
Spalding, 2002).
The Total Economic Value of coral reefs in Indonesia’s Wakatobi National Park in Southeast Sulawesi was estimated to be $308,000 or $12,100/
km². The Net Present Value over 20 years with a 10% discount rate is estimated at $2.6 million. Fisheries produced an average of $10,340 per km²
Economic Values of Coral Reefs, Mangroves, and Seagrasses: A Global Compilation 2008
5
Section 1: Global, Regional, and Site-Specific Values
annually and had a present value (PV) of over $2.2 million, calculated
over 20 years with a 10% discount rate. Eco-tourist revenues provided
almost $1,320 per km² in 2004 and an expected PV of $286,000. The
indirect benefit of coastal protection was estimated to be worth $1,320
annually or $473/km² (Hargreaves-Allen, 2004).
The quantifiable net benefits of managing Taka Bone Rate Marine
Protected Area (MPA), Indonesia, as a protected area were estimated
to be between $3.5 and $5.0 million in Net Present Value terms, at a
10% discount rate over 25 years. The creation of MPAs allowed fish
stocks and yields to recover, and stopped destructive fishing practices
(Cesar, 2002).
A 2002 study analyzed the costs and benefits of coral mining in Lombok,
Indonesia, looking at the societal costs of coral mining associated with
losses to typical reef function. The economic valuation presented two
scenarios, one with limited tourism potential and little coastal construction (scenario ‘LOW’), and the other with high tourism potential and
coastal infrastructure (scenario ‘HIGH’). All costs were calculated in Net
Present Value terms for a 30-year time horizon. Combining the net profits from mining with the societal costs, the economic loss of mining to
society was found to be $33,000 per km² for a ‘LOW’ value scenario, and
$762,000 per km² in the ‘HIGH’ scenario. For both scenarios, therefore,
coral mining constituted a significant, long-term loss to society. The net
loss of the fishery function was valued at $74,900 in both scenarios; loss
of the tourism $2,900 for the ‘LOW’ scenario and $481,900 for the
‘HIGH’ scenario; and loss of coastal protection $12,000 for the ‘LOW’
scenario and $260,000 for the ‘HIGH’ scenario (Cesar, 2002).
The coral reefs, seagrass, mangroves, beaches, intertidal areas, and marine
waters of the Bohol Marine Triangle (BMT) in the Philippines provide
ecosystem goods and services from fisheries, gleaning, seaweed farming,
tourism, research, and education. Over a 10-year period and using a
10% discount rate, the BMT provided $11.5 million in total net benefits.
Tourism and the municipal fisheries accounted for 44% and 39% of the
total net benefits. Coral reefs provided $1.3 million in annual revenues,
beach and intertidal area provided $1.1 million, marine waters $646,501,
mangroves $239,561, and seagrass $105,990 (Samonte-Tan et al., 2007).
The Net Present Value (NPV) of benefits of coral reefs in the South China
Sea basin in the Philippines was estimated to be Philippine pesos (PhP)
24,700 million, or $449 million, calculated over 20 years with a discount
6
To view or contribute additional case studies, go to www.consvalmap.org
Section 1: Global, Regional, and Site-Specific Values
rate of 10%. This NPV translated into approximately PhP 5.3 million per
km², or $266,112 per km² per year (Samonte-Tan and Armedilla, 2004).
The potential sustainable economic net benefits per year from coral reefs
in the Philippines was estimated at $1.1 billion, arising from fisheries,
shoreline protection, tourism, and aesthetic value (Burke, Selig and Spalding, 2002).
Based on a pilot survey of divers’ Willingness To Pay to enter marine
parks in the Philippines, annual potential revenues were found to range
from $850,000 to $1.0 million on Mactan Island, from $95,000 to
$116,000 in Anilao, and from $3,500 to $5,300 on Alona Beach (Arin
and Kramer, 2002).
Coral reefs, seagrass, mangroves, and mudflats around Olango Island
in the Philippines provide goods and services from fisheries, seaweed
farming, bird habitat, tourism (SCUBA diving and snorkeling), and
wood harvest. Annual net revenue was estimated to be $38,300 to
$63,400 per km², or $1.5 to $2.5 million for the entire 40 km² reef area.
Another $389,000 was added when wetlands were considered. The costs
of managing Olango Island coral reefs and wetland habitats for improved
net revenues and conservation would amount to less than $100,000 per
year (White, Ross and Flores, 2000).
The 27,000 km² of Philippines coral reefs, in their current degraded condition, contribute at least $1.4 billion to the economy each year. In the
Apo Island case study, an investment of $75,000 to protect 1 km² of coral
reefs was found to return between $31,900 and $113,000 annually in
increased fish production and local dive tourism (White, Vogt and Arin,
2000).
In Hon Mun Marine Protected Area in Vietnam, the total value-added
from the support function of coral reefs was estimated at $2 million for
the local fishing and aquaculture industries. Total recreational benefits
from the reef-related recreation industry was estimated at $4.2 million.
Domestic visitors’ Willingness To Pay (WTP) per visit was $3.10 and
that for international visitors’ was $3.90. Given visitation patterns, the
total conservation value of Hon Mun’s coral reefs was estimated to be
approximately $128,245 for domestic visitors and $114,945 for foreign
visitors (Khan Nam et al., 2005).
Economic Values of Coral Reefs, Mangroves, and Seagrasses: A Global Compilation 2008
7
Section 2: Ecosystem Goods and Services Values
This section presents values for tourism and recreation, fisheries, coastal protection, biodiversity, and carbon sequestration.
Tourism and Recreation
Global
By one account, tourism and recreation account for $9.6 billion of the
total $29.8 billion global net benefit of coral reefs (Cesar, Burke and
Pet-Soede, 2003).
In 2007, a study estimated that the average global value of coral reef recreation is $184 per visit, in 2000 prices (Brander, Van Beukering and
Cesar, 2007).
Atlantic Ocean
Coral reefs, mangroves and seagrasses help to provide safe nesting grounds
for endangered marine turtle species. Turtle tourism in Barbados, started
in 2003 as an “add-on” activity for tourists. That year 1,400 visitors with
an average $20–$100 spending per visitor generated $108,000 to dive
operators, tour guides, the Barbados Sea Turtle Project, and local business
owners (Troëng and Drews, 2004).
In 2004, a study found that Brazil’s marine turtle conservation program
(TAMAR Project) value increased 30% annually from 1998–2002, and
was a major income source for local communities, generating $2.6 million in 2001 from sales of turtle t-shirts, hats, etc. (Troëng and Drews,
2004).
In 2003, 300 visitors to Cape Verde chose to see nesting loggerhead
turtles as one of many activities, with an average spending of $11.50.
Estimated gross revenue from this activity was $3,451 annually from
1998 to 2003; a small but locally-important sustainable source of income
(Troëng and Drews, 2004).
In the Caribbean, the annual net benefits provided by coral reefs from
dive tourism were estimated to be $2.1 billion in 2000 (Burke and Maidens, 2004).
8
To view or contribute additional case studies, go to www.consvalmap.org
Section 2: Ecosystem Goods and Services Values
An estimated (2003) 15 million dives take place near Florida, USA,
each year, half of them inside Marine Protected Areas (MPAs). Only
25% of MPAs with coral reefs charge divers an entry or user fee, usually
$2–$3 levied per dive or per diver. The revenue generated by these fees
is estimated at $1.0 to $2.0 million annually. Protected area agencies in
the Caribbean have an average financial shortfall of $30 per hectare. This
survey suggested that 3.75 million divers visited the region annually, and
if user fees of $25 per person were collected, this would raise $93.0 million, or 78% of the $120.0 million shortfall. While oversimplistic, the
study demonstrated that major contributions to MPA management in
the Caribbean could be made by properly pricing and collecting user fees
(Green and Donnelly, 2003).
Tourism to see green turtle nesting in Tortuguero National Park, Costa
Rica, was found to have an estimated gross revenue of $6.7 million locally.
Tourism visitation increased at a rate of 16% per year between 1988 and
2002. In 2002, 50,339 visitors, with an estimated spending of $255 per
visitor, entered the park, and turtle nesting had increased by 417% since
1971 (Troëng and Drews, 2004).
Tourism accounted for about $11.0 million out of the optimistic
$52.6 million Net Present Value of the incremental benefits of the coral
reefs and mangroves in Jamaica’s Portland Bight Protected Area. The net
present value was calculated over a 25-year period and at a 10% discount
rate (Cesar et al., 2000).
Tourism accounted for $315.0 million of the approximately $400.0 million Net Present Value of Jamaica’s Montego Bay reefs (Ruitenbeek and
Cartier, 1999).
In a 1998 study, the coral reefs in Jamaica’s Montego Bay Marine Park
were valued for tourism, fisheries, and coastal protection. In 1996, the
net present value associated with tourism ranged from $210.0 million
(using a 15% discount rate) to $630.0 million (using a 5% discount rate)
(Gustavson, 1998).
The total annual Consumer Surplus (CS) benefits of cruise ship and air
travelers to Jamaica’s Montego Bay National Park were estimated at
$189.0 and $993.0 million, respectively. The adjusted CS per person is
estimated at $586 and the CS per person per trip was $739. The benefit
or economic utility that they experience is above and beyond the amount
that tourists spend to get to Montego Bay (Reid-Grant and Bhat, 2008).
Economic Values of Coral Reefs, Mangroves, and Seagrasses: A Global Compilation 2008
9
Section 2: Ecosystem Goods and Services Values
In an experiment used to value visibility, percent coral cover, and diversity of species in the Netherlands Antilles’ Bonaire National Marine
Park, researchers found that a decline in quality from the current level
to ‘good’ gave an average per person loss of about $45. The decline to
‘medium-quality’ was about $142 per person and to ‘poor-quality’ was
about $192 per person. Using a discount rate of 3% and assuming a
population of users that is steady around 28,000, the corresponding total
asset value of the loss at each level was about $42.0 million, $132.0 million, and $179.0 million. If the number of divers grew at 2% annually,
these asset values would jump to $126.0 million, $398.0 million, and
$538.0 million (Parsons and Thur, 2007).
The net economic value of dive tourism in the Netherlands Antilles’ Bonaire Marine Park was estimated to be approximately $19.0 million annually. Over a twenty-year period and at a discount rate of 10%, the net
present value (in 1993) of benefits to dive tourists was calculated to be
$180.0 million. In 1991, the net annual benefits of dive-related tourism
were approximately $7.0 million to $8.0 million. The net present value
(in 1993) of local net expenditures by tourists would be $74.0 million
(Pendleton, 1995).
Direct spending by coral reef-associated tourists contributed an estimated $91.6 million to the economy of St. Lucia in 2006 — approximately
11% of the GDP. Additional indirect economic impacts from coral-reef
associated tourism totaled an estimated $68–$102 million for the same
year (Burke et al., 2008).
The Matura Protected Area coastline in Trinidad and Tobago has the
third largest leatherback nesting population in the world. In 2001, a total
of 10,693 visitors paid to participate in marine turtle tours. Spending
per visitor was estimated to be between $21 and $390, and the estimated
gross revenue for 2001 was $559,014 (Troëng and Drews, 2004).
Diving on coral reefs in the Turks and Caicos Islands was worth an estimated $8.3 million per year in 2005 ($7.5 million per year in Gross Value
Added and $0.9 million per year consumer surplus). Reefs also support
other forms of tourism, worth at least $9.8 million per year ($6.2 million
per year in Gross Value Added and $3.7 million per year consumer surplus) (Carleton and Lawrence, 2005).
A 2001 study estimated the recreational value of Buccoo Reef Marine
Park in Tobago, West Indies. Benefits derived from total annual visitor
10
To view or contribute additional case studies, go to www.consvalmap.org
Section 2: Ecosystem Goods and Services Values
expenditure in estimates of Net Present Value (NPV) ranged from $9.1
to $18.7 million over a 10-year period for different scenarios. Recreational user benefits were estimated as the total Willingness To Pay of
visitors to southwest Tobago, both users and non-users of the park. The
mean Willingness To Pay by all respondents, including those not willing
to pay, ranged from $3.70 to $9.30. The resulting estimates showed an
equivalent surplus of $600,000 to $2.5 million in NPV depending on
the resulting environmental quality implied by the scenarios (Brown et
al., 2001).
Direct spending by coral reef-associated tourists contributed an estimated $43.5 million to the economy of Tobago, West Indies in
2006 — approximately 15% of GDP. Additional indirect economic impacts, driven by the need for goods to support tourism (such as boats,
towels and beverages) contributed another $58–$86 million to the national economy of Trinidad and Tobago (Burke et al., 2008).
Over a five-year study period, an average visitor made an estimated
6.31 trips to the Florida Keys, USA, for the purposes of diving, snorkeling or glass-bottom-boat viewing. The per trip user value was estimated to be $463. However, it was estimated that the establishment of
a marine reserve would lead to improvements of 200% in fish abundance, 100% in water visibility, and 100% in coral quality; 4.99, 3.88
and 2.70 more trips by the average visitor, respectively (Bhat, 2003).
In 2007, tourism to Morrocoy National Park on the west coast of Venezuela averaged 1.5 million visitors annually; up from 1.15 million visitors in 2001, when a study found that each visitor spent $135, generating $22.4 million that year (Cartaya, 2007 cited in Pabon-Zamora et al.,
2008).
Indian Ocean
In Israel’s Eilat Coral Beach Nature Reserve divers are willing to pay an
extra 11.86 New Israeli Shekels (NIS) ($2.60) per dive over the current
diving fee of 20 NIS, for each additional unit increase in a biological
index that comprises coral and fish abundance and genus richness. They
would also pay an extra 5.46 NIS ($1.20) per dive for an additional meter
of visibility. Environmental improvements that would lead to attribute
levels similar to those on the higher quality Sinai reefs were valued at
13.2 million NIS ($2.3 million) per year (Wielgus et al., 2003).
Economic Values of Coral Reefs, Mangroves, and Seagrasses: A Global Compilation 2008
11
Section 2: Ecosystem Goods and Services Values
The average Willingness To Pay for coral reef conservation and tourism
(beach going, snorkeling, SCUBA diving, glass-bottom-boat rides) in the
Seychelles’ Marine National Parks was $12.20 (61 Rupees) in 2000. This
exceeds the $10.00 (R50) marine park entrance fee instituted in 1997.
Given that 40,000 tourists visited the parks in 1997, total consumer surplus was estimated to be $88,000 (440,000 Rupees) (Mathieu, Langford
and Kenyon, 2000).
A 2003 study estimated the economic value of wetland benefits of Muthurajawela, Sri Lanka, finding that the wetland had a high direct and
indirect economic value of $8.1 million a year, or $2,700 per hectare.
Leisure and recreation accounted for $60,000 per year (Emerton and
Kekulandala, 2003).
In the mid-1990s, coastal tourism contributed about $20.0 million per
year to the national economy of Sri Lanka (Berg et al., 1998).
Pacific Ocean
The recreational use value of Australia’s Great Barrier Reef ranges from
$700.0 million to $1.6 billion per year (Carr and Mendelsohn, 2003).
In 2004, the annual values of coral reefs of American Samoa were estimated at $5.1 million per year, and the Territory’s mangroves at $750,000 per
year; $73,000 per year resulted from recreational uses (JacobsGIBB Ltd.,
2004).
An economic analysis of Ream National Park, Cambodia (2000), surveyed households in local communities, looking at social, economic and
ecological data, and the costs and benefits of three protected area management scenarios: (1) some protection is achieved, but fisheries eventually
collapse; (2) the “ghost park” scenario, where all timber and fish are harvested, destroying the area; and (3) the “dream park” scenario, allowing
subsistence activities, recreation, education and research. Present value
(10%, 20 years) of fisheries for partially protected park, $5,207,267; ghost
park $3,576,067; dream park $7,867,328; and for recreation $21,390 to
$699,636 (De Lopez 2003).
In 2006, the Total Economic Value (TEV) of the reefs of the Commonwealth of the Northern Mariana Islands was estimated at $61.2 million per year. The market values comprised 73% of the TEV, and the
non-market values comprised the rest. Tourism accounted for $42.3 mil12
To view or contribute additional case studies, go to www.consvalmap.org
Section 2: Ecosystem Goods and Services Values
lion per year, and diving and snorkeling for $5.8 millon per year (Van
Beukering, 2006).
Ostional Wildlife Refuge in Costa Rica is one of the world’s largest marine olive ridley turtle nesting areas. It has high community participation and equitable profit-sharing from the legal sale of turtle eggs. In
2001, 208 residents collected 4,137,000 olive ridley eggs with a revenue
of $1.0 million benefiting villagers, intermediaries and market salesmen
(Troëng and Drews, 2004).
From 1998 to 2000, it was estimated that key biodiversity marine areas,
including coral reefs and mangroves in the Galapagos, Ecuador, were
worth over $2.7 million annually due to tourism (non-use value), compared to $220,000 benefits received by local fishermen, whose actions
can negatively affect tourism (Wilen et al., 2000).
In 2007, the total economic value of Guam’s reefs was estimated at
$127.3 million per year, with tourism accounting for approximately 75%
($94.6 million per year) and diving and snorkeling for $8.7 million per
year (Van Beukering et al., 2007).
A 2001 study in Hanauma Bay, Hawai’i, showed that visitors were
willing to pay $7.00 more for their experience than they were currently paying, and that the net benefits of the Hanauma Bay Educational
Program — set up to improve the marine awareness of visitors — were
around $100 million; greatly exceeding the cost of the program (around
$23.0 million) over time (Van Beukering and Cesar, 2004).
The Pulau Weh Marine Protected Area (MPA) on Weh Island, Indonesia,
contributed more than 60% to the regional GDP, or about $230,000 in
entrance fees per year. Residents were willing to pay $13.60 per household per year to preserve this marine park. It was also estimated that
people involved in nature-based tourism near the MPA had an annual
per capita income of $216 compared to $150 for those working in other
sectors (Iqbal, 2006 cited in Pabon-Zamora et al., 2006).
In its first year, between March and December 2001, 15,055 visitors,
including 5,183 foreigners, visited Bunaken National Park, Indonesia,
paying $42,000 in entry fees. In 2002, the entrance fee was doubled,
and $110,000 was collected from 25,697 visitors (Emerton, Bishop and
Thomas, 2005).
Economic Values of Coral Reefs, Mangroves, and Seagrasses: A Global Compilation 2008
13
Section 2: Ecosystem Goods and Services Values
A 2002 study analyzed the costs and benefits of coral mining in Lombok,
Indonesia, looking at the societal costs of this activity associated with
losses to typical reef functions. The economic valuation presented two
scenarios: one with limited tourism potential and little coastal construction (scenario ‘LOW’), and the other with high tourism potential and
considerable coastal infrastructure (scenario ‘HIGH’). All costs were calculated in net present value terms (the discounted sum of annual costs)
for a 30-year time horizon. The net loss of the tourism function was
valued at $2,900 for the ‘LOW’ scenario and $481,900 for the ‘HIGH’
scenario (Cesar, 2002).
Eco-tourist revenues generated by the coral reefs in Indonesia’s Wakatobi National Park in Southeast Sulawesi provided almost $1,320 per km²
in 2004 and an expected present value of $286,000 (Hargreaves-Allen,
2004).
The Willingness To Pay (WTP) to access the Pulau Payar Marine Park,
Malaysia, was elicited in 1998. The study found that 91% of respondents would accept an entrance fee. The average WTP was estimated at
$4.20. In terms of the tourist numbers recorded during the year of the
study, this estimate reflected a potential recreational value of the reefs in
the park of $390,000 per year (Yeo, 2004).
A study estimated that the economic value of recreational resources of
Pulau Redang Marine Park, Malaysia, based on willingness to pay per
visit responses, ranged from $3.00 to $4.40. If collected, this would have
contributed between $373,900 and $545,100 in park management funds
in 2005 (Mohd Parid, Lim and Woon, 2005).
A 2007 contingent valuation study found that ecotourism to see whale
sharks in the Bahia de los Ángeles, Mexico, could be an important source
of income (between $78,030 and $111,843 per year) for the 700 residents
living around the bay (Low-Pfeng, de la Cuera and Enríquez, 2005).
Tourism accounted for 44% of the total net benefits of the $11.5 million
provided by the Bohol Marine Triangle in the Philippines (Samonte-Tan
et al., 2007).
Using the travel cost method, a study evaluated recreational benefits
of coral reefs along the Lingayen Gulf, Bolinao, Philippines. Empirical results generated consumer surplus valued at (Philippine peso)
PhP10,463 ($223) per person per annum or potential net annual revenues
14
To view or contribute additional case studies, go to www.consvalmap.org
Section 2: Ecosystem Goods and Services Values
to the local economy worth PhP220.2 million ($4.7 million) from an estimated 21,042 visitors to Bolinao in 2000 (Ahmed et al., 2007).
A 2005 study in the Hon Mun Marine Protected Area in Vietnam estimated that total recreational benefits from the reef-related recreation
industry was $4.2 million. Domestic visitors’ Willingness To Pay (WTP)
per visit was $3.10 and international visitors’ WTP was $3.90. Given visitation patterns, the total annual conservation value of Hon Mun’s coral
reefs was estimated to be approximately $128,245 for domestic visitors
and $114,945 for foreign visitors (Khan Nam et al., 2005).
Fisheries
Global
By one estimate, fisheries account for $5.7 billion of the total $29.8 billion global net benefit of coral reefs per year (Cesar, Burke and Pet-Soede,
2003).
In the Millennium Ecosystem Assessment, the market value of seafood
from mangroves has been put at $7,500 to $167,500/km²/year (Millennium Ecosystem Assessment, 2005 cited in UNEP-WCMC, 2006).
In 1997, annual commercial fish harvests from mangroves were valued
$6,200 per km² in the United States to $60,000 per km² in Indonesia
(Bann, 1997).
Atlantic Ocean
Reef fisheries of the Meso-American Barrier Reef of Belize, Honduras and Mexico are potentially worth $15,000–$150,000 per km²
a year, based on catch values of $1.00–$10.00 per kg (Talbot and
Wilkinson, 2001 cited in UNEP-WCMC, 2006).
In the Caribbean, the annual net benefits provided by coral reefs in terms
of fisheries were estimated to be about $300.0 million (Burke and Maidens, 2004).
Fisheries accounted for about $19.0 million of the Net Present Value
of the $40.8 million to $52.6 million in incremental benefits of the
coral reefs and mangroves in Jamaica’s Portland Bight Protected Area.
The Net Present Values were calculated over a 25-year period and at a
10% discount rate (Cesar et al., 2000).
Economic Values of Coral Reefs, Mangroves, and Seagrasses: A Global Compilation 2008
15
All values in this booklet are located at www.co
1
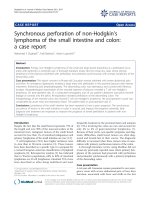
Caribbean
In 2000, coral reefs in the Caribbean region provided annual
net benefits in terms of fisheries, dive tourism, and shoreline protection services with an estimated value of $3.1 billion
to $4.6 billion. The net benefits from dive tourism were
the largest share of this total ($2.1 billion), followed
by shoreline protection services ($0.7 to 2.2 billion),
and fisheries (about $300
million).
Burke, L. and Maidens, J. 2004. Reefs
at Risk in the Caribbean. World Resources Institute, Washington, DC.
Bonaire Marine
Park, Antilles
2
The net economic value
to visitors (measured as
consumer surplus) to the
Bonaire Marine Park (from
May 1993 to May 1994)
was estimated to be approximately $19 million
annually. Over a twenty
year period, the net present value of benefits to tourists would be $180 million (assuming
1993 levels of consumer surplus).
Pendleton, L.H. 1995. Valuing Coral Reef Protection. Ocean & Coastal Management,
26(2): 119–131.
16
1
2
onsvalmap.org, which is continuously updated.
3
Red Sea
The marginal prices for coral and fish diversity and water visibility
in the Coral Beach Nature Reserve near Eilat, Israel, were estimated to be $2.60 and $1.20
per dive, respectively. From
the standpoint of recreational diving welfare, the
annual social costs of activities contributing to coral
reef degradation are approximately $2.86 million.
Wielgus, J., Chadwick-Furman, N.E.,
Zeitouni, N., and Shechter, M. 2003.
Effects of Coral Reef Attribute Damage on Recreational Welfare. Marine
Resource Economics, 18: 225–237.
3
4
Bohol Marine
Triangle, Philippines
4
With 10% discount rate,
the total accumulated net
benefits for the Bohol Marine Triangle resources in
the Central Visayas of the
Philippine
archipelago,
over a 10-year period was
found to be $11.54 million.
Tourism and the municipal
fisheries accounted for 44% and 39% of the total net benefits,
respectively. Annual revenues attributed to coral reefs were $1.26
million.
Samonte-Tan, G.P.B., White, A.T., Tercero, M.A., Diviva, J., Tabara, E. and Caballes, C.
2007. Economic Valuation of Coastal and Marine Resources: Bohol Marine Triangle, Philippines. Coastal Management 35(2): 319–333.
17
Section 2: Ecosystem Goods and Services Values
Fisheries accounted for $1.3 million of the $400.0 million Net Present
Value of Jamaica’s Montego Bay reefs (Ruitenbeek and Cartier, 1999).
The Net Present Value (in constant 1996 dollars) of coral reefs in Jamaica’s Montego Bay Marine Park associated with fishing was found to
range from $1.7 million to $7.5 million (Gustavson, 1998).
Coral reef fisheries in the Turks and Caicos Islands have been valued
at $3.7 million per year in Gross Value Added (Carleton and Lawrence,
2005).
Indian Ocean
In 2001, coastal fisheries and aquaculture in and around Leuser, Indonesia, exceeded $171.0 million. The average share of the fishery sector dependent on Leuser was estimated at 2% for the maritime fishery; 9% for
brackish water fishery; and 100% for brackish and freshwater aquaculture (Van Beukering, Cesar and Janssen, 2003).
A 2005 Total Economic Value assessment (TEV) of the Rekawa mangrove-lagoon ecosystem, Sri Lanka, showed that it was $1,088/ha/year, or
$217,600 per year, based on 200-ha of mangrove. Lagoon fishery accounted for $268/ha/year or $53,600 per year, and coastal fishery for $493/ha/
year or $98,600 per year. TEV for fisheries was $152,200 per year (Gunawardena and Rowan, 2005).
A 2003 study estimated the monetary worth of wetland benefits of Muthurajawela, Sri Lanka, finding that it has a high direct and indirect economic value of $8.1 million a year, or $2,700 per hectare. Support to
downstream fisheries accounted for $220,000 per year and fishing for
$70,000 per year (Emerton and Kekulandala, 2003).
Pacific Ocean
In 2004, the annual values of coral reefs of American Samoa were
estimated at $5.1 million per year, and the Territory’s mangroves at
$750,000 per year: $755,000 per year from fisheries and $70,000 per
year from bottom fishing (JacobsGIBB Ltd., 2004).
The average household value from fisheries of the Veun Sean wetland,
Cambodia, was $425 per year of a total wetland value of about $3,200/
household/year. Fisheries are worth about $650 per year to poorer households from income earned from selling fish, and mainly used to purchase
the food staple, rice (De Groot, 2006).
18
To view or contribute additional case studies, go to www.consvalmap.org
Section 2: Ecosystem Goods and Services Values
An economic analysis of Ream National Park, Cambodia in 2000 surveyed households in local communities, looking at social, economic and
ecological data, and the costs and benefits of three protected area management scenarios: (1) some protection is achieved, but fisheries eventually
collapse; (2) the “ghost park” scenario, where all timber and fish are harvested, destroying the area; and (3) the “dream park” scenario, allowing
subsistence activities, recreation, education and research. Present value
(10%, 20 years) of fisheries: some protection $5.2 million; ghost park
$3.6 million; dream park $7.9 million (De Lopez, 2003).
The Total Economic Value (TEV) of the reefs of the Commonwealth
of the Northern Mariana Islands was estimated at $61.2 million per
year. The market values comprised 73% of the TEV, and the non-market
values comprised the rest. Fisheries accounted for $1.3 million per year
(Van Beukering, 2006).
The Terraba-Sierpe wetlands and fisheries in Costa Rica provided fish
and shellfish worth $6.0 million to local families (Reyes et al., 2004).
In 2007, the total economic value for Guam’s reefs was estimated at
$127.3 million per year, with fisheries accounting for approximately
$4.0 million per year (Van Beukering et al., 2007).
Fisheries supported by the coral reefs in Indonesia’s Wakatobi National
Park in Southeast Sulawesi produce an average of $10,340 per km² annually and have a present value of over $2.2 million, calculated over 20 years
with a 10% discount rate (Hargreaves-Allen, 2004).
In Matang, west Malaysia, a 2006 study estimated that with fish catches averaging 1.3–8.8 kg an hour, a 400-km² managed mangrove forest
supported a fishery worth $100.0 million a year ($250,000/km²/year)
(UNEP-WCMC, 2006).
A 2005 study found that mangroves in the Mexcaltitán Island, Mexico, protect and act as nurseries for fish and shrimp, providing residents
with direct fishing benefits of more than $1.0 million annually (Sanjurjo,
Cadena and Erbstoesser, 2005).
A 2001 study in the Gulf of Panama estimated that each kilometer of
coastline generated an estimated $95,000 in shrimp and fish annually
(Talbot and Wilkinson, 2001 cited in UNEP-WCMC, 2006).
Economic Values of Coral Reefs, Mangroves, and Seagrasses: A Global Compilation 2008
19