Waste water treatment: Equalization filtration
Bạn đang xem bản rút gọn của tài liệu. Xem và tải ngay bản đầy đủ của tài liệu tại đây (988.06 KB, 12 trang )
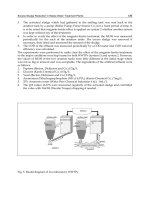
Physical Treatment Processes
Process
Purpose
Equalization
Equalize flow entering wastewater treatment plants
Equalize a pumping rate into a storage tank before
gravity supply of water.
Bar Screens
Entrance of wastewater treatment plants and some
water treatment plants
Mixing
Rapid
Slow: flocculation
Settling
Type I: Grit removal
Type II: Low density flocs removal
Type III and IV: high density flocs removal
Filtration
Removal of low levels of suspended solids.
Desalination
To remove dissolved solids.
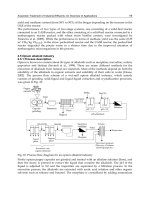
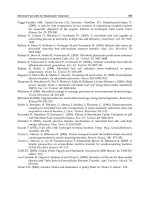
Equalization Tanks
Equalization tanks are used to dampen fluctuation in flow rates coming
into the WWTP or to pump a constant flow from a WTP
Flow, gallon per minute
1200
800
Water pumping out
of the plant
400
0
0
2
4
6
8
Flow, gallon per minute
Water Treatment Plant
1200
800
Water consumption
400
0
0
10 12 14 16 18 20 22 24
2
4
6
8
10 12 14 16 18 20 22 24
Time, hr
Time, hr
Flow, gallon per minute
1200
800
400
Wastewater generation
0
0
2
4
6
8 10 12 14 16 18 20 22 24
Time, hr
Flow, gallon per minute
Wastewater Treatment Plant
1200
800
Wastewater pumping into the
plant
400
0
0
2
4
6
8
10 12 14 16 18 20 22 24
Time, hr
In water treatment plants
ET
Raw
water
To
consumers
Water Treatment Processes
Pump
In wastewater treatment plants
PS
GC
SS
Cl
ET
BS
AT
Pump
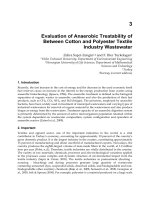
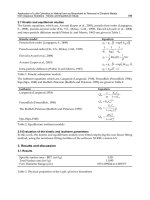
Tank Capacity-Spreadsheet Method
Example
Consider the data shown for the
hourly consumption of water in a
typical city. Determine the volume
of the equalization tank using the
. spreadsheet method
Time
Consumption
gpm
01-02
02-03
03-04
04-05
05-06
06-07
07-08
08-09
09-10
10-11
11-12
12-13
13-14
14-15
15-16
16-17
17-18
18-19
19-20
20-21
21-22
22-23
23-24
24-01
866
866
600
634
1000
1330
1830
2570
2500
2140
2080
2170
2130
2170
2330
2300
2740
3070
3330
2670
2000
1330
1170
933
Solution
1. Find the volume
consumed during each
hour (V=Q*t where t is 60
minutes in this example).
This is column 3.
2. Find the average of the
volume consumed
(=111.9 thous gal).
3. Subtract the average
from the volume
consumed (column 4).
4. Place the positives in
one column and the
negatives in another
(column 5 and 6).
5. Sum either the positive
or the negative to obtain
the capacity (Capacity=
485.4 thous gal).
6. Add 20% for design
purposes: Design
capacity= 1.2*485.4
thous gal
Time
01-02
02-03
03-04
04-05
05-06
06-07
07-08
08-09
09-10
10-11
11-12
12-13
13-14
14-15
15-16
16-17
17-18
18-19
19-20
20-21
21-22
22-23
23-24
24-01
Consumption
Volume
consumed
Average- volume
consumed
Positive
Negative
gpm
Thous gal
thous gal
thous gal
thous gal
866
866
600
634
1000
1330
1830
2570
2500
2140
2080
2170
2130
2170
2330
2300
2740
3070
3330
2670
2000
1330
1170
933
Average
52.0
52.0
36.0
38.0
60.0
79.8
109.8
154.2
150.0
128.4
124.8
130.2
127.8
130.2
139.8
138.0
164.4
184.2
199.8
160.2
120.0
79.8
70.2
56.0
111.9
59.9
59.9
75.9
73.9
51.9
32.1
2.1
42.338.116.512.918.315.918.327.926.152.572.387.948.38.132.1
41.7
55.9
59.9
59.9
75.9
73.9
51.9
32.1
2.1
Sum
485.4
42.338.116.512.918.315.918.327.926.152.572.387.948.38.132.1
41.7
55.9
485.4-
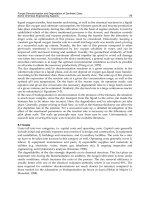
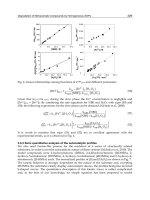
Tank Capacity-Graphical Method
Time
Consumption
Volume
consumed
Cummulative
gpm
thous gal
thous gal
The y-axis represents the
cumulative volume (column 4)
0
01-02
02-03
03-04
04-05
05-06
06-07
07-08
08-09
09-10
10-11
11-12
12-13
13-14
14-15
15-16
16-17
17-18
18-19
19-20
20-21
21-22
22-23
23-24
24-01
866
866
600
634
1000
1330
1830
2570
2500
2140
2080
2170
2130
2170
2330
2300
2740
3070
3330
2670
2000
1330
1170
933
52.0
52.0
36.0
38.0
60.0
79.8
109.8
154.2
150.0
128.4
124.8
130.2
127.8
130.2
139.8
138.0
164.4
184.2
199.8
160.2
120.0
79.8
70.2
56.0
52.0
103.9
139.9
178.0
238.0
317.8
427.6
581.8
731.8
860.2
985.0
1115.2
1243.0
1373.2
1513.0
1651.0
1815.4
1999.6
2199.4
2359.6
2479.6
2559.4
2629.6
2685.5
For design: The tank capacity is
increased by 20% over the one found
from the graph or the spreadsheet
method.
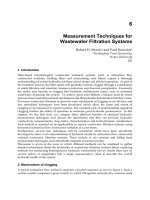
Filtration
Objective: to remove turbidity (suspended solids) from water
Turbidity of water
> 4NTU
Mixing
Flocculation
Sedimentation
Filter
Turbidity of water < 4NTU
Filter
Granular Media filter
Flow through filter = 2- 10 gpm/ft2
Dual Media filter
Anthracite (coal)
Specific gravity 1.4-1.6
Effective size 0.9-1.1 mm
Uniformity coefficient <1.7
Sand
Specific gravity 2.65
Effective size 0.45-0.55 mm
Uniformity coefficient <1.7
Coarse sand
Fine to coarse gravel
Underdrain
Example
A filter has a surface area of 15 ft by 30 ft and filters 2.5 mil gallon
every day. After 24-hr of filtering, the filter is backwashed at a rate of
15 gpm/sq ft for 12 min. Determine the average filtration rate per unit
. area and the quantity and percentage of wash water used every day
Solution
Q (2.5 ×10⁶ gal / day )(day / 24 × 60 min)
Filtration rate =
=
= 3.9 gpm / ft 2
As
15 ft × 30 ft
Quantity of washwater used daily = q × As × t
= (15 gpm / ft 2 )(15 ft × 30 ft )(12 min) = 81,000 gal
81000 gal
Percent of wash water =
× 100 = 3.2%
6
2.5 × 10