Bài tập xác suất thống kê trình độ đại học
Bạn đang xem bản rút gọn của tài liệu. Xem và tải ngay bản đầy đủ của tài liệu tại đây (485.18 KB, 15 trang )
Solution to Final Exam for MAT2377, Winter 2013
Probability and Statistics for Engineers.
Time : 3 hours
Professor : M. Zarepour
Name :
Student Number :
Calculators are permitted. It is an open book exam.
There are 4 short answer questions and 12 multiple choice questions.
Submit your answers for the multiple choice questions in the following table.
Question
1
2
3
4
5
6
Answer
Question
7
8
9
10
11
12
Answer
[12]
1. Let X be a random variable with the probability density function
f (x) = c|x|, for − 1 < x < 1
and 0 otherwise.
(a) Find the value for c.
Solution.
Since
1
−1
|x|dx = 2
1
0
xdx = 1, we have c = 1.
(b) Find P (X ≥ 0.5|X ≥ 0).
Solution.
P (X ≥ 0.5|X ≥ 0) =
=
1
xdx
0.5
1
xdx
0
=
P (X > 0.5)
P (X > 0)
3/8
= 0.75
1/2
(c) Compute P (X ≥ µ), where µ = E[X].
Solution. Since
1
0
1
x2 dx = µ = 0.
(−x2 )dx +
x|x|dx =
E(X) =
−1
−1
0
You can also see this easily without any calculations. Just notice
that f is a symmetric finction on (−1, 1) and this shows E(X) = 0.
1
1
|x|dx ==
P (X > 0) =
0
2
xdx = 0.5.
0
[10]
2. Crystalline forms of certain chemical compounds are used in various
electronic devices. It is often more desirable to have large crystals rather
than small ones. In a laboratory study, 14 crystals of the same initial
size were allowed to grow for certain periods of time. The following
data gives the weight y of the crystal (in grams) and the period x of
time (in hours) which was used for each crystal.
Time
2
4
6
8
10
12
14
Weight
0.08
1.12
4.43
4.98
4.92
7.18
5.57
Time
16
18
20
22
24
26
28
Weight
8.4
8.81
10.81
11.16
10.12
13.12
15.04
For this data, we have :
14
x¯ = 15,
14
2
(xi − x¯) = 910,
y¯ = 7.55,
i=1
(xi − x¯)(yi − y¯) = 458.12
i=1
14
(yi − y¯)2 = 244.16
i=1
The time and weight are stored in columns C1, respectively C2. Below
is the result of the linear regression analysis produced by Minitab :
Regression Analysis: C2 versus C1
The regression equation is C2 = 0.001 + 0.503 C1
Predictor
Coef
Constant
0.0014
C1
0.50343
S = 1.06177
SE Coef
0.5994
0.03520
R-Sq = 94.5%
T
0.00
14.30
P
0.998
0.000
R-Sq(adj) = 94.0%
Analysis of Variance
3
Source
Regression
Residual Error
Total
DF
1
12
13
SS
230.63
13.53
244.16
MS
230.63
1.13
F
204.58
P
0.000
Assume the linear regression model y = β0 + β1 x + ε.
(a) Find a 95% confidence interval for β1 . Conclude why the linear
regression model fits to this data set.
Solution.
We have t0.025,12 = 2.179 we have
0.50343 ± (2.179)(0.0352) = (0.4267292, 0.5801308)
is the 95% confidence interval for β1 . Since the interval does not include 0, we can not accept that β1 = 0. From the graphs, normality of
residuals are acceptable (see the linear trend in quantile-quantile plot).
(b) Write down the estimated regression line and use it to find a 95%
prediction interval for the weight in grams for a period of x = 7
Solution.
Yˆ = βˆ0 + βˆ1 x = 0.0014 + (0.50343)(7) = 3.52541.
The 95% prediction interval is
3.52541 ± (2.179)(1.06177) 1 +
1
(7 − 15)2
+
= 3.52541 ± 2.47215
14
910
(1.05195, 5.99625) ≈ (1.052, 6).
4
[12]
3. A manufacturer of sprinkler systems for fire protection in office buildings claims that the true average system-activation temperature is
130. Assume the distribution of activation temperatures is normal with
standard deviation σ = 1.5. A government regulator is interested in testing the manufacturers claim using the hypothesis H0 : µ = 130 versus
H1 : µ = 130. A random sample of n = 25 sprinklers is selected and
the activation temperature is recorded.
(a) The random sample of n = 25 specimens yielded a sample mean of
x¯ = 131.08 . Compute the p-value of the hypothesis test and provide
the conclusion with α = 0.05.
Solution.
We have
Z=
x¯ − 130
√ = 3.6.
1.5/ 25
p − value = 2P (Z > 3.6) = 0.00032.
Therefore we need to reject H0 ..
5
(b) With a significance level of α = 0.05., compute the probability of
committing a type II error if the true mean is µ = 132.
Solution.
We have
¯ ∼ N (132, 1.52 /25 = 0.09)
X
and
¯ ≤ 130 + (1.96)(1.5)/5)
β = P (130 − (1.96)(1.5)/5) ≤ X
¯ ≤ 130.588) = P
= P (129.412 ≤ X
130.588 − 132
129.412 − 132
≤Z≤
1.5/5
1.5/5
= P (−8.626667 ≤ Z ≤ −4.706667) ≈ 0.
6
(c) Suppose an auditor questions the validity of the study design and
wishes to conduct another analysis. How many measurements should
be taken to estimate the mean to within 0.5 with 95% confidence ?
n=
zα/2 σ 2
(1.96)2 (1.52 )
=
= 34.57 ≈ 35.
E2
0.52
.
7
4. For each of 18 preserved cores from oil-well carbonate reservoirs, the
amount of residual gas saturation after a solvent injection was measured
at water flood-out. Amount of satutrations are recorded as follows
26.5, 41.4, 44.5, 29.5, 37.2, 35.7, 34.0, 42.5, 33.5,
46.7, 46.9, 39.3, 45.6, 53.5, 22.0, 32.5, 36.4, 50.2.
Summary statistics on the amount of saturation (measured as pore
volume) were computed from minitab as follows :
Variable
gass saturation
N
18
Mean
38.77
SE Mean
1.9822
StDev
8.41
Minimum
22
Q1
33.62
Median
38.25
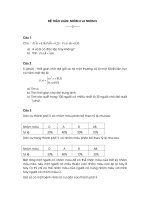
The normal probability plot and histogram for the saturation data are
presented below :
Normal Q−Q Plot
40
35
0
25
1
30
2
Sample Quantiles
45
3
50
4
Histogram of x
Frequency
[12]
20
25
30
35
40
45
50
x
55
−2
−1
0
1
Theoretical Quantiles
(a) Based on the previous histogram and normal probability plot, would
it appear reasonable to assume the saturation amount is normally distributed ? Discuss.
Solution. Since the qq-plot seesm to be straight and the histogram
shows roughly a symmetric shape we may believe this quantity folows
a normal distribution.
8
2
(b) Is there sufficient evidence at α = 0.05 to conclude the solvent
injection results in a mean saturation amount of less than 40 ?
Solution.
H0 : µ = 40 vs H1 : µ < 40.
38.77 − 40
x¯ − 40
√ =
= −0.6205.
T =
1.9822
s/ n
P (t(17) < −0.6205) ∈ (0.25, 0.4).
So we accept H0 .
9
(c) Construct a 90% confidence interval for the mean saturation amount.
Solution. The cconfidence interval is
√
x¯ ± t0.05,17 s/ n = 38.77 ± 1.74(1.9822) = 38.77 ± 3.45.
10
Multiple Choice Questions
Submit your answers for the multiple choice questions in the
table found on the front page. Correct answers to each question
worth 4.5 marks.
1. A manufacturer of calculators buys integrated circuits from supplies
A,B and C. Fifty percents of the circuits come from A, 30% from B
and 20% from C. One percent of the circuits supplied by A have been
defective in the past, 3% of B’s have been defective and 4% of C have.
A circuit is selected at random and found to be defective. What is the
probability it was manufactured by B ?
(a) 0.409
(b) 0.591
(c) 0.519
(d) 0.333
(e) 0.67.
Solution.
P (A) = 0.5, P (B) = 0.3, P (C) = 0.3.
Let D =Defective. We have
P (D|A) = 0.01, P (D|B) = 0.03, P (D|C) = 0.04.
We need to find
P (B|D) =
9
P (B|D)P (D)
=
= 0.409.
P (D|A)P (A) + P (D|B)P (B) + P (D|C)P (C)
22
Answer is (a).
2. In August, the probability that a thunderstorm will occur on any particular day is 0.1. What is the probability that the first thunderstorm
in August will occur on August 12 ?
(a) 0.3138
(b) 0.03138
none of the preceeding.
(c) 0.6962
Solution.
(0.9)11 (0.1) = 0.03138106.
Answer is (b).
11
(d) 0.43047
(e)
3. In a communication system there is one error every 10 seconds, in
average. If the number of errors have a Poisson distribution calculate
the probability that in 30 seconds we have at least one error.
(a) 1 − 4e−3
(b) 1 − 2e−1
(c) 1 − e−1
(d) 1 − 3e−3
(e) 1 − e−3 .
Solution. X has a Poisson distribution with µ = E(X) = 3 errors/(30
second). Therefore
P (X ≥ 1) = 1 − P (X = 0) = 1 − exp(−3).
Therefore answer is (e).
4. The thickness of hockey pucks manufactured by a certain company has
a normal distribution with mean 1 inch and standard deviation 0.05
inch. If pucks used in NHL must have a thickness between 0.9 and 1.1
inch, what percentage of pucks manufactured by this company can be
used by the NHL ?
(a) 100
(b) 95.44
(c)4.56
(d) 97.72
(e) 2.28.
Solution.
P (0.9 < X < 1.1) = P (−2 < Z < 2) = 0.954.
Answer is (b).
5. A seed distributor claims 80% of its beet seeds will grow. How many
seeds must be tested in order to estimate p, the proportion that will
germinates, so that the maximum error of the estimate is 0.03 with
95% confidence.
(a) 80
(b) 90
(c) 683
(d) 110
(e) 1490.
Solution.
n=
(0.8)(0.2)(1.962 )
pqz 2 (α/2)
=
= 682.95 ≈ 683.
e2
0.032
Therefore the answer is (c).
12
6. Let X and Y be be two independent random variables such that E(X) =
E(Y ) = 4 and V ar(X) = V ar(Y ) = 2. Define U = 3X − 2Y . Find
E(U ) and V ar(U ) ?
(a) E(U ) = −4, V ar(U ) = 4
(b) E(U ) = 4, V ar(U ) = 2
(c) E(U ) = 4, V ar(U ) = 20
(d) E(U ) = −4, V ar(U ) = 2
(e) E(U ) = 4 V ar(U ) = 26.
Solution.
E(3X − 2Y ) = 3E(X) − 2E(Y ) = 12 − 8 = 4,
V ar(3X − 2Y ) = 9V ar(X) + 4V ar(Y ) = 26.
Therefore the answer is (e)
7. A company claims that the average amount of deflection of a 10-feet
steel plates is equal to 0.012 inches. A contractor suspected that the
true mean is greater than 0.012. He measures the deflection of 10-feet
steel plates x and obtains the following data :
0.0132, 0.0138, 0.0108, 0.0126, 0.0136,
0.0112, 0.0124, 0.0116, 0.0127, 0.0131
A simple computation shows that x¯ = 0.0125 and s = 0.0010. Compute
the p = p-value and give a conclusion.
(a) p ∈ (0.05, 0.1) ; Reject H0 at α = 0.05.
(b) p ∈ (0.1, 0.25) ; Reject H0 at α = 0.05.
(c) p ∈ (0.05, 0.1) ; Do not reject H0 at α = 0.05.
(d) p ∈ (0.1, 0.25) ; Do not reject H0 at α = 0.05.
(e) p > 0.7 ; Do not reject H0 at α = 0.05.
Solution.
T =
0.0125 − 0.012
√
= 1.581.
0.001/ 10
We have
P (t(9) > 1.58) ∈ (0.05, 0.1)
and we do not reject H0 . The answer is (c).
13
8. An electrical system consists of 4 components. A parallel system of
these components works if at least one of these components works. Assume that four components work independently. The reliability (probability of working) of each component is 0.75. What is the probability
that the entire parallel system works ?
(a) 0.9926
0.7500
(b) 0.9984
(c) 0.9887
(d) 0.9961
(e)
Solution.
P (AT LEAST ONE WORKS) = 1 − P (NONE WORKS)
= 1 − 0.254 = 0.9960938
The answer is (d).
9. Let X1 , . . . , Xn be a random sample from a population with mean µ = 5
¯ be the sample mean. Find c such that
and variance σ 2 = 1.5 Let X
P
(a) 1.645
(b) 1.96
¯ −µ
X
√
σ/ n
= 0.90.
(c) -1.96
(d) -1.28
(e) 1.28.
¯
X−µ
√ ∼ N (0, 1) we have P (Z > c) = 0.9. From normal
Solution. Since σ/
n
table the answer is c = −1.28. Answer is (d).
10. A and B are two events such that P (A) = 0.3, P (B) = 0.5 and P (A ∪
B) = 0.65. Which of the following statements is true ?
(a) A and B are independent and mutually exclusive events
(b) A and B are dependent and mutually exclusive events
(c) A and B are dependent but not mutually exclusive events
(d) A and B are independent but not mutually exclusive events
(e) Insufficient information is provided
Solution. We have
P (A ∩ B) = P (A) + P (B) − P (A ∪ B) = 0.3 + 0.5 − 0.65 = 0.15.
14
We also have
P (A)P (B) = 0.15.
Therefore A and B are independent. P (A ∩ B) = 0. Therefore A and
B are not mutually exclusive. Therefore the answer is (d).
11. Transportation officials state that 90% of the population wear their
seatbelts while driving. A random sample of 1000 drivers has been
taken. Find the approximate probability that 888 or fewer drivers were
wearing their seatbelts.
(a) 0.888
(b) 0.104
(c) 0.113
(d) 0.141
(e) 0.258
Solution.
P (X ≤ 888) = P
Z≤
888.5 − 900
1000(0.9)(0.1)
= P (Z ≤ −1.2122) = 0.113.
The answer is (c).
12. A random sample of 167 engineering students produced the following
95% confidence interval for the proportion of students who own an
iPhone : (0.344, 0.494). Identify the point estimate for estimating the
true proportion of engineering students who own an iPhone.
(a) 0.419
(b) 1.96
(c) 95
(d) 0.494
Solution.
(0.344 + 0.494)/2 = 0.419.
The answer is (a).
15
(e) 0.344