- Trang chủ >>
- Khoa Học Tự Nhiên >>
- Vật lý
A role for selfgravity at multiple length scales in the process of star formation
Bạn đang xem bản rút gọn của tài liệu. Xem và tải ngay bản đầy đủ của tài liệu tại đây (7.98 MB, 4 trang )
Vol 457 | 1 January 2009 | doi:10.1038/nature07609
LETTERS
A role for self-gravity at multiple length scales in the
process of star formation
Alyssa A. Goodman1,2, Erik W. Rosolowsky2,3, Michelle A. Borkin1{, Jonathan B. Foster2, Michael Halle1,4,
Jens Kauffmann1,2 & Jaime E. Pineda2
Self-gravity plays a decisive role in the final stages of star formation, where dense cores (size 0.1 parsecs) inside molecular clouds
collapse to form star-plus-disk systems1. But self-gravity’s role at
earlier times (and on larger length scales, such as 1 parsec) is
unclear; some molecular cloud simulations that do not include
self-gravity suggest that ‘turbulent fragmentation’ alone is sufficient to create a mass distribution of dense cores that resembles,
and sets, the stellar initial mass function2. Here we report a ‘dendrogram’ (hierarchical tree-diagram) analysis that reveals that
self-gravity plays a significant role over the full range of possible
scales traced by 13CO observations in the L1448 molecular cloud,
but not everywhere in the observed region. In particular, more
than 90 per cent of the compact ‘pre-stellar cores’ traced by peaks
of dust emission3 are projected on the sky within one of the dendrogram’s self-gravitating ‘leaves’. As these peaks mark the locations of already-forming stars, or of those probably about to form,
a self-gravitating cocoon seems a critical condition for their existence. Turbulent fragmentation simulations without self-gravity—
even of unmagnetized isothermal material—can yield mass and
velocity power spectra very similar to what is observed in clouds
like L1448. But a dendrogram of such a simulation4 shows that
nearly all the gas in it (much more than in the observations)
appears to be self-gravitating. A potentially significant role for
gravity in ‘non-self-gravitating’ simulations suggests inconsistency
in simulation assumptions and output, and that it is necessary to
include self-gravity in any realistic simulation of the star-formation
process on subparsec scales.
Spectral-line mapping shows whole molecular clouds (typically
tens to hundreds of parsecs across, and surrounded by atomic gas)
to be marginally self-gravitating5. When attempts are made to further
break down clouds into pieces using ‘segmentation’ routines, some
self-gravitating structures are always found on whatever scale is
sampled6,7. But no observational study to date has successfully used
one spectral-line data cube to study how the role of self-gravity varies
as a function of scale and conditions, within an individual region.
Most past structure identification in molecular clouds has been
explicitly non-hierarchical, which makes difficult the quantification
of physical conditions on multiple scales using a single data set.
Consider, for example, the often-used algorithm CLUMPFIND7. In
three-dimensional (3D) spectral-line data cubes, CLUMPFIND operates as a watershed segmentation algorithm, identifying local maxima
in the position–position–velocity (p–p–v) cube and assigning nearby
emission to each local maximum. Figure 1 gives a two-dimensional
(2D) view of L1448, our sample star-forming region, and Fig. 2
includes a CLUMPFIND decomposition of it based on 13CO observations. As with any algorithm that does not offer hierchically nested or
overlapping features as an option, significant emission found between
prominent clumps is typically either appended to the nearest clump or
turned into a small, usually ‘pathological’, feature needed to encompass all the emission being modelled. When applied to molecular-line
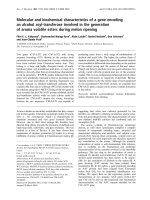
10′ ≈ 0.75 pc
Figure 1 | Near-infrared image of the L1448 star-forming region with
contours of molecular emission overlaid. The channels of the colour image
correspond to the near-infrared bands J (blue), H (green) and K (red), and
the contours of integrated intensity are from 13CO(1–0) emission8.
Integrated intensity is monotonically, but not quite linearly (see
Supplementary Information), related to column density18, and it gives a view
of ‘all’ of the molecular gas along lines of sight, regardless of distance or
velocity. The region within the yellow box immediately surrounding the
protostars has been imaged more deeply in the near-infrared (using Calar
Alto) than the remainder of the box (2MASS data only), revealing protostars
as well as the scattered starlight known as ‘Cloudshine’21 and outflows
(which appear orange in this colour scheme). The four billiard-ball labels
indicate regions containing self-gravitating dense gas, as identified by the
dendrogram analysis, and the leaves they identify are best shown in Fig. 2a.
Asterisks show the locations of the four most prominent embedded young
stars or compact stellar systems in the region (see Supplementary Table 1),
and yellow circles show the millimetre-dust emission peaks identified as starforming or ‘pre-stellar’ cores3.
1
Initiative in Innovative Computing at Harvard, Cambridge, Massachusetts 02138, USA. 2Harvard-Smithsonian Center for Astrophysics, Cambridge, Massachusetts 02138, USA.
Department of Physics, University of British Columbia, Okanagan, Kelowna, British Columbia V1V 1V7, Canada. 4Surgical Planning Laboratory and Department of Radiology, Brigham
and Women’s Hospital, Harvard Medical School, Boston, Massachusetts 02115, USA. {Present address: School of Engineering and Applied Sciences, Harvard University, Cambridge,
Massachusetts 02138, USA.
3
63
©2009 Macmillan Publishers Limited. All rights reserved
LETTERS
NATURE | Vol 457 | 1 January 2009
Self-gravitating
leaves
Self-gravitating
structures
All structure
Tmb (K)
6
4
2
0
d 8
CLUMPFIND segmentation
Tmb (K)
6
4
2
0
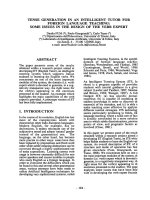
Figure 2 | Comparison of the ‘dendrogram’ and ‘CLUMPFIND’ featureidentification algorithms as applied to 13CO emission from the L1448
region of Perseus. a, 3D visualization of the surfaces indicated by colours in
the dendrogram shown in c. Purple illustrates the smallest scale selfgravitating structures in the region corresponding to the leaves of the
dendrogram; pink shows the smallest surfaces that contain distinct selfgravitating leaves within them; and green corresponds to the surface in the
data cube containing all the significant emission. Dendrogram branches
corresponding to self-gravitating objects have been highlighted in yellow
over the range of Tmb (main-beam temperature) test-level values for which
the virial parameter is less than 2. The x–y locations of the four ‘selfgravitating’ leaves labelled with billiard balls are the same as those shown in
Fig. 1. The 3D visualizations show position–position–velocity (p–p–v) space.
RA, right ascension; dec., declination. For comparison with the ability of
dendrograms (c) to track hierarchical structure, d shows a pseudodendrogram of the CLUMPFIND segmentation (b), with the same four
labels used in Fig. 1 and in a. As ‘clumps’ are not allowed to belong to larger
structures, each pseudo-branch in d is simply a series of lines connecting the
maximum emission value in each clump to the threshold value. A very large
number of clumps appears in b because of the sensitivity of CLUMPFIND to
noise and small-scale structure in the data. In the online PDF version, the 3D
cubes (a and b) can be rotated to any orientation, and surfaces can be turned
on and off (interaction requires Adobe Acrobat version 7.0.8 or higher). In
the printed version, the front face of each 3D cube (the ‘home’ view in the
interactive online version) corresponds exactly to the patch of sky shown in
Fig. 1, and velocity with respect to the Local Standard of Rest increases from
front (20.5 km s21) to back (8 km s21).
data, CLUMPFIND typically finds features on a limited range of scales,
above but close to the physical resolution of the data, and its results can
be overly dependent on input parameters. By tuning CLUMPFIND’s
two free parameters, the same molecular-line data set8 can be used to
show either that the frequency distribution of clump mass is the same
as the initial mass function of stars or that it follows the much shallower mass function associated with large-scale molecular clouds
(Supplementary Fig. 1).
Four years before the advent of CLUMPFIND, ‘structure trees’9
were proposed as a way to characterize clouds’ hierarchical structure
Local max
Test level
Local max
Leaf
c 8
Merge
Local max
Merge
Branch
Click to rotate
Leaf
x (RA)
Trunk
x (RA)
Leaf
vz
using 2D maps of column density. With this early 2D work as inspiration, we have developed a structure-identification algorithm that
abstracts the hierarchical structure of a 3D (p–p–v) data cube into
an easily visualized representation called a ‘dendrogram’10. Although
well developed in other data-intensive fields11,12, it is curious that the
application of tree methodologies so far in astrophysics has been rare,
and almost exclusively within the area of galaxy evolution, where
‘merger trees’ are being used with increasing frequency13.
Figure 3 and its legend explain the construction of dendrograms
schematically. The dendrogram quantifies how and where local maxima of emission merge with each other, and its implementation is
explained in Supplementary Methods. Critically, the dendrogram is
determined almost entirely by the data itself, and it has negligible
sensitivity to algorithm parameters. To make graphical presentation
possible on paper and 2D screens, we ‘flatten’ the dendrograms of 3D
data (see Fig. 3 and its legend), by sorting their ‘branches’ to not
cross, which eliminates dimensional information on the x axis while
preserving all information about connectivity and hierarchy.
Numbered ‘billiard ball’ labels in the figures let the reader match
features between a 2D map (Fig. 1), an interactive 3D map (Fig. 2a
online) and a sorted dendrogram (Fig. 2c).
A dendrogram of a spectral-line data cube allows for the estimation
of key physical properties associated with volumes bounded by isosurfaces, such as radius (R), velocity dispersion (sv) and luminosity
(L). The volumes can have any shape, and in other work14 we focus on
the significance of the especially elongated features seen in L1448
(Fig. 2a). The luminosity is an approximate proxy for mass, such
that Mlum 5 X13COL13CO, where X13CO 5 8.0 3 1020 cm2 K21 km21 s
(ref. 15; see Supplementary Methods and Supplementary Fig. 2).
The derived values for size, mass and velocity dispersion can then be
used to estimate the role of self-gravity at each point in the hierarchy,
via calculation of an ‘observed’ virial parameter, aobs 5 5sv2R/GMlum.
In principle, extended portions of the tree (Fig. 2, yellow highlighting)
where aobs , 2 (where gravitational energy is comparable to or larger
than kinetic energy) correspond to regions of p–p–v space where selfgravity is significant. As aobs only represents the ratio of kinetic energy
to gravitational energy at one point in time, and does not explicitly
capture external over-pressure and/or magnetic fields16, its measured
value should only be used as a guide to the longevity (boundedness) of
any particular feature.
Intensity level
vz
y (dec.)
b
y (dec.)
a
Figure 3 | Schematic illustration of the dendrogram process. Shown is the
construction of a dendrogram from a hypothetical one-dimensional
emission profile (black). The dendrogram (blue) can be constructed by
‘dropping’ a test constant emission level (purple) from above in tiny steps
(exaggerated in size here, light lines) until all the local maxima and mergers
are found, and connected as shown. The intersection of a test level with the
emission is a set of points (for example the light purple dots) in one
dimension, a planar curve in two dimensions, and an isosurface in three
dimensions. The dendrogram of 3D data shown in Fig. 2c is the direct
analogue of the tree shown here, only constructed from ‘isosurface’ rather
than ‘point’ intersections. It has been sorted and flattened for representation
on a flat page, as fully representing dendrograms for 3D data cubes would
require four dimensions.
64
©2009 Macmillan Publishers Limited. All rights reserved
LETTERS
1.00
0.10
0.01
Beam size
In calculating aobs, we are implicitly assuming that there is a oneto-one relationship (known as a ‘bijection’) between a volume in
p–p–v space and a volume of physical (position–position–position,
p–p–p) space. This bijection paradigm is fine for regions which are
dominated by a single structure, but the complexities of relating p–p–
v space to physical space in regions with multiple features along a line
of sight does mean that this treatment can only ever give an approximate measure of the true dynamical state of the cloud17. Alternatives
to bijection are considered in the Supplementary Information. The
bijection assumption comes into play when measuring physical
properties of individual features, but it does not influence the characterization of hierarchical structure.
In Fig. 2c, we show the dendrogram for the same L1448 13CO
spectral-line map shown using contours in Fig. 1. All of the portions
shaded yellow have aobs , 2, meaning that they are (most) likely to be
self-gravitating. The four most compact p–p–v structures (leaves)
where aobs , 2 are numbered in Figs 1 and 2, and they are not as
apparent in the projected (2D) view (Fig. 1) as they are in p–p–v (3D)
space (Fig. 2a). In the CLUMPFIND decomposition of the cloud
(Fig. 2b), these features are not apparent as special.
Overall, the pattern of yellow highlighting in Fig. 2 suggests the
importance of gravity on all possible scales, but not within the full
possible volume, in a cloud like L1448. With the exception of the gas
around region 4, which appears not to be bound to the rest of L1448,
the tree shows a fully yellow-highlighted ‘trunk’ and only sporadic
highlighting on the dendrogram’s tallest branches and leaves. So
for the material traced by 13CO observations, it appears that selfgravitating structures are more prevalent on larger scales than on
smaller. At densities surpassing 5 3 103 cm23, 13CO becomes an
increasingly poor tracer of mass18, so it can only give upper limits
for the ‘true’ virial parameters of the densest, most compact, structures
seen in the dendrogram. Thus, the highest-density non-yellow leaves
in Fig. 2c may harbour bound structures only visible with thinner or
less-depleted molecular lines. On the other hand, lower-density nonyellow leaves in Fig. 2c probably represent actual low-mass unbound
structures in the gas, similar to the ‘pressure-confined’ low-mass
clumps found in clump-based segmentations. Importantly, the full
pattern of highlighting explicitly indicates that core-like leaves often
reside within structures where the mutual gravity between the cores
(leaves) and/or their environs (branches) is significant enough to
cause meaningful interactions between cores—possibly even, in the
most extreme cases, competitive accretion. Recent work18 has shown
that the overall (column) density distribution of material traced by
13
CO in a 10-pc-scale molecular cloud is roughly log-normal, and our
result here implies that some of the high-density fluctuations in that
statistical distribution are bound within themselves and/or to each
other, and some not.
Tree hierarchies can be used to intercompare the topology and
physical properties (for example boundedness) of structures within
star-forming regions, and such intercomparison can be profitably
extended to simulations as well. In Fig. 4, we summarize such a
comparison (see Supplementary Information) with a plot showing
the fraction of ‘self-gravitating’ (aobs , 2) material as a function of
spatial scale for both our L1448 data and for a synthetic data cube4.
The simulation used to produce the synthetic data is purely hydrodynamic, meaning that the effects of magnetic fields, heating and
cooling, and self-gravity are not included. The power-law exponent
characterizing the power spectrum of turbulence in these synthetic
13
CO data and in the COMPLETE Perseus data8 (from which our
L1448 example is drawn) is ,1.8, to within small uncertainties
(,0.2; ref. 4). However, inspection of Fig. 4 (and of Supplementary Fig. 4) clearly shows that the data and simulation appear
quite different in the context of dendrogram analysis: in the simulation, nearly all material (much more than in the observations) is
self-gravitating, on all spatial scales. Critically, the analysis of the
synthetic 13CO cube4 (Supplementary Fig. 4) is done on a simulated
observation of it where we have deliberately matched resolution,
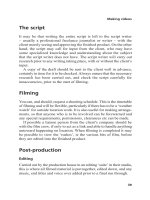
Fraction of emission in self-gravitating strctures
NATURE | Vol 457 | 1 January 2009
L1448
Simulation
1.0
0.1
Scale (pc)
Figure 4 | The fraction of self-gravitating emission as a function of scale in
L1448 and a comparable simulation. Most of the emission in the L1448
region is contained with large-scale self-gravitating structures, but only a low
fraction of small-scale objects show signs of self-gravitation. (See text for
discussion of the high-density, small-scale, self-gravitating structures to
which 13CO is insensitive.) In the L1448 observations, gravity is significant
on all scales, but not in all regions. In contrast, the simulated map implies
that nearly all scales, and all regions, should be influenced by gravity.
noise properties and region extent to the L1448 cube (Supplementary Methods). The (constant) abundance of 13CO used for the
synthetic map (Supplementary Information) is set to match the
known column densities in the simulation, and because abundance
is simply a multiplicative constant, changing it cannot reproduce the
scale dependence of gravity found in the L1448 data.
Thus it appears that the synthetic data cube created from the
simulation4 contains much material that would be significantly affected by gravity, if gravity were actually included in the simulation.
The accuracy with which dendrograms can offer estimates of aobs is
at or below the 25% level (Supplementary Information). The uncertainty results primarily from the need to glean a 3D geometry and
density based on 2D size and column density (mass/area), and any
analysis of p–p–v data will be subject to the same limitations. More
analysis, using simulations, of the translation from p–p–v to p–p–p
space17 should be, and is being, carried out to quantify these uncertainties more finely. Comparative measurements (for example Fig. 4)
are far more certain as these biases should affect all data sets similarly.
Thus, the apparent disagreement between observations and simulation in Fig. 4 can be explained by claiming that either, or both, of
the following are true: (1) the assumptions/calculations leading to the
creation of the synthetic 13CO observations are faulty; or (2) there is
missing physics in the simulation (for example gravity, thermal
effects), making it an insufficient approximation to real star-forming
regions.
Finally, we turn to the relationship between the apparently ‘selfgravitating’ regions in L1448 and the star-formation process itself.
Compact millimetre-wavelength emission peaks caused by dust
emission (marked by yellow circles in Fig. 1) are typically taken as
markers of cores that are forming, or are able to form, stars. Within
the region of L1448 considered here, more than 90% of the compact
millimetre-dust peaks traced in bolometer observations3 are found
projected on the sky within one of the dendrogram’s ‘self-gravitating’
leaves, and none is found outside a self-gravitating branch. Recent
NH3 observations19 suggest that all, or all but one, of these ‘pre-stellar
cores’ lie within self-gravitating structures along the velocity dimension as well14. As young sources get a little older, they can be detected
in the mid-infrared (IRAC) bands of the Spitzer Space Telescope.
Four out of the five sources identified by such IRAC imaging as
protostar candidates20 also lie within a leaf, and each of those four
is associated with a millimetre-dust peak, suggesting they are embedded in dense natal cocoons. Interestingly, the one IRAC protostar
65
©2009 Macmillan Publishers Limited. All rights reserved
LETTERS
NATURE | Vol 457 | 1 January 2009
candidate in the region not associated with a self-gravitating leaf is
also not associated with a millimetre-dust peak, suggesting it is a
more evolved source. All told, these associations suggest that a selfgravitating home is critical to the earliest phases of star formation.
Received 28 June 2007; accepted 28 October 2008.
1.
2.
3.
4.
5.
6.
7.
8.
9.
10.
11.
12.
13.
14.
15.
Di Francesco, J. et al. in Protostars and Planets V (eds Reipurth, B., Jewitt, D. & Keil,
K.) 17–32 (Univ. Arizona Press, 2006).
¨ . The stellar initial mass function from turbulent
Padoan, P. & Nordlund, A
fragmentation. Astrophys. J. 576, 870–879 (2002).
Enoch, M. L. et al. Bolocam survey for 1.1 mm dust continuum emission in the c2d
legacy clouds. I. Perseus. Astrophys. J. 638, 293–313 (2006).
Padoan, P., Juvela, M., Kritsuk, A. & Norman, M. L. The power spectrum of
supersonic turbulence in Perseus. Astrophys. J. 653, L125–L128 (2006).
Larson, R. B. Turbulence and star formation in molecular clouds. Mon. Not. R.
Astron. Soc. 194, 809–826 (1981).
Stutzki, J. & Gusten, R. High spatial resolution isotopic CO and CS observations of
M17 SW: The clumpy structure of the molecular cloud core. Astrophys. J. 356,
513–515 (1990).
Williams, J., de Geus, E. & Blitz, L. Determining structure in molecular clouds.
Astrophys. J. 428, 693–712 (1994).
Ridge, N. A. et al. The COMPLETE survey of star-forming regions: Phase I data.
Astron. J. 131, 2921–2933 (2006).
Houlahan, P. & Scalo, J. Recognition and characterization of hierarchical interstellar
structure. II - Structure tree statistics. Astrophys. J. 393, 172–187 (1992).
Rosolowsky, E. W., Pineda, J. E., Kauffmann, J. & Goodman, A. A. Structural
analysis of molecular clouds: Dendrograms. Astrophys. J. 679, 1338–1351 (2008).
Heine, C., Scheuermann, G., Flamm, C., Hofacker, I. L. & Stadler, P. F. Visualization
of barrier tree sequences. IEEE Trans. Vis. Comput. Graph. 12, 781–788 (2006).
Vliegen, R., van Wijk, J. J. & van der Linden, E.-J. Visualizing business data with
generalized treemaps. IEEE Trans. Vis. Comput. Graph. 12, 789–796 (2006).
Kauffmann, G. & White, S. D. M. The merging history of dark matter haloes in a
hierarchical universe. Mon. Not. R. Astron. Soc. 261, 921–928 (1993).
Kauffmann, J. et al. The COMPLETE structure of L1448: Where (and why) dense
cores do form. Astrophys. J. (submitted).
Pineda, J. E., Caselli, P. & Goodman, A. A. CO isotopologues in the Perseus
molecular cloud complex: the X-factor and regional variations. Astrophys. J. 679,
481–496 (2008).
16. Bertoldi, F. & McKee, C. F. Pressure-confined clumps in magnetized molecular
clouds. Astrophys. J. 395, 140–157 (1992).
17. Ostriker, E. C., Stone, J. M. & Gammie, C. F. Density, velocity, and magnetic field
structure in turbulent molecular clouds. Astrophys. J. 546, 980–1005 (2001).
18. Goodman, A., Pineda, J. E. & Schnee, S. The ‘‘true’’ column density distribution in
star-forming molecular clouds. Astrophys. J. (in the press); preprint at Æhttp://
arxiv.org/abs/0806.3441v3æ (2008).
19. Rosolowsky, E. W. et al. An ammonia spectral atlas of dense cores in Perseus.
Astrophys. J. 175 (Suppl.), 509–521 (2008).
20. Jørgensen, J. K. et al. Current star formation in the Ophiuchus and Perseus
molecular clouds: constraints and comparisons from unbiased submillimeter and
mid-infrared surveys. II. Astrophys. J. 683, 822–843 (2008).
21. Foster, J. B. & Goodman, A. A. Cloudshine: New light on dark clouds. Astrophys. J.
636, L105–L108 (2006).
Supplementary Information is linked to the online version of the paper at
www.nature.com/nature.
Acknowledgements We thank A. Munshi for putting us in touch with M. Thomas
and colleagues at Right Hemisphere, whose software and assistance enabled the
interactive PDF in this paper; P. Padoan for providing the simulated data cube;
R. Shetty for comments on the paper; F. Shu for suggesting we extend our analysis
to measure boundedness of p–p–v ‘bound’ objects in p–p–p space using
simulations; and S. Hyman, Provost of Harvard University, for supporting the
start-up of the Initiative in Innovative Computing at Harvard, which substantially
enabled the creation of this work. 3D Slicer is developed by the National Alliance
for Medical Image Computing and funded by the National Institutes of Health grant
U54-EB005149. The COMPLETE group is supported in part by the National
Science Foundation. E.W.R. is supported by the NSF AST-0502605.
Author Contributions The dendrogram algorithm and software was created by
E.W.R. The interactive figures were assembled by M.A.B., J.K. and M.H. using
software from Right Hemisphere and Adobe. J.K. and M.H. worked to allow 3D
Slicer to plot the surfaces relevant to the dendrograms shown in the 3D figures.
J.B.F. produced Fig. 1, and J.E.P. carried out the ‘CLUMPFINDing’ analysis shown in
Fig. 2 and Supplementary Fig. 1. A.A.G. wrote most of the text, and all authors
contributed their thoughts to the discussions and analysis that led to this work.
Author Information The 3D Slicer software used to create the surface renderings is
available at Reprints and permissions information is
available at www.nature.com/reprints. Correspondence and requests for
materials should be addressed to A.A.G. ().
66
©2009 Macmillan Publishers Limited. All rights reserved