Shaking table test of a friction damped frame structure (p 45 54)
Bạn đang xem bản rút gọn của tài liệu. Xem và tải ngay bản đầy đủ của tài liệu tại đây (321.95 KB, 10 trang )
THE STRUCTURAL DESIGN OF TALL AND SPECIAL BUILDINGS
Struct. Design Tall Spec. Build. 13, 45–54 (2004)
Published online 9 June 2004 in Wiley Interscience (www.interscience.wiley.com). DOI:10.1002/tal.232
SHAKING-TABLE TEST OF A FRICTION-DAMPED
FRAME STRUCTURE
WEN-I LIAO1*, IMAD MUALLA2 AND CHIN-HSIUNG LOH3
1
Department of Civil and Environmental Engineering, National University of Kaohsiung, Taiwan
2
Technical University of Denmark, Denmark
3
National Center for Research on Earthquake Engineering, Taiwan, and Department of Civil Engineering, National Taiwan
University, Taiwan
SUMMARY
This paper presents results from an international research project devoted to evaluating the seismic performance
of a three-storey steel frame structure equipped with a friction-damping device (FDD) recently developed at the
Technical University of Denmark. Experimental results indicate that the FDD performed very well in reducing
the lateral storey drifts of the test frame. Numerical simulation of the seismic response of the primary and
friction-damped frame was also conducted. This paper also compares the predictions of the displacement demand
from the test results with those obtained by the capacity spectrum method. Copyright © 2004 John Wiley & Sons,
Ltd.
1.
INTRODUCTION
Passive energy dissipation devices have been successfully used to reduce the dynamic response of
structures subjected to earthquakes. The primary reason for introducing energy dissipation devices into
a building frame is to reduce the displacement and damage in the frame. Displacement reduction is
archived by adding stiffness and/or energy dissipation (damping) to the building frame. Metallic yield,
friction and viscoelastic energy dissipation devices typically introduce both stiffness and damping;
viscous dampers will only increase the damping in a building frame. Friction-damped devices have
been used as a component of these dampers because they provide high-energy dissipation potential at
a relatively low cost and are easy to maintain, with some having already been implemented in buildings in different areas of the world. Several researchers have investigated the experimental testing and
development of seismic design procedures for these dampers, e.g. Constantinou et al. (1991), Pall and
Marsh (1982), Cherry and Filiatrault (1990), and design guidelines have been implemented in FEMA273 (Building Seismic Safety Council, 1997) and FEMA-368 (Building Seismic Safety Council,
2000).
For the current study, an international team conducted an experimental research programme on a
three-storey steel frame structure equipped with friction-damping devices (FDDs) at the large-scale
testing facility of the National Centre for Research on Earthquake Engineering (NCREE), Taiwan. The
new FDD was recently developed at the Technical University of Denmark (Mualla and Nielsen, 2000).
In this program a three-storey steel moment-resisting frame braced by FDDs was tested using a shaking
table. Only unilateral ground shaking was used to investigate the seismic responses of the test struc-
* Correspondence to: Prefessor Wen-I Liao, Department of Civil and Environmental Engineering, National University of
Kaohsiung, No. 700, Kaohsiung University Road, Kaoshiung 811, Taiwan. E-mail:
Copyright © 2004 John Wiley & Sons, Ltd.
Received November 2002
Accepted February 2003
46
WEN-I LIAO ET AL.
ture. The performance of the FDD is discussed and numerical simulation of the seismic responses of
the primary and friction-damped frame is also provided.
There are many simplified non-linear static analysis methods to estimate the maximum displacement of structures, such as the capacity spectra method, which utilizes the intersection of the capacity curve and reduced demand curve (e.g. ATC-40, Applied Technology Council, 1996; FEMA-273,
Building Seismic Safety Council, 1997), and the displacement coefficient method, which utilizes a
modified version of the equal displacement approximation (e.g. FEMA-273). Another objective of this
paper is to compare the displacement demand obtained by the shaking-table test with those predicted
by the push over analysis following the ATC-40 and FEMA-273 procedures.
2.
TEST PROGRAMME AND TEST RESULTS
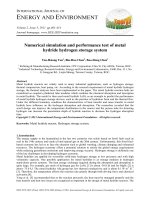
The test structure was a three-storey steel moment-resisting frame with 3.0 m storey height and 4.5 m
bay in the direction of shaking, as shown in Figure 1, and the total weight of the whole frame was
about 34 tons. Two FDDs were installed at each storey. The damper unit attached to the girder and
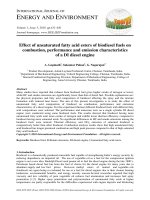
instrumented for the test is also shown in Figure 1(a). The details and the mechanism of the FDD are
shown in Figure 2(a) and 2(b), respectively. The damper consists of three steel plates, rotating against
each other around a pre-stressed bolt, which presses the plates together. Between these steel plates
there are two circular friction pad discs, which provide dry friction lubrication in the unit, ensuring
stable friction force of the movements. A friction pad disc with friction coefficient 0.4 was used in
this programme.
The central plates connected the damper device to the girder of the frame structure by a hinge, and
the two sides were connected to the bracing system. In this test, inverted V-bracing was used. The
bracing system consisted of pre-tensioned bar members in order to avoid buckling. The bracing bars
were pin-connected at both ends to the damper and to the beam–column joint. The magnitude of prestress applied to the bolt and to the bracing bar was according to earthquake type and peak ground
acceleration (PGA) level. In general, higher PGA needs higher pre-stress for both the bolt and the
bracing bars. Table 1 shows the pre-stress applied to the bolts and bracing bars used in the test for
input of Kobe earthquake with PGA = 0·18 g. In order to have a constant friction force, several disc
spring washers were used. In addition, hardened washers were placed between these spring washers
and steel plates to prevent any marks on the steel plate due to the disc springs when they were in
compression.
Three records were used as the input ground motion for the shaking-table test: the 1940 Imperial
Valley–El Centro (EW), 1995 Kobe (Takatori EW) and 1999 Chi-Chi (TCU052 EW) earthquake.
Various PGA levels of each record were employed to perform the unilateral excitation, and in total 14
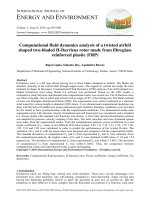
tests were conducted in this programme. Figure 3 compares time histories of the first-floor storey drift
between the friction-damped frame and primary frame by inputting the El Centro, Kobe and Chi-Chi
earthquake records, respectively. The input PGA for each earthquake record is also shown in this figure.
As observed from these figures, the friction damping system can effectively reduce the storey drift.
Table 2 compares the maximum storey drift of the friction-damped frame and primary frame under
various PGA with the input of different earthquake records. From this table, it can be found that the
friction damping system can effectively reduce the storey drift in different PGA levels, but the reduction of storey drift decreases as the PGA level increases. Based on the 14 test results, the seismic performance and durability of the FDD can be summarized as follows:
1. The rigorous full-scale testing at the shaking-table facility of NCREE proved the excellent capacity of the damping system to significantly reduce the building vibrations, as shown in the tables.
2. After all 14 tests no damage occurred to the dampers, bracing bars, frame members or connections.
Copyright © 2004 John Wiley & Sons, Ltd.
Struct. Design Tall Spec. Build. 13, 45–54 (2004)
47
SHAKING-TABLE TEST
(b)
(a)
Copyright © 2004 John Wiley & Sons, Ltd.
Figure 1. (a) Photos of the test frame, damper attached to
the girder, and instruments. (b) Elevation view of the test
steel frame
Struct. Design Tall Spec. Build. 13, 45–54 (2004)
48
WEN-I LIAO ET AL.
Hinge, pin-connected to
the Girder
prestressd bolt
pre-stressed
bolt
Friction Pad Disc with
Friction Coefficient 0.4
Pin-connected to the
bracing bar
(a)
(b)
Figure 2. (a) Details of the friction damper device (Mualla and Nielsen, 2000). (b) Mechanism of the friction
damper device
Table 1. Pre-stress in bracing bars and bolt
1st storey
2nd storey
3rd storey
Left bracing bar
(kN)
Right bracing bar
(kN)
Pre-stressed bolt
(kN)
Yielding friction moment
(kN m)
15·9
16·1
10·1
14·6
10·7
10·5
37·8
49·5
25·6
1·510
1·586
1·016
3. The friction pad material also showed very good performance, and no scratches were observed on
the sliding interfaces.
4. The mass of the dampers and the bracing system was about 0·15 tons—just 0·4% of the total test
steel frame mass—and is expected to be much less in actual buildings.
5. The dampers remain in excellent condition and can be used for protection against future
earthquakes.
3.
NUMERICAL SIMULATION
The computer program DRAIN-2DX (Prakash and Powell, 1994) was adopted in this study for
dynamic response simulation of the primary and friction-damped frames. In the analytical model of
the frames, girders and columns are represented by line elements with a 2% strain hardening bi-linear
model, the bracing bars were modelled by a truss element with pre-stress, and the FDDs were modelled by non-linear rigid-plastic rotational springs. The natural period of the three steel frames idenCopyright © 2004 John Wiley & Sons, Ltd.
Struct. Design Tall Spec. Build. 13, 45–54 (2004)
49
SHAKING-TABLE TEST
El Centro, 0.05g
1st floor, mm
20
w/o FDD
with FDD
0
-20
0
20
40
60
time (sec)
Kobe, 0.05g
1st floor, mm
20
w/o FDD
with FDD
0
-20
0
20
40
60
time (sec)
Chi-Chi, 0.04g
1st floor, mm
10
w/o FDD
with FDD
0
-10
0
20
40
60
time (sec)
Figure 3. Comparison of storey drift between the primary and the damped frame for input of El Centro, Kobe
and Chi-Chi earthquakes
tified through the system identification method ARX model is 0·912 s for the first mode and 0·287 s
for the second mode, respectively, and the natural periods calculated by the proposed numerical simulation method are 0·923 s for the first mode and 0·292 s for the second mode. These results show good
agreement with the results obtained by system identification.
Figure 4 compares the simulated and measured storey displacement of the primary frame excited
by the El Centro earthquake, with peak ground acceleration 0·05 g, and the inherent damping ratio is
taken as 0·02 for the primary frame structure. Figure 5 compares the simulated and measured storey
drift of the friction-damped frame by input of the Kobe (PGA = 0·18 g) earthquake and the Chi-Chi
(PGA = 0·15 g) earthquake, respectively. Those figures also show good agreement between the simulated responses of the friction-damped frame and the measured responses.
Copyright © 2004 John Wiley & Sons, Ltd.
Struct. Design Tall Spec. Build. 13, 45–54 (2004)
50
WEN-I LIAO ET AL.
Table 2. Comparison of storey drift between primary and damped frame
Max. storey drift,
with damper (mm)
Max. storey drift,
w/o damper (mm)
Reduction (%)
PGA (g)
El Centro, USA, 1940
0·36
0·26
0·05
18·96
15·06
2·31
38·5a
32·9a
13·63
50·7
54·5
83·1
Kobe, Japan, 1995
0·18
0·12
0·05
8·67
5·87
2·50
32·3a
24·2a
13·11
73·2
75·8
80·9
Chi-Chi, Taiwan, 1999
0·15
0·12
0·04
13·50
10·69
1·52
47·0a
39·7a
8·10
71·3
73·1
81·2
Earthquake
a
Results obtained by numerical simulation.
20
1 st flo o r
10
0
-1 0
-2 0
20
2n d flo or
10
0
-1 0
-2 0
30
exp.
3 rd flo or
15
simulated
0
-1 5
-3 0
0
20
40
60
time (sec)
Figure 4. Comparison of the simulated and measured storey displacement of the primary frame by input of El
Centro earthquake (PGA = 0·04 g)
4.
CAPACITY SPECTRUM ANALYSIS AND COMPARISON WITH TEST RESULTS
Another objective of this paper was to compare the displacement demand predicted by the test results
with that obtained by the pushover analysis procedure. For a building, static pushover analysis is used
to find the capacity curve and convert it to the capacity spectrum by following the procedure defined
Copyright © 2004 John Wiley & Sons, Ltd.
Struct. Design Tall Spec. Build. 13, 45–54 (2004)
51
SHAKING-TABLE TEST
10 .0
3rd floor,mm
3d floor, mm
5.0
0 .0
-5.0
-1 0 .0
0
10
20
time (sec)
30
40
10 .0
0
10
20
30
time (sec)
40
50
60
0
10
20
30
time (sec)
40
50
60
20 .0
2nd floor,mm
2nd floor, mm
0 .0
0 .0
-10 .0
0 .0
-2 0 .0
0
10
20
time (sec)
30
40
10 .0
15 .0
sim ulated
1st floor, mm
1st floor, mm
sim ulated
E xp. result
0 .0
-10 .0
E xp. resu lt
0 .0
-1 5 .0
0
10
20
time (sec)
30
40
0
(a)
10
20
30
time (sec)
40
50
60
(b)
Figure 5. (a) Comparison of the simulated and measured storey drift of the damped frame by input of Kobe
earthquake (PGA = 0·18 g). (b) Comparison of the simulated and measured storey drift of the damped frame by
input of Chi-Chi earthquake (PGA = 0·15 g)
by FEMA-273 and ATC-40. The capacity spectrum is assumed to be unique, irrespective of the earthquake ground motion input. The capacity is used to demonstrate the seismic capacity of a building
structure; its ordinate is usually the base shear V and its abscissa is usually the roof displacement D
of the building structure. Through the non-linear pushover analysis, the relationship between the base
shear V and the roof displacement D can be established, and the pushover curve converted to a capacity spectrum by the following equations:
Sa =
Sd =
V
Wa 1
(1)
D
PF1f1,1
(2)
where PF1 is the modal participation factor for the first mode, a1 is the modal mass coefficient for the
first mode, f1,1 is the modal amplitude at roof storey of the first mode, W is the seismically effective
weight of the frame structure, Sa is the spectral acceleration and Sd is the spectral displacement.
The effective hysteretic damping of the damped frame structure must be calculated in order to construct the demand curve. For the friction-damped structure, the effective hysteretic damping will be
Copyright © 2004 John Wiley & Sons, Ltd.
Struct. Design Tall Spec. Build. 13, 45–54 (2004)
52
WEN-I LIAO ET AL.
dependent on the level of deformation in the framing system. The effective hysteretic damping can be
calculated as follows:
b eff =
WD
4pWk
(3)
where WD is the energy dissipated by the primary frame and the FDD in one complete cycle of motion.
The term Wk is the strain energy stored in the primary frame at displacements equal to those used to
estimate WD. In the pushover analysis, lateral forces are applied at each storey, resulting in corresponding displacements. The strain energy can be estimated as
Wk =
1 N
 Fid i
2 i =1
(4)
where Fi is the applied storey lateral force; the distribution of the storey lateral force used herein is
proportional to the storey weight multiplied by the first mode shape amplitude of each storey; and di
is the resulting displacement at each storey.
Next, the earthquake demand per procedure defined by the ATC-40 method was obtained by linear
spectrum analyses for each earthquake record and for various damping ratios of single degree of
freedom structures. The capacity spectrum is super-imposed with the demand spectrum of the selected
earthquake record with varying viscous damping ratios. The structure roof displacement is expected
to be uniquely defined at an intersection point at which the estimated viscous damping of the demand
spectrum is equal to the effective hysteretic damping estimated by Equation (3) of the friction-damped
structure. From the procedure, the capacity spectrum of the three-storey steel frame and the demand
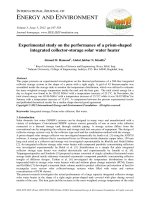
spectrum of the El Centro earthquake at PGA = 0·36 g is shown in Figure 6, predicting that the roof
displacement is about 56 mm. In this figure, the solid line represents the capacity spectrum of the
primary frame and the dashed line represents the capacity spectrum of the friction-damped frame. The
difference in spectrum acceleration of these two capacity spectra indicates the damping force provided
by the FDDs. Table 3 summarizes the comparison of the spectral displacement obtained by the shaking-
Dem and and Capacity spectra showing perform ance point
1.0
Spectral acceleration, Sa (g)
5%
3F Steel Fram e
0.8
15 %
T=1 sec
0.6
25 %
35 %
Capacity Curve for Damped Frame
0.4
Capacity Curve for Bare Frame
T=1.5 sec
0.2
0.0
0
5
10
Spectraldisplacement, Sd (cm )
15
Figure 6. Capacity spectra of the steel frames and demand spectra of the El Centro earthquake (PGA = 0·36 g)
Copyright © 2004 John Wiley & Sons, Ltd.
Struct. Design Tall Spec. Build. 13, 45–54 (2004)
53
SHAKING-TABLE TEST
Table 3. Spectral displacement predicted by FEM 273 and by shaking-table test
Earthquake
PGA (g)
Shaking-table test (mm)
FEM 273 method (mm)
0·36
0·18
0·15
48·4
22·5
32·3
52·0
14·0
24·0
El Centro, USA, 1940
Kobe, Japan, 1995
Chi-Chi, Taiwan, 1999
table test and predicted by the pushover analysis procedure. It can be seen that the spectral displacements obtained by pushover analysis are very close to the test results for the input of the El Centro
earthquake, but are about 40% and 25% underestimated for input of the Kobe and the Chi-Chi earthquakes, respectively.
5.
CONCLUSIONS
An FDD equipped in a three-storey braced steel frame was tested at the National Centre for Research
on Earthquake Engineering. The seismic response was evaluated using the shaking-table facility, simulating earthquake ground motions of far-field and near-fault types from the 1940 Imperial Valley–El
Centro earthquake (USA), the 1995 Kobe earthquake (Japan) and the 1999 Chi-Chi earthquake
(Taiwan). All tests confirmed the remarkable efficiency of the damping system in reducing lateral displacements and storey drifts of the test frame.
Numerical simulation of the seismic response of the test frames was also conducted, showing good
agreement with the test results, which is valuable for design of an actual building and parameter study
of the FDD. The predicted seismic displacement of the friction-damped frame by FEMA 273 methodology is compared with the test results, and shows good agreement for input of the El Centro earthquake, but underestimates the displacement responses for input of the Kobe and the Chi-Chi
earthquakes. These two earthquake records belong to the near-fault type earthquake, which is much
more destructive than the far-field earthquake. Thus it would be valuable to study how to improve the
capacity spectrum method to accurately predict the structure responses when subjected to near-fault
ground motions.
REFERENCES
Applied Technology Council. 1996. Seismic Evaluation and Retrofit of Concrete Buildings, Vol. 1, ATC-40. ATC:
Redwood City, CA.
Building Seismic Safety Council. 1997. NEHRP Guidelines and Commentary for the Seismic Rehabilitation of
Buildings: FEMA 273–274. BSSC: Washington, DC.
Building Seismic Safety Council. 2000. NEHRP Recommended Provisions for Seismic Regulations for New Buildings and Other Structures: FEMA 368. BSSC: Washington, DC.
Cherry S, Filiatrault A. 1990. Seismic Design Spectra for Friction Damped Structures. Journal of the Structural
Division, ASCE 16(ST5).
Constantinou MC, Reinhorn AM, Mokha AS, Watson R. 1991. ‘Displacement control device for base isolated
bridges,’ Earthquake Spectra 7(2): 179–200.
Mualla I, Nielsen LO. 2000. Parameters influencing the behavior of a new friction damper device. In Papers in
Structural Engineering and Materials, Technical University of Denmark; 49–58.
Pall AS, Marsh C. 1982. Responses of friction damped braced frames. Journal of the Structural Division, ASCE
108: 1313–1323.
Prakash V, Powell GH. 1994. DRAIN-2DX: Base Program User Guide, Version 1.10. A computer program
distributed by NISEE/Computer applications, Department of Civil Engineering, University of California,
Berkeley, CA.
Copyright © 2004 John Wiley & Sons, Ltd.
Struct. Design Tall Spec. Build. 13, 45–54 (2004)
54
WEN-I LIAO ET AL.
NOMENCLATURE
Fi = applied story lateral force
PF1 = modal participation factor for the first mode
Sa = spectral acceleration
Sd = spectral displacement
V = base shear of the frame structure
W = seismically effective weight of the frame structure
WD = energy dissipated by the structure in one complete cycle of motion
Wk = strain energy stored in the structure
a1 = modal mass coefficient for the first mode
f1,1 = modal amplitude at roof storey of the first mode
di = displacement at each story
D = roof displacement of the frame structure
Copyright © 2004 John Wiley & Sons, Ltd.
Struct. Design Tall Spec. Build. 13, 45–54 (2004)