Effect of coenzyme q10 on oxidative stress, glycemic control and inflammation in diabetic neuropathy a double blind randomized clinical trial pdf
Bạn đang xem bản rút gọn của tài liệu. Xem và tải ngay bản đầy đủ của tài liệu tại đây (297.93 KB, 9 trang )
Int. J. Vitam. Nutr. Res., 84 (5 – 6), 2014, 252 – 260
252
Original Communication
Effect of Coenzyme Q10 on
Oxidative Stress, Glycemic
Control and Inflammation in
Diabetic Neuropathy: A Double
Blind Randomized Clinical Trial
Maryam Akbari Fakhrabadi1, Ahmad Zeinali Ghotrom2, Hassan MozaffariKhosravi1, Hossein Hadi Nodoushan3, and Azadeh Nadjarzadeh4
1
Department of Nutrition, Faculty of Health, Shahid Sadoughi University of Medical Sciences, Yazd, Iran
Department of Neuroscience, Faculty of Medicine, Shahid Sadoughi University of Medical Sciences, Yazd, Iran
3
Department of Immunology, Faculty of Medicine, Shahid Sadoughi University of Medical Sciences, Yazd, Iran
4
Nutrition and Food Security Research Centre, Shahid Sadoughi University of Medical Sciences, Yazd, Iran
2
Received: May 29, 2014; Accepted: January 12, 2015
Abstract: Objective: This 12-week randomized placebo controlled clinical trial investigated the effect
of Coenzyme Q10 (CoQ10) on diabetic neuropathy, oxidative stress, blood glucose and lipid profile of
patients with type 2 diabetes. Methods: Diabetic patients with neuropathic signs (n = 70) were randomly
assigned to CoQ10 (200 mg/d) or placebo for 12 weeks. Blood samples were collected for biochemical
analysis and neuropathy tests before and after the trial. Results: There were no significant differences
between the two groups in terms of mean fasting blood glucose, HbA1c and the lipid profile after the
trial. The mean insulin sensitivity and total antioxidant capacity (TAC) concentration significantly increased in the Q10 group compared to the placebo after the trial (P < 0.05). C-reactive protein (hsCRP)
significantly decreased in the intervention group compared to placebo after the trial (P < 0.05). In the
control group, insulin sensitivity decreased and HOMA-IR increased, which revealed a significant difference between groups after the trial. Neuropathic symptoms and electromyography measurements
did not differ between two groups after the trial. Conclusions: According to the present study, CoQ10,
when given at a dose of 200 mg/d for 12 weeks to a group of neuropathic diabetic patients, did not improve the neuropathy signs compared to placebo, although it had some beneficial effects on TAC and
hsCRP and probably a protective effect on insulin resistance.
Key words: diabetic neuropathy, oxidative stress, blood glucose, lipid profile, insulin sensitivity
Int. J. Vitam. Nutr. Res. 84 (5 – 6) © 2014 Hans Huber Publishers, Hogrefe AG, Bern
DOI 10.1024/0300-9831/a000211
M. Akbari Fakhrabadi et al.: CoQ10 in Diabetes
Introduction
Type 2 diabetes is a clinical syndrome with variable
phenotypic expression rather than a single disease
with a specific etiology. The main etiology of the syndrome includes β-cell insufficiency and insulin resistance, which leads to increased blood glucose. High
blood glucose level determines the overproduction of
reactive oxygen species (ROS) by the mitochondria
electron transport chain. High reactivity of ROS determines chemical changes in virtually all cellular components, leading to DNA and protein modification and
lipid peroxidation[1]. One of the chief injuries arising
from hyperglycemia is injury to vasculature, which is
classified as either small vascular injury (microvascular disease) including retinopathy, nephropathy and
neuropathy, or injury to the large blood vessels of the
body (macrovascular disease) [2]. Diabetic peripheral neuropathy (DPN) is one of the most prevalent
long-term complications of diabetes. More than 50 %
of all diabetic patients may suffer from some degree
of neuropathy [3]. DPN is considered the cause of
considerable morbidities and can affect the quality
of life [3, 4]. It is characterized by the progressive
deterioration of nerves predisposing neuropathic foot
ulceration, Charcot neuroarthropathy, and lower extremity amputation [4]. Diabetic neuropathies are
divided into symmetrical and asymmetrical types;
symmetrical forms include distal sensory or sensory
polyneuropathy, small-fiber neuropathy, autonomic
neuropathy and large-fiber neuropathy [5]. Older age,
long duration of diabetes and poor glycemic control
are well established risk factors for DPN [6]. Chronic
hyperglycemia causes oxidative stress in tissues susceptible to complications in diabetic patients. The
mechanisms underlying oxidative stress in chronic
hyperglycemia and neuropathy development have
been studied in experimental models [7]. As a result,
ameliorating oxidative stress through treatment with
antioxidants might be an effective strategy for the
reduction of DPN [8].
Coenzyme Q10 is a quinone which was first isolated
from bovine heart mitochondria. It is also known as
ubiquinone, because it is found in virtually all human
cells. The reduced form of Coenzyme Q10 acts as
an antioxidant, combats free radicals, prevents lipid
peroxidation, and protects mitochondrial DNA. Coenzyme Q10 has been suggested to increase plasma
antioxidant activity [9].
The effect of Coenzyme Q10 on oxidative diseases
such as diabetes, coronary artery disease and hypertension has been studied [10 – 12]. There are limited
data regarding the effect of Coenzyme Q10 on diabetic
253
neuropathy [13] and oxidative stress. Therefore, the
aim of this study was to investigate the effect of Coenzyme Q10 supplementation on oxidative stress in a
group of diabetic patients suffering from neuropathy.
Materials and Methods
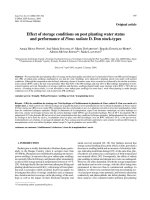
The subjects for this randomized, double-blind, placebo-controlled, parallel group study were recruited
from Yazd Diabetes Research Center, Iran. The trial
has been done from October 2011 to February 2012
(RCT code: IRCT201109127541N1) and was planned
for 12 weeks (Figure 1).
The study protocol was approved by the Ethics
Committee of Shahid Sadoughi University of Medical
Sciences, Yazd, Iran. The sampling was performed
by randomizing patients who fulfilled our inclusion
criteria. All participants were referred to a single endocrinologist. Subjects who were recruited for the trial
(blinded to group assignment) were informed about
the aims, procedures and possible risks of the study
and gave written informed consent. The inclusion criteria were age between 35 and 65 years, type 2 diabetes defined by the American Diabetes Association
criteria (1997), diabetes duration > 5 years, Michigan
Neuropathy Screening Instrument (MNSI) score ≥ 8,
impaired knee and Achilles reflex, abnormal nerve
conduction velocity and on a stable dose of medications for diabetic control in the month prior to enrolment. The patients should not have taken antioxidant
supplements during the last three months. Subjects
with liver, kidney or other neurologic diseases were
excluded.
Participants were randomly allocated in a 1:1 ratio
to receive the supplement or matched placebo daily for
12 weeks. After randomization, patients received an
unmarked bottle of capsules with either 100 mg CoQ10
(Health Burst, USA) or the placebo. They were instructed to take CoQ10 or placebo capsules twice daily
with their meals, and to leave unused capsules in the
bottles. Participants were instructed to follow their
habitual diet and physical activity and not to change
their prescribed medications and dosage. The placebo
capsule contents consisted of microcrystalline cellulose, with a similar appearance to the active capsules.
Participants and providers were blinded to patient
intervention assignment; our biostatistician broke the
code only for the final analyses without revealing any
specific assignment information to others.
Height was measured without shoes against a wallfixed tape and weight with light clothing and without
Int. J. Vitam. Nutr. Res. 84 (5 – 6) © 2014 Hans Huber Publishers, Hogrefe AG, Bern
254
M. Akbari Fakhrabadi et al.: CoQ10 in Diabetes
shoes on a platform scale with a 1.0 kg subtraction to
correct for the weight of the clothing. The body mass
index (BMI) was calculated as weight/height (kg/m2).
Peripheral blood sample was collected after a
10 hour fasting period from each subject for biochemical parameters, including fasting glucose, lipid profile,
fasting insulin, HbA1C, hsCRP and total antioxidant
capacity (TAC) at baseline and at the end of the study.
Blood glucose was measured using the glucose peroxidase method with the auto analyzer device (Echoplus,
Italy). HbA1c was measured by using a chromatography method. Total cholesterol, HDL cholesterol
and triglycerides were measured using the enzymatic
methods including cholesterol oxidase and glycerol
oxidase with the auto analyzer (Echoplus, Italy).
Fasting insulin and hsCRP in serum were measured
using the ELISA method (Dia Metra, Italy). Total
antioxidant capacity (TAC) was determined with a
method developed for the evaluation of this parameter
in blood plasma. The assay is based on the ability of
antioxidants in the sample to inhibit the oxidation of
ABTS to ABTS + by a peroxidase. The amount of
ABTS+ produced can be monitored by reading the
absorbance at 734 nm. The assay was conducted at
37 °C to be similar to physiological conditions. Temperature was controlled by a thermoelectric controller
probe model CE 2004, Cecil Instrument Ltd, United
Kingdom. HOMA Calculator ver. 2.2 (University of
Oxford) by analyzing the two parameters fasting glucose and fasting insulin: insulin sensitivity (%S) and
HOMA (insulin resistance), which is the reciprocal of
%S (100/%S), were measured.
The phenotypic neuropathy assessed in this trial
was sensorimotor distal symmetric polyneuropathy,
which was assessed by two types of measurements:
Physical assessments and nerve conduction study
(NCS) using the electromyography machine (Sierra
Wave Caldwell Company) at the onset and end of the
trial. The indices for physical assessments included
deep and superficial sensation assessments, muscle
strength and deep tendon reflexes (DTR). All assessments were performed on both sides of the body.
Superficial sensation included pain and temperature.
Pain (pin prick) was assessed using a sterile needle
for determining the length of abnormal area from
the toe to the knee. Temperature was assessed by a
cool glass and measuring the length of the unfeeling
area from the toe to the knee. The deep sensation assessments included joint position and vibration. Joint
position was assessed by moving the terminal phalanx of the great toes and coding the patient’s feeling
of the joint position. Vibration was assessed using a
128 diapason and measuring the length of the unfeel-
ing area from the toe to the knee. Reflex assessment
(DTR) of the Achilles tendon was scored as 2 (normal), 1 (decreased), or 0 (absent). Muscle strength was
scored as 5 (normal), 4 (good), 3 (fair), 2 (poor: gravity eliminated), 1 (trace: no joint motion produced)
and 0 (no muscle contraction). It is notable that we
measured the length of the unfeeling area from the
toes to the knees in order to assess the progression of
the diabetes neuropathy after the trial. The temperatures and conditions used for the assessment were the
same before and after the trial. Electrophysiological
tests included: Deep peroneal nerve (DPN) velocity,
sural nerve action potential (SNAP) amplitude and
H-reflex. In the DPN nerve conduction study (NCS),
proximal and distal stimulations were performed at
the fibular neck and ankle, respectively. The indices
were recorded from the extensor digitorum brevis
muscle. Sural NCS was performed by stimulation of
the nerve trunk at a distance of 14 cm from the lateral
ankle border where the recording electrodes were
placed. A visual analogue scale (VAS) was used to
compare the percent of improvement of neuropathy
symptoms after the trial. Each patient was asked to
give a number from 0 – 10 according to the symptoms
of neuropathy that they felt (0 = no symptoms to 10
= untolerable symptoms) before and after the trial
[(VAS2-VAS1) × 100].
In order to investigate variations in their food intake and to control diet-related confounding factors,
three 24 h dietary recalls were recorded from the patients before and after the trial. The average intake
was calculated for each macro- and micronutrient before and after the intervention. The Food Processor
II software (ESHA Research, Salem, Oregon, USA)
was used to process macronutrient and micronutrient
intakes based on the dietary reference intakes. The
physical activity was assessed by the Persian version
of the International Physical Activity Questionnaire
(IPAQ) before and after the trial.
With a sample size calculation, we expected that the
change in the level of TAC would be 0.5 μmol/L after
the coenzyme Q10 intervention; hence, the desired
power was set at 0.8 to detect a true effect. At an alpha
value equal to 0.05 and S = 0.7, a minimal sample of 30
in each intervention group and assuming any sample
loss, 35 patients were collected in each group. Data
were analyzed with the SPSS statistical software. The
distribution of the data was evaluated by the Shapiro
wilk test. Frequencies of categorical data were analyzed using the Chi-square test or Fisher’s exact test,
when appropriate. The independent T test (2tailed)
was used to analyze the mean changes between groups,
while the paired T test was used for within-group
Int. J. Vitam. Nutr. Res. 84 (5 – 6) © 2014 Hans Huber Publishers, Hogrefe AG, Bern
M. Akbari Fakhrabadi et al.: CoQ10 in Diabetes
255
Figure 1: CONSORT flow
diagram for studying the
effect of CoQ10 on diabetic
neuropathy in patients with
type two 2 diabetes.
analyses after intervention for normal data. For data
which were not normal, the Mann Whitney test was
used to analyze the median changes between groups.
Log transformation was used for some non-normal
distributed data. Adjustment was performed by ANCOVA test considering the baseline concentration as
a covariate for normal distributed data.
Table I: Baseline characteristics of participants of the
CoQ10 trial.
Variable
CoQ10
(n = 32)
p
(n = 30)
Age (y)
56.7 ± 6.4
54.8 ± 6.7
Male gender (n, %)
10 (31.25)
6 (20)
Weight (kg)
75.7 ± 10.3
77.0 ± 10.6
BMI (kg/m2)
28.7 ± 4.1
29.6 ± 3.1
Duration of diabetes (y)
16.3 ± 7.3
16.2 ± 7.2
Onset age of diabetes (y)
40.7 ± 8.1
38.4 ± 8.5
Use of oral hypoglycemic
agent (%)
9 (28.1)
9 (30)
Insulin users (%)
23 (71.9)
21 (70)
Data are mean ± standard deviation or number (%).
Results
The baseline characteristics of participants are given
in Table I. Subjects who received CoQ10 were not
statistically different from the placebo group with
regard to age, weight, BMI, duration of disease and
gender at onset of the trial. Of the 62 participants, 18
were taking oral hypoglycemic agents and 44 were
taking insulin. The two groups were similar in all of
the observed variables after randomization. Both the
CoQ10 capsules and placebo were well-tolerated, and
the overall adherence was 96 % during the trial. Prepost dietary intakes of energy, fat, protein, carbohydrate, and some antioxidant vitamins such as vitamin
C, E are featured according to intervention groups
(Table II). No significant differences were observed
between groups over time. Likewise, no differences
were observed for physical activity.
Participants in the CoQ10 group revealed a significant increase in total antioxidant capacity after
the trial (P < 0.001). There was a significant decrease
in hs-CRP in the CoQ10 group which indicated a
significant difference between groups after the trial
(P = 0.03). A significant decrease in insulin sensitivity
Int. J. Vitam. Nutr. Res. 84 (5 – 6) © 2014 Hans Huber Publishers, Hogrefe AG, Bern
256
M. Akbari Fakhrabadi et al.: CoQ10 in Diabetes
Table II: Dietary intake and physical activity levels of participants of the CoQ10 trial.
CoQ10 (n = 32)
Variable
Placebo (n = 30)
Week 0
Week 12
Week 0
1853.5 ± 115.9
1723 ± 105.0
1835.4 ± 120.8
485.8 ± 46.5
466.0 ± 51. 0
501.2 ± 48.7
482.0 ± 52.0
58.4 ± 16.7
57.5 ± 12.7
62.3 ± 18.3
61.2 ± 15.3
Fat (g/d)
48.4 ± 16.6
46.2 ± 13.4
46.3 ± 12.6
45.1 ± 11.7
Vitamin C (mg/d)
46.0 ± 5.6
47.0 ± 4.3
48.2 ± 4.7
47.0 ± 3.8
Energy (kcal/d)
Carbohydrate (g/d)
Protein (g/d)
Vitamin E (mg/d)
Physical activity (Mets /week)
Week 12
1805 ± 110.0
9.4 ± 1.1
8.9 ± 0.9
8.9 ± 1.3
8.6 ± 1.2
88.2 ± 30.2
87.5 ± 29.8
85.2 ± 27.2
85.9 ± 25.9
Data are presented as mean ± standard deviation.
Table III: Biochemical parameters before and after 12 weeks of CoQ10 supplementation.
CoQ10
FBG(mg/dl)
Before
After
P-value
Placebo
166.2 + 48.3 163.6 + 51.6
157 + 58 170.3 + 44.8
0.4
0.2
P value*
CoQ10
Placebo
P value*
0.8
0.18
LDL-c (mg/dl)
Before
After
P-value
105.3 + 21.9
105.5 + 25
0.5
108.6 + 25.5
109.1 + 21
0.5
0.8
0.3
0.1
0.4
HDL-c (mg/dl)
Before
After
P-value
32.1 + 9.9
29.9 + 4.7
0.1
33.6 + 7.1
33.0 + 9.02
0.7
0.5
0.09
HbA1c (%)
Before
After
P-value
9.05 + 1.9
8.7 + 1.8
0.2
Insulin sensitivity (%)
Before
After
P-value
78.7 + 53.6
88.5 + 71
100 + 81.4 59.56 + 45.5
0.04
0.3
0.5
0.01
TAC (μmol/l)
Before
After
P-value
7.79 + 1.99
9.04 + 2.02
< 0.001
8.23 + 2.06
8.5 + 1.41
0.2
0.3
0.8
**HOMA-IR
Before
After
P-value
2.24 + 2.16
2.11 + 2.05
0.38
2.15 + 1.71
3.33 + 3.87
0.027
0.8
0.01
**CRP (μg/ml)
Before
After
P-value
3.77 + 4.47
2.65 + 2.81
0.02
3.49 + 3.74
3.62 + 3.47
0.09
0.7
0.03
Total Cholesterol
(mg/dl)
Before
After
P-value
9.6 + 1.6
9.4 + 1.6
0.3
174.8 + 34.9 176.4 + 38.7
179.7 + 31.1 181.4 + 32.9
0.4
0.2
0.8
0.8
**Fasting Insulin
(μIU/ml )
Before
After
P-value
16.18 + 17.41 14.64 + 12.57
15.71 + 18.23 17.76 + 13.64
0.04
0.18
0.7
0.02
Data are presented as mean ± Standard Deviation*ANCOVA was used considering baseline data as covariate ** log
transformed data were used due to un-normal distribution. FBP, fasting blood glucose; CRP, c-reactive protein; TAC,
total antioxidant capacity.
(P = 0.04) and a significant increase in insulin resistance
(HOMA-IR) (P = 0.02) and fasting insulin (P = 0.04) in
the placebo group was revealed after the trial, which
showed a significant difference between groups after
the trial for these three parameters (P = 0.01, P = 0.01,
P = 0.02) (Table III). (P = 0.01). The mean changes
of insulin sensitivity, HOMA-IR and TAC were significant between groups after the trial (Table IV). No
significant changes were reported for the lipid profile.
The data for neuropathic parameters are classified in
Table V, which demonstrates no significant difference
between two groups. The results of the VAS showed
that there was no significant difference in the percentage of improvement of neuropathic symptoms in the
Q10 group compared to placebo (Q10: 34.4 + 28.2 vs.
placebo: 43.9 + 30.8 P = 0.2).
Discussion
CoQ10 is an intermediate molecule of the mitochondrial
electron transport chain. It regulates cytoplasmic redox
potential and can inhibit oxidative stress [14]. A defi-
Int. J. Vitam. Nutr. Res. 84 (5 – 6) © 2014 Hans Huber Publishers, Hogrefe AG, Bern
M. Akbari Fakhrabadi et al.: CoQ10 in Diabetes
257
Table IV: Mean and CI of changes in biochemical parameters 12 weeks after supplementation with CoQ10 vs. placebo.
Variable
Co Q10 (n = 32)
Placebo (n = 30)
p-value*
FBG(mg/dl)
– 9.10 (– 26.71_8.41)
6.64 (– 9.91_23.20)
0.1
HbA1c (%)
– 0.29 (– 0.71_0.20)
– 0.21 (– 0.61_0.20)
0.8
Insulin sensitivity (%)
12.10 (11.20_36.41)
– 19.10 (– 37.80_0.41)
0.04
HOMA-IR
– 0.13 (– 0.55_ 0.28)
1.18 (– 0.27_2.63)
0.02
Total Cholesterol (mg/dl)
4.81 (– 4.40_14.12)
5.01 (– 7.21_17.30)
0.9
LDL-c (mg/dl)
0.18 (– 0.76_8.04)
0.43 (– 8.12_9.04)
0.9
HDL-c (mg/dl)
– 2.10 (– 5.51_1.16)
0.43 (– 8.14_9.04)
0.5
TAC (μmol/l)
1.24 (0.56_1.94)
0.32 (– 0.31_0.95)
0.04
– 1.12 (– 2.15_-0.09)
– 0.47 (– 4.13_3.18)
0.13 (– 0.79_ 1.05)
3.11 (– 0.67_6.90)
0.07
0.1
hsCRP (μg/ml)
Fasting Insulin (μIU/ml )
*Student t-test
Table V: Changes in neuropathic parameters 12 weeks after supplementation with CoQ10 vs. placebo.
CoQ10 (n = 32)
variable
Pain (Cm)
Vibration (Cm)
Temperature (Cm)
Strength (score)
DTR (score)
Deep peroneal nerve
(DPN) (m/s)
Sural SNAP (μv)
H-Reflex (ms)
Placebo (n = 30)
Treatment difference (p = value)
Baseline
12 weeks
Baseline
12 weeks
19.32 ± 17.12
18.23 ± 24.75
23.25 ± 13.25
24.23 ± 32.32
0.22*
0.0 ± 14.00
0.0 ± 17.88
0.0 ± 21.50
0.0 ± 22.0
0.3**
7.75 ± 22.50
6.5 ± 21.75
20.0 ± 29.25
8.0 ± 30.0
0.2**
5.0 ± 1.0
5.0 ± 1.0
5.0 ± 1.0
5.0 ± 1.0
0.9**
1 ± 0.0
1 ± 0.0
1 ± 0.0
1 ± 0.0
0.4**
38.98 ± 5.33
4.75 ± 8.0
60.50 ± 65.5
39.50 ± 5.27
37.39 ± 6.13
4.25 ± 8.88
5.0 ± 9.50
21.50 ± 32.0
33.0 ± 62.0
38.41 ± 6.14
2.0 ± 10.75
15.50 ± 31.0
0.7*
0.4**
0.6**
*ANCOVA using baseline values as covariate, data are presented as mean ± SD. DTR, deep tendon reflexes; SNAP, sural
nerve action; H-Reflex, Hoffmann’s reflex.
**Mann Whitney test was used for analyzing the median between groups after trial; Data are presented as median + interquartile range.
ciency of CoQ10 can occur in diabetes due to impaired
mitochondrial substrate metabolism and increased oxidative stress [7, 15, 16]. Low serum CoQ10 concentrations have been negatively correlated with poor glycemic
control and diabetic complications [12, 17].
In diabetes, the beta cells of the pancreas are disposed to extreme oxidative stress which is due to
the impaired antioxidant system. CoQ10 is naturally
present in all cells. In increased oxidative stress, the
amount of antioxidants including CoQ10 is reduced,
which causes beta cell dysfunction and leads to impaired glucose and lipid metabolism [18].
Our study did not show any direct improvement in
FBS or glycated hemoglobin, but in the control group,
the insulin sensitivity decreased and the fasting insulin
and insulin resistance increased, which shows a protective effect in our intervention group during the trial.
Several trials have been performed in these fields, with
different findings. In a placebo-controlled trial, Hodgson et al. showed that CoQ10 supplementation lowers
glycated hemoglobin significantly in the intervention
group [19]. Shargorodsky et al. studied a multi-antioxidant capsule containing vitamin C (500 mg), vitamin
E (200 IU), CoQ10 (60 mg) and selenium (100 mcg)
in patients with multiple cardiovascular risk factors.
The results showed a significant decrease in HbA1c
and TG but had no influence on FBG and HOMA-IR
[20]. In an open-labeled pilot study, Mezawa et al. concluded that supplementation of ubiquinol in subjects
with type 2 diabetes, in addition to conventional antihyperglycemic medications, improves glycemic control
by improving insulin secretion [12]. In the current study,
no significant difference in the lipid profile of patients
was observed after the trial between two groups. Modi
Int. J. Vitam. Nutr. Res. 84 (5 – 6) © 2014 Hans Huber Publishers, Hogrefe AG, Bern
258
M. Akbari Fakhrabadi et al.: CoQ10 in Diabetes
et al. showed an improvement in lipid and glucose metabolism in diabetic mice. The potential mechanism was
a reduction in the peroxidation of lipids [21]. The lipid
peroxidation was not assessed in this trial.
Oxidative stress has been considered by many as an
explanation for the tissue damage that accompanies
chronic hyperglycemia. It has been reported that erythrocytes from diabetic patients contain low levels of the
reduced form of GSH, high levels of the oxidized form
(GSSG), and a 51 % reduction in the GSH/GSSG ratio
[22]. This has led to many reports of experiments designed to assess whether antioxidant drugs and supplements can be used to protect against oxidative stress in
models of type 1 and type 2 diabetes. There are limited
studies which have investigated the effect of CoQ10
on the antioxidant state and inflammatory biomarkers
in diabetes. The current study showed a significant
increase in total antioxidant capacity in the intervention group after the trial (within group comparison)
and there was a significant decrease in hs-CRP in the
intervention group after the trial compared to placebo
(between group comparisons). Lee et al. investigated
two different dosages of CoQ10 (60 vs. 150) compared
with placebo in CAD. After 12 weeks of intervention,
the results showed that the inflammatory marker IL-6
decreased significantly in the Q10 – 150 group. Subjects
in the Q10 – 150 group had significantly lower malondialdehyde levels and those in the Q10 – 60 and Q10 – 150
groups had greater superoxide dismutase activities [23].
The findings of our study showed that supplementation with CoQ10 did not improve the signs and symptoms of neuropathy. In contrast to our study, Hernandez-Ojeda et al., using a randomized clinical trial,
observed a significant improvement in neuropathic
symptoms/impairment scores, sural sensory nerve amplitude, and peroneal motor nerve conduction velocity
with 12 weeks of 400 mg/day CoQ10 compared with
baseline values [24]. One of the possible reasons for
the results may be supplementing different dosages of
CoQ10 (200 mg vs. 400 mg). On the other hand, the
discrepancy between the results may be due to the
longer duration of diabetes and using insulin in most
of our participants.
Currently, there are no treatments for neuropathy,
other than treating the diabetic condition per se, but
elevated oxidative stress is a well-accepted explanation in the development and progress of complications
in diabetes mellitus. Increased free radical-mediated
toxicity has been documented in clinical diabetes
[25] and animal models of this disease [26]. Oxidative stress is one of the most important determinants
of the development of peripheral nerve damage in
diabetic neuropathy [7]. The elevated level of toxic
oxidants in diabetic state may be due to processes such
as glucose oxidation and lipid peroxidation [27, 28].
As a result, there are several clinical trials regarding
the effect of dietary antioxidants such as α-lipoic acid
and vitamin E on diabetic neuropathy. The results of
a meta-analysis showed that treatment with α-lipoic
acid (600 mg/day i. v.) over 3 weeks significantly improves both positive neuropathic symptoms and neuropathic deficits to a clinically meaningful degree in
diabetic patients with symptomatic polyneuropathy
[29]. In the NATHAN 1 trial, the researchers evaluated the efficacy and safety of α-lipoic acid (ALA) over
4 years in mild-to-moderate diabetic distal symmetric
sensorimotor polyneuropathy. This trial resulted in a
clinically meaningful improvement and prevention
of progression of neuropathic impairments [30]. A
randomized, double-blind, placebo-controlled trial
involving 21 patients with type 2 diabetes and mildto-moderate neuropathy was performed to investigate
the effect of vitamin E on nerve function parameters.
Patients received 900 IU of vitamin E or placebo for
6 months. Both median and tibial motor nerve conduction velocity were significantly improved in the
vitamin E group compared with placebo; regardless,
no significant changes were revealed in the glycemic
parameters [31].
Coenzyme Q10 (CoQ10) is another antioxidant
and has bioenergetics and anti-inflammatory effects.
It has protective effects against apoptosis of neurons
[32] and may be considered an adjuvant therapy with
which to treat DPN. Beneficial effects of CoQ10 on
DPN have been shown in an animal model [33], and
prevented neuropathic pain related behaviors. The
analgesic effect of CoQ10 may result from anti-oxidative stress and a further decrease of stress-sensitive
and pain-related signaling pathways such as MAPK,
NF-κB and TLR4 [34, 35]. However, in some clinical
trials with short-term treatment, antioxidants lacked
therapeutic effects in diabetes and its neuropathy [3].
This is partly due to the more chronic, severe, and
extensive nature of damage to the nervous system
in human diabetes [36]. It seems that combination
therapy could provide more effective results. Blocking multiple pathway components by using several
antioxidants would in turn block multiple causes of
oxidative stress and prevent nervous system injury.
It is recommended to study the effects of a cocktail
of antioxidants in DPN.
The limitations of this study were the small sample
size, long duration of diabetes in the subjects, and the
short period of intervention, which in particular seems
to have less power to change neuropathy measures
in this limited time. The strengths of this study were
Int. J. Vitam. Nutr. Res. 84 (5 – 6) © 2014 Hans Huber Publishers, Hogrefe AG, Bern
M. Akbari Fakhrabadi et al.: CoQ10 in Diabetes
the use of human participants and accurate follow-up
with the control of some confounding factors such as
nutrient intake and physical activity.
In summary, the intake of 200 mg/d of CoQ10, may
not improve diabetic neuropathy but can reduce insulin resistance, oxidative stress, and inflammation and
also increase insulin sensitivity. Thus, future studies
should emphasize longer periods of supplementation
and larger doses in milder situations of neuropathy,
which may increase the bioactive effects of CoQ10.
Acknowledgements
This study was supported by a collaboration of the
faculty of Health and Yazd Diabetes Research Center
of Shahid Sadoughi University of Medical Sciences as
an MSc dissertation. We extend our sincerest thanks
to all subjects who participated in the study.
References
1. Piconi, L., Quagliaro, L., Ceriello, A. (2005) Oxidative
Stress in Diabetes. Clinical Chemistry and Laboratory
Medicine. 41 (9): 1144 – 9.
2. Fowler, M. J. (2011) Microvascular and Macrovascular
Complications of Diabetes. Clinical Diabetes. 29,
116 – 22.
3. Feldman, E.L. (2003) Oxidative stress and diabetic
neuropathy: a new understanding of an old problem.
Journal of Clinical Investigation, 111, 431 – 3.
4. Boulton, A.J., Vinik, A.I., Arezzo, J.C., et al. (2005)
Diabetic neuropathies a statement by the American
Diabetes Association. Diabetes Care, 28, 956 – 62.
5. Bradley, W. G., Daroff R. B., Fenichel, G. M.,
et al. (2008) Neurology in clinical practice. Fifth ed.
Philadelphia: Butterworth Heinemann. p. 2310.
6. Pop-Busui, R., Lu, J., Lopes, N., et al. (2009)
Prevalence of diabetic peripheral neuropathy and
relation to glycemic control therapies at baseline
in the BARI 2D cohort. Journal of the Peripheral
Nervous System. 14, 1 – 13.
7. Figueroa-Romero, C., Sadidi, M., Feldman, E.L.
(2008) Mechanisms of disease: the oxidative stress
theory of diabetic neuropathy. Reviews in Endocrine
and Metabolic Disorders. 9, 301 – 14.
8. Maritim, A., Sanders, R., Watkins, R.J. (2003) Diabetes,
oxidative stress, and antioxidants: a review. Journal of
biochemical and molecular toxicology. 17, 24 – 38.
259
9. Kaikkonen, J., Tuomainen, T-P., Nyyssönen, K., et al.
(2002) Coenzyme Q10: absorption, antioxidative
properties, determinants, and plasma levels. Free
radical research. 36, 389 – 97.
10. Rosenfeldt, F., Haas, S., Krum, H., et al. (2007)
Coenzyme Q10 in the treatment of hypertension: a
meta-analysis of the clinical trials. Journal of human
hypertension. 21, 297 – 306.
11. Gao, L., Mao, Q., Cao, J., et al. (2012) Effects of
coenzyme Q10 on vascular endothelial function in
humans: A meta-analysis of randomized controlled
trials. Atherosclerosis. 221, 311 – 6.
12. Mezawa, M., Takemoto, M., Onishi, S., et al. (2012)
The reduced form of coenzyme Q10 improves glycemic
control in patients with type 2 diabetes: an open label
pilot study. Biofactors. 38, 416 – 21.
13. Zhang, Y.P., Eber, A., Yuan, Y., et al. (2013) Prophylactic and antinociceptive effects of coenzyme Q10 on
diabetic neuropathic pain in a mouse model of type 1
diabetes. Anesthesiology. 118, 945 – 54.
14. Crane, F.L. (2001)Biochemical functions of
coenzyme Q10. Journal of the American College of
Nutrition. 20, 591 – 8.
15. Chew, G., Watts, G. (2004) Coenzyme Q10 and
diabetic endotheliopathy: oxidative stress and the
‘recoupling hypothesis’. Qjm. 97, 537 – 48.
16. M Victor, V., Rocha, M., Herance, R., et al. (2011)
Oxidative stress and mitochondrial dysfunction in
type 2 diabetes. Current pharmaceutical design. 17,
3947 – 58.
17. El-ghoroury, E.A., Raslan, H.M., Badawy, E.A.,
et al. (2009) Malondialdehyde and coenzyme Q10
in platelets and serum in type 2 diabetes mellitus:
correlation with glycemic control. Blood Coagulation
& Fibrinolysis. 20, 248 – 51.
18. Singh, R.B., Niaz, M.A., Rastogi, S.S., et al. (1999) Effect
of hydrosoluble coenzyme Q10 on blood pressures and
insulin resistance in hypertensive patients with coronary
artery disease. J Hum Hypertens. 13, 203 – 208.
19. Hodgson, J.M., Watts, G.F., Playford, D.A., et al.
(2002) Coenzyme Q10 improves blood pressure and
glycaemic control: a controlled trial in subjects with
type 2 diabetes. Eur J Clin Nutr. 56, 1137 – 42.
20. Shargorodsky, M., Debby, O., Matas, D., et al. (2010)
Effect of long-term treatment with antioxidants(vitamin
C, vitamin E, coenzyme Q10 and selenium) on arterial
compliance, humoral factors and inflammatory
markers in patients with multiple cardiovascular risk
factors. Nutrition & Metabolism. 7, 55.
Int. J. Vitam. Nutr. Res. 84 (5 – 6) © 2014 Hans Huber Publishers, Hogrefe AG, Bern
260
M. Akbari Fakhrabadi et al.: CoQ10 in Diabetes
21. Modi, K., Vishkarma, S., Goyal, R.K., et al. (2006)
Beneficial Effects of Coenzyme Q10 in StreptozotocinInduced Type I Diabetic Rats. IJPT 5, 61 – 6.
22. Sharma. A., Kharb. S., Chugh. S.N., et al. (2000)
Evaluation of oxidative stress before and after control
of glycemia and after vitamin E supplementation in
diabetic patients. Metabolism 49, 160 – 162.
23. Lee, B., Huang, Y., Chen, S. (2012) Effects of
coenzyme Q10 supplementation on inflammatory
markers(high-sensitivity
C-reactive
protein,
interleukin-6, and homocysteine) in patients with
coronary artery disease. Nutrition 28, 767 – 72.
24. Hernández-Ojeda, J., Cardona-Muñoz, E.G., RománPintos, L.M., et al. (2012) The effect of ubiquinone in
diabetic polyneuropathy: A randomized double-blind
placebo-controlled study. Journal of diabetes and its
complications. 26, 352 – 8.
25. Evans, J.L., Goldfine, I.D., Maddux, B.A., et al.
(2002) Oxidative stress and stress-activated signaling
pathways: a unifying hypothesis of type 2 diabetes.
Endocrine reviews. 23, 599 – 622.
26. Damasceno, D.C., Volpato, G.T., Paranhos Calderon
I.D.M., et al. (2002) Oxidative stress and diabetes in
pregnant rats. Animal reproduction science. 72, 235 – 44.
27. Davì, G., Falco, A., Patrono, C. ( 2005) Lipid
peroxidation in diabetes mellitus. Antioxidants &
redox signaling. 7, 256 – 68.
28. Memısoğullari, R., Taysı, S., Bakan, E., et al. (2003)
Antioxidant status and lipid peroxidation in type II
diabetes mellitus. Cell biochemistry and function. 21,
291 – 6.
α-Lipoic Acid Over4 Years in Diabetic Polyneuropathy. Diabetes Care. 34, 2054 – 60.
31. Tutuncu, N.B., Bayraktar, M., Varli, K. (1998)
Reversal of defective nerve conduction with vitamin
E supplementation in type 2 diabetes: a preliminary
study. Diabetes Care.11, 1915 – 8.
32. Papucci, L., Schiavone, N., Witort, E., et al. (2003)
Coenzyme q10 prevents apoptosis by inhibiting
mitochondrial depolarization independently of its
free radical scavenging property. Journal of Biological
Chemistry. 278, 28220 – 8.
33. Shi, T.J.S., Zhang, M.D., Zeberg, H., et al. (2013)
Coenzyme Q10 prevents peripheral neuropathy
and attenuates neuron loss in the db−/db− mouse, a
type 2 diabetes model. Proceedings of the National
Academy of Sciences. 110, 690 – 5.
34. Kandhare, A.D., Ghosh, P., Ghule, A.E., et al. (2013)
Elucidation of molecular mechanism involved in
neuroprotective effect of Coenzyme Q10 in alcoholinduced neuropathic pain. Fundamental & clinical
pharmacology. 27, 603 – 22.
35. Zhang, Y.P., Song, C.Y., Yuan, Y., et al. (2013)
Diabetic neuropathic pain development in type 2
diabetic mouse model and the prophylactic and
therapeutic effects of coenzyme Q10. Neurobiology
of disease. 58, 169 – 78.
36. Vinik, A.I., Maser, R.E., Mitchell, B.D., et al. (2003)
Diabetic autonomic neuropathy. Diabetes care. 26,
1553 – 79.
Azadeh Nadjarzadeh
29. Ziegler, D., Nowak, H., Kempler, P., et al. (2004)
Treatment of symptomatic diabetic polyneuropathy
with the antioxidant α-lipoic acid: a meta-analysis.
Diabetic Medicine. 21, 114 – 21.
30. Ziegler, D., Low, P.L., Litchy, W.J., et al. (2011)
Efficacy and Safety of Antioxidant Treatment With
Assistant Professor
Nutrition and Food Security Research Centre
Shahid Sadoughi University of Medical Sciences
Yazd, Iran
Tel.: 00989122185325
Int. J. Vitam. Nutr. Res. 84 (5 – 6) © 2014 Hans Huber Publishers, Hogrefe AG, Bern