Marine fisheries review , tập 72, số 01, 2010
Bạn đang xem bản rút gọn của tài liệu. Xem và tải ngay bản đầy đủ của tài liệu tại đây (11.24 MB, 66 trang )
Marine Fisheries
REVIEW
United
States
Depar tment
V o l . 7 2, N o . 1
2010
c
of Commerce
California Whaling Station
Marine Fisheries
REVIEW
On the cover:
A whaling station on the California coast showing whales being
processed. Harper’s
Weekly, volume 22,
23 June 1877, p. 477.
O
D ATM SPHER
AN
IC
C
NI
TRATION
NIS
MI
AD
NATIONAL OC
EA
W. L. Hobart, Editor
J. A. Strader, Managing Editor
D
ER
S.
CE
U.
EP
AR
TME
O
NT OF C
M
M
Articles
72(1), 2010
Commercial Whaling,
Especially for Gray Whales,
Eschrichtius robustus, and Humpback
Whales, Megaptera novaeangliae, at California and
Baja California Shore Stations in the 19th Century (1854–1899)
Nineteenth-century Ship-based Catches of Gray
Whales, Eschrichtius robustus, in the Eastern North Pacific
U.S. DEPARTMENT
OF COMMERCE
Gary Locke,
Secretary
NATIONAL OCEANIC AND
ATMOSPHERIC ADMINISTRATION
Jane Lubchenco,
Under Secretary
for Oceans and Atmosphere
National Marine Fisheries Service
Eric Schwaab,
Assistant Administrator
for Fisheries
Randall R. Reeves and Tim D. Smith
1
Randall R. Reeves, Tim D. Smith, Judith N. Lund,
Susan A. Lebo, and Elizabeth A. Josephson
26
The Marine Fisheries Review (ISSN 0090-1830) is published quarterly by the Scientific Publications Office, National Marine Fisheries Service, NOAA, 7600 Sand Point
Way N.E., BIN C15700, Seattle, WA 98115. Annual subscriptions are sold by the Superintendent of Documents, U.S.
Government Printing Office, Washington, DC 20402. The
annual subscription price is $21.00 domestic, $29.40 foreign.
Single copies are $12.00 domestic, $16.80 foreign. For new
subscriptions write: New Orders, Superintendent of Documents, P.O. Box 371954, Pittsburgh, PA 15250-7954.
Although the contents of this publication have not been
copyrighted and may be reprinted entirely, reference to
source is appreciated.
Publication of material from sources outside the NMFS is
not an endorsement, and the NMFS is not responsible for the
accuracy of facts, views, or opinions of the sources. The Secretary of Commerce has determined that the publication of
this periodical is necessary for the transaction of public business required by law of this Department. Use of the funds for
printing this periodical has been approved by the Director of
the Office of Management and Budget.
The NMFS does not approve, recommend, or endorse any
proprietary product or proprietary material mentioned in this
publication. No reference shall be made to the NMFS, or to
this publication furnished by the NMFS, in any advertising
or sales promotion which would indicate or imply that the
NMFS approves, recommends, or endorses any proprietary
product or proprietary material mentioned herein, or which
has as its purpose an intent to cause directly or indirectly the
advertised product to be used or purchased because of this
NMFS publication. POSTMASTER: Send address changes
for subscriptions for this journal to: Marine Fisheries Review, c/o Superintendent of Documents, U.S. Government
Printing Office, Washington, DC 20402. This issue, volume
72 number 1, was printed and distributed in May 2010.
This publication is available online at
/>
Commercial Whaling, Especially for Gray Whales, Eschrichtius robustus,
and Humpback Whales, Megaptera novaeangliae, at California
and Baja California Shore Stations in the 19th Century (1854–1899)
RANDALL R. REEVES and TIM D. SMITH
Introduction
Whaling ranks along with some pelagic fisheries for marine fish as one of
the world’s most widespread and ancient
forms of living resource exploitation.
It was pursued at one time or another
along nearly every human-inhabited
coastline, including the west coast of
North America. Eastern North Pacific
whale populations were subject to hunting over various time periods, at various
seasons, and at various points in their
annual migratory cycles.
In a broad analysis of global whaling,
Reeves and Smith (2006) identified no
fewer than 25 different whaling “operations” that targeted baleen whales in the
North Pacific, ranging from hunts by
R. R. Reeves is with Okapi Wildlife Associates,
27 Chandler Lane, Hudson, QC J0P 1H0, Canada
() and T. D. Smith is with the
World Whaling History Project, 1562 Purple Way,
Redding, CA 96003 (cachalotproject@gmail.
com).
aboriginal groups involving relatively
primitive methods that began many
hundreds or even thousands of years
ago to the more recent factory ship activities using modern searching, killing,
and processing methods. One of these
operations (No. 47 in the Appendix of
Reeves and Smith, 2006) was described
as “American-style shore” whaling on
the west coast of the United States that
began in 1854 and targeted primarily
gray whales, Eschrichtius robustus, and
humpback whales, Megaptera novaeangliae.
The widely held view that the population of gray whales in the eastern North
Pacific (often called the California
population or stock) has essentially
recovered from depletion by whaling
was challenged by the suggestion from
genetic analysis that there were close
to 100,000 in the North Pacific during
prewhaling times (Alter et al., 2007). If
that estimate were reasonably accurate
ABSTRACT—Shore whaling along North
America’s California and Baja California
coasts during 1854–99 was ancillary to the
offshore and alongshore American whale
fishery, which had begun in the North Pacific
in the early 1800’s and was flourishing by
the 1840’s. From its inception at Monterey,
Calif., in the mid 1850’s, the shore fishery,
involving open boats deployed from land to
catch and tow whales for processing, eventually spread from Monterey south to San
Diego and Baja California and north to
Crescent City near the California–Oregon
border. It had declined to a relict industry by
the 1880’s, although sporadic efforts continued into the early 20th century. The main
target species were gray whales, Eschrichtius robustus, and humpback whales, Megaptera novaeangliae, with the valuable North
Pacific right whale, Eubalaena japonica,
also pursued opportunistically. Catch data
are grossly incomplete for most stations;
no logbooks were kept for these operations
as they were for high-seas whaling voyages. Even when good information is available on catch levels, usually as number of
whales landed or quantity of oil produced,
it is rarely broken down by species. Therefore, we devised methods for extrapolation,
interpolation, pro rationing, correction, and
informed judgment to produce time series of
catches. The resulting estimates of landings
from 1854 to 1899 are 3,150 (SE = 112)
gray whales and 1,637 (SE = 62) humpback whales. The numbers landed should
be multiplied by 1.2 to account for hunting
loss (i.e. whales harpooned or shot but not
recovered and processed).
72(1)
and applied to the period just before
large-scale commercial exploitation
of gray whales began in the 1840’s, it
would mean that the catch record used
to model the eastern population (IWC,
1993; Butterworth et al., 2002, their
Table 2) is far from complete. In fact,
even without the DNA-based estimate
by Alter et al. (2007), concerns have
been voiced concerning the accuracy
and completeness of the catch record.
Wade (2002:85–86), for example,
stated:
“An unresolved issue regarding the
eastern North Pacific gray whale
is that it has not been possible to
reconcile the catch history from the
1800’s with the recent time series
of abundance data in a simple way.
Several attempts have been made
to project population models forwards from the 1800’s assuming
the population was at carrying
capacity prior to the start of commercial whaling in 1846, but such
projections cannot produce a trend
that agrees with the recent abundance estimates, which indicate
the population roughly doubled
between 1967 and 1988 . . . . The
catch history and current trend can
only be reconciled through fairly
dramatic assumptions, such as an
increase in the carrying capacity
from 1846–1988 of at least 2.5
times, an underestimation of the
historic commercial catch from
1846–1900 of at least 60%, or
annual aboriginal catch levels prior
to 1846 of at least three times the
level previously thought (Butterworth et al., 2002).”
1
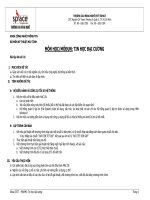
A gray whale (top) and a fin whale drawn by Charles M. Scammon to illustrate his classic book on American whaling (Scammon,
1874). These depictions of body shape and markings are far superior to many later drawings by less experienced artists. They reflect
Scammon’s extensive first-hand knowledge of the animals he hunted.
Humpback whales in the eastern
North Pacific have recovered strongly
from depletion by commercial whaling
in the 19th and 20th centuries (Calambokidis et al., 2008). In contrast to
eastern gray whales, however, the catch
history of humpback whales in the North
Pacific has been given relatively little attention in the literature. Rice (1978:29)
believed that the total population was
only “on the order of 15,000 prior to
1905” although he gave no rationale
for this conclusion. His tally of modern
catches in the North Pacific, totaling
28,000 from 1905 to 1965, may be reasonably accurate, but Rice’s estimate of
premodern humpback catch levels and
abundance must be negatively biased
2
to a considerable degree as basin-wide
abundance in the mid 2000’s was close
to 20,000 and the population was still
growing at about 5% per year (Calambokidis et al., 2008).
The main purpose of this paper is to
review the history of commercial shore
whaling along the coasts of California
and Mexico and to estimate catches of
gray and humpback whales by 19th century shore whaling. It represents a first
attempt to create a complete time series
of catches of both species by pre-modern
commercial shore whalers in this part of
their range.
The report of the 1990 Special Meeting of the IWC Scientific Committee
on the Assessment of Gray Whales
recommended that further searches be
carried out for “missing shore-based
commercial catches” and that the
values used to account for whales killed
but unprocessed (“struck-and-lost”)
be reconsidered (IWC, 1993:252). It
acknowledged that the commercial
component (at least) of the catch series
used at the meeting to model the eastern
North Pacific population (Butterworth
et al., 1990, 2002, based mainly on
Lankester and Beddington, 1986) was
likely incomplete and needed careful
reevaluation. In this paper, we attempt
to update and improve the catch record
for gray whales.
With regard to humpback whales,
Rice (1978) acknowledged that the
Marine Fisheries Review
effects of “old-style” ship-based whaling had not been assessed, noting only
the slightly more than 200 ship-based
humpback kills plotted in the North
Pacific by Townsend (1935). In his
estimate of pre-whaling abundance for
this species, Rice essentially dismissed
the 19th century ship-based catches, as
well as the catches by 19th century shore
whalers. He stated that although 17 stations along the California coast were
active at various times between 1854 and
1900, they “depended on gray whales,
and few if any humpbacks were killed.”
Here, we infer that substantial numbers of humpback whales were taken
by the 19th century shore whalers
in California and Baja California. A
separate study of ship-based whaling for
humpback whales in the eastern North
Pacific during the 19th century is needed
before further inferences can be made
concerning the historical abundance of
this species.
Materials and Methods
Data Sources and General
Features of the Fishery
This study was guided and informed
by two major reviews of 19th century
shore-based whaling in California and
Mexico—a master’s thesis (Nichols,
1983; supervised by D.A. Henderson)
and a book chapter (Sayers, 1984). Despite the nearness of their publication
dates, these two reviews seem to have
been prepared independently. They are
largely complementary, but not always
consistent in regard to the data they contain. Both relied heavily on a handful of
standard published sources, specifically
Scammon (1874) and Henderson (1972,
1984), as well as Townsend (1886),
Jordan (1887a, 1887b), Collins (1892),
and Starks (1922). Although we consulted much of that work ourselves, we
also assumed that the station-by-station
reviews and analyses by Nichols and
Sayers had incorporated most of it, particularly with respect to gray whales.
According to Sayers (1984), the more
northern stations along the California
coast were established mainly with
humpback whales as targets, whereas
the southern stations were established
72(1)
mainly to take advantage of the predictable seasonal availability of gray
whales. Many of the stations took a
mix (often seasonally determined) of
both species as well as right whales,
Eubalaena japonica, whenever an
opportunity became available. Blue
whales, Balaenoptera musculus, and fin
whales, B. physalus, were taken rarely,
and sperm whales, Physeter macrocephalus, even less often (Starks, 1922;
Bertão, 2006:100, 106).
The taking of both humpback whales
and gray whales is a typical feature
of shore whaling in the eastern North
Pacific going back all the way to the
prehistoric Makah (Huelsbeck, 1988).
This mixture often causes uncertainty in
allocating catches (including oil production values) between the two species.
Adding to the uncertainty is the fact that
gray whales may have been intentionally
or mistakenly reported as humpbacks in
some modern whaling statistics (Scheffer and Slipp, 1948:310).
Methods of Catch Estimation
Information on shore-based whaling
in Mexico (Baja California) and California was compiled from the sources
identified above. In addition to the
descriptions of activities at each station
(or group of geographically proximate
stations), data were assembled systematically on years of operation, numbers
of men and boats employed, numbers of
whales secured or quantities of whale
oil landed, and whenever possible, the
species breakdown of the catch (see Appendix). It proved possible to construct
nearly complete datasets for a few of the
stations, but for most, numerous gaps
exist. In fact, in some instances little is
known beyond the years of operation,
and even then it is sometimes impossible to be certain of years when the
station was and was not fully manned
and functioning.
Several methods of interpolation were
developed to account for uncertain and
missing landings. When landings were
reported as numbers of whales, we assumed that those values were known
without error. In some instances, different sources reported different numbers taken in a given season for that
particular station. For example, there
were 48 instances when both Nichols
(1983) and Sayers (1984) had data on
the number of whales taken, and in
25 of these instances, the values were
identical. Nichols’s values averaged approximately one whale (0.98, SE = 0.90)
fewer than Sayers’s and ranged from 15
fewer to 18 more, but there appeared to
be no systematic differences between
the two sources.
We assumed in all cases that any
difference was due to omission, i.e. the
lower value was a result of incomplete
information available to either Nichols
or Sayers, and therefore used the larger
value. When the only value reported
was the quantity of whale oil landed,
we estimated the number of whales by
dividing reported barrels by average
barrels of oil per whale from the data for
that station in years when both numbers
and oil were reported. Uncertainty associated with those estimated numbers
of whales was approximated using the
observed variance in the number of
barrels per whale, following a Taylor’s
series expansion (Seber, 1973). Whenever a species other than gray whales
or humpback whales (e.g. right whales)
were specified in the source, those individual whales or the corresponding
quantities of oil were subtracted before
estimation. Also, as explained later, it
was assumed that, on average, the oil
yield from gray whales and humpback
whales was essentially the same and
therefore we made no attempt to convert
oil quantities to whales landed for the
two species separately.
We assumed that whaling continued
in years when there were no reported
landings unless we had information
indicating that operations had been
suspended or interrupted. The landings
in such years were assumed to have been
similar to those reported in surrounding
years. Two cases were considered. The
first was when there were short gaps in
the data or longer gaps but where the
landings before and after a gap were
similar. Here we interpolated the missing value as the average of landings for a
period of time surrounding the gap.
To estimate the uncertainty associated with these interpolated values,
3
we treated the reported landings in the
selected time period as a sample from a
uniform distribution. Because some of
the landings are known only with uncertainty (i.e. estimated from reports on oil
production), we estimated the half width
of the uniform distribution (w, Equation
1) for a selected time period using the
second-order moment estimator (Benšic´
and Sabo, 2007)
(
w = 3( s2 − σ 2 )
)
12
where s is the standard deviation of the
reported landings in the selected time
period and σ2 is the assumed constant
variance about each year’s landings that
were reported in barrels of oil. We estimated σ2 as the mean of the variances of
the reported landings in the period. The
variance of the interpolated landings
value then becomes w2/3.
The second case was when the
average reported landings before and
after a gap differed substantially. We
constructed a hypothetical example
to describe how we applied the above
uniform distribution approach to this
case. Figure 1 shows the hypothetical
data, with reported catches in years 1
and 2 (points labeled A), nine years with
no catch reports, and reported catches
in years 10, 11, and 12 (points labeled
B). In this example, we assumed that
catches for years 2 and 11 were reported
in numbers of whales and those for
years 1, 10, and 12 were reported in
barrels of oil and converted to whales
as described above. For these last three
values, the estimation errors are depicted by the vertical bars of length one
standard deviation above and below the
individual points.
We interpolated the missing values
(dots in Fig. 1) linearly from the average
levels in the earlier and the later time
periods (averages of the A and B points,
denoted as X in Fig. 1). The vertical
bars above and below the X’s denote the
width of the respective uniform distributions estimated (2w, Equation 1) from
the landings in the two time periods.
We estimated the uncertainty about the
interpolated values as the variance of
a uniform distribution from the lower
Figure 1.—Diagram illustrating the method used to estimate uncertainty of interpolated values for landings across years when there were gaps in reporting. The A and
B points are the reported landings from two periods with data that surround a gap in
time without data. The length of the vertical bars above and below the interpolated
landings denote the uncertainty assigned to those landings, and are one standard
deviation of a uniform distribution between the upper and lower dashed lines (see
text for details).
4
limit of the distribution of the A points
to the upper limit of the distribution of
the B points (represented by the horizontal dashed lines). The vertical bars
above and below the interpolated points
are then the standard deviations of the
uniform distribution so formed. In the
event that landings are available for only
one year before or after the gap in reports, the uniform distribution has width
equal to the difference between the two
average values because no information
on variability is available.
For stations with too few reported
catches to allow this procedure, we
projected the catch as the average catch
per season at the seven well-reported
stations. The variance of those projected catches was taken as the variance of a uniform distribution over the
range of the catches per season using
Equation 1. We estimated the numbers
of gray whales and humpback whales
separately based on the ratio of these
two species in instances where the
species identity of the whales taken
was reported.
Results
The data on landings from 1854
to 1899, assembled from a variety of
sources, include at a minimum whether
an individual station operated in a given
year, and at maximum the information
on whales landed (rarely by species),
barrels of oil, men employed, and boats
involved (see Appendix). In addition to
such information, the Appendix contains
notes to clarify or augment aspects of the
basic data. A pronounced feature of this
material is the highly variable level of
completeness across stations, with seven
of the stations having substantially more
data than the other ten.
Species Ratios
Scammon (1874:248–250) stated,
“The whales generally taken by the
shore parties are Humpbacks, and
California Grays; but occasionally a
Right Whale, a Finback, or a Sulphurbottom (blue whale) is captured.” Too
little data was available to us for reliable estimation of species proportions
at most of the shore stations. That said,
the data reviewed here support Scam-
Marine Fisheries Review
mon’s statement that catches of right,
blue, and fin whales were very rare.
Right whales present a special problem because they were highly prized,
and their capture always promised a
windfall of oil and whalebone (baleen).
Therefore, it is reasonable to assume
that any seen, at any station, would have
been chased and killed if possible. We
further suspect that right whales were
more likely to be reported because of
the tendency for news of a right whale
catch to reach print as a notable event,
whereas it is much more likely that
catches of the other species would have
been reported simply as “whales” or
their oil would have been added to the
total produced, without comment.
Based in part on the statement by
Sayers (1984) that southern stations
were more oriented toward catching
gray whales and northern stations
toward humpback whales, and in part
on other notations in the literature that
give the same impression, and because
of the limited number of species identifications in the catch statistics and other
data, we stratified the whaling stations
latitudinally into four geographic regions as indicated in the Appendix. We
tallied the numbers of gray and humpback whales reported for the stations in
each region (Table 1). This tally generally supports the suggestion by Sayers
that the proportion of gray whales was
lower in the two more northern strata,
although the information available for
the North stratum was extremely limited. The proportions shown in Table
1 were used to estimate the numbers
of gray whales and humpback whales
landed, by year.
Estimated Landings
by Station and Region
In this section, the information on
whaling effort and catch results is summarized for the four regions, starting
from the southernmost stations and
working northward (Fig. 2). In those
instances where direct estimates of
landings were possible from the available data, those estimates are reported
here. Projected landings for other stations are then discussed in a separate
(later) section.
72(1)
Figure 2.—Principal place names mentioned in the text (prepared by Beth Josephson).
South
Baja California, Mexico
Sayers (1984) identified only three
sites in Baja California where shore
whaling was conducted. The most
significant were at Punta Banda and
Santo Tomas where San Diego-based
whalemen operated (though not continuously) from 1868 to 1885. According to
Nichols (1983:164), another whaling
Table 1.— Numbers of gray whales and humpback
whales reported for shore stations in four latitudinally
defined regions, with the proportion gray (Pg), proportion humpback (Ph = 1-Pg), and standard error of the
proportions (SEp).
Region
South
S Central
N Central
North
Gray
Humpback
Pg
Ph
SEp
70
36
45
0
4
1
37
1
0.95
0.97
0.55
0.0
0.05
0.03
0.45
1.0
0.026
0.027
0.055
0.0
concern had operated at Santo Tomas
in 1864 and 1865.
5
Sayers (1984) appendix (p. 156)
indicates a catch of 5 whales at Punta
Banda/Santo Tomas in 1860 but without
any details. This presumably is different from the on-shore tryworks set up
in 1860–61 on the eastern shore of San
Ignacio (Ballenas) Lagoon (La Freidera,
or The Trypot or Tryworks; Henderson,
1972:100, 157). Although it is known
that there was a shore station at Belcher
Point, ca. 6–7 km (4 mi) north of the
entrance of Magdalena Bay, there is little
documentation concerning its operations
(Webb, 2001).
Examination of a whaling voyage
logbook from the late 1850’s (Saratoga,
1856–60) revealed that at least one
“shore party” was active in Magdalena
Bay at that time (also see Henderson,
1972:100, 126–127; 1975; 1984:170).
Our interpretation is that the activities
of such groups, likely consisting of
men who had deserted whaleships, are
not subsumed as part of catches summarized by Sayers (1984) and Nichols
(1983). On 18 January 1858 a trypot and
three empty casks from the Saratoga
were towed to shore where a group of
“Spaniards” had agreed to “take the
oil from the carcasses, on halves.” We
interpret this to mean that the team on
shore received whale carcasses after the
blubber had been stripped for cooking
aboard the vessel, and that for their
efforts they were allowed to keep half
of the oil produced from the flensed
carcasses. This was called “carcassing”
(Henderson, 1972:127). On 23 January
1858 the Saratoga logbook notes:
“The shore party of Spaniards came
off and assisted us [in cutting in a
gray whale taken the day before].
They try out the carcases for us
and two other ships on halves . . . .
They keep a sharp look out on
shore with a telescope and when
they see either of the three ships
cutting, immediately put off in their
boat, and when we have finished
cutting, tow the carcase on shore
to their works.”
On 31 January, the logbook records
that the Saratoga received 6 bbl of oil
and “settled up” with the shore party,
25
Baja
10
15
cc
c
t
t
t
t
t
t
t
t
t
m
c
b
c
c
t
t
t
t
t
t
t
b
0
5
Numbers of Whales
20
b
1850
1860
1870
1880
1890
1900
Year
Figure 3.—Whales landed at Baja California shore stations, showing values reported
as whales (c) or barrels of oil (b), and for years without data, interpolations—either
the mean of adjacent data points (m) or, for multiyear gaps, linearly increasing or
decreasing values (t) pegged to the means of data points before and after the gaps.
Vertical bars denote one standard error of estimation above and below each year’s
data value or interpolated value (see text for details).
6
as did the other two ships. The shore
camp was dismantled on 19 February,
and there is no further mention in the
Saratoga logbook of oil received from
the camp.
Considerable uncertainty surrounds
the species composition of catches at the
Baja California shore stations. Jordan
(1887a:60) described Santo Tomas as a
good site for taking sperm whales, and
another source claimed that Punta Banda
was seasonally variable, with gray
whales taken between 10 December and
10 April and afterward humpbacks “further down the coast” (Sayers, 1984:150).
A right whale was struck and lost at
Punta Banda in February 1871 (Sayers,
1984:149). Gray and humpback whales
were not reported separately in any of
the Baja California data. Further, none
of these stations appears to have lasted
for long or to have accounted for large
numbers of whales, < 20 whales and at
most 700 bbl of oil, all told, in any single
year (Sayers, 1984:156). The estimated
landings of gray whales and humpback
whales, combined, total 248 whales (SE
= 21) over the 26 years that we know or
presume shore stations operated in Baja
California (Fig. 3). These were primarily
gray whales (236, SE = 21), with only a
few humpbacks (12, SE = 7).
San Diego, Calif.
Whaling in the San Diego area took
place without any major interruption
from 1858–59 through 1885–86, although there is an 8-year gap in the
documentation (no local newspapers
published) from 1860 to 1867 (Sayers,
1984; May, 2001). Various sites were
used at different times to launch the
boats and try out the oil—La Playa,
Zuniga Point, Ballast Point, “Whaler’s
Bight” on North Island, and Point Loma.
As many as four companies were operating at times during the 1860’s (Sayers,
1984:146).
In the San Diego area, 19th century
whaling may have involved humpbacks
to some extent, but given the inshore
localities of the stations, the period
photographs and illustrations of the
fishery (May, 2001), and the known
present-day distribution and occurrence
of the two species, the vast majority
Marine Fisheries Review
72(1)
40
San Diego
c
30
c
c
20
c
t
t t t t t c
c
b
c
c
c
c
10
Numbers of Whales
c
c
t
t
t
t
t
t
c
c
c
c
0
would have been gray whales, which
is consistent with the regional proportions indicated in Table 1. A newspaper
description from early January 1873
describes how the whaleboats were
deployed from just inside the mouth of
San Diego harbor to “lie in wait” in the
kelp to intercept passing whales (May,
2001:11). At least one right whale was
taken, accounting for fully half of the
oil (150 out of 300 bbl) produced at the
station in the 1885–86 season (Sayers,
1984:155). A 90 bbl whale reported as
taken in the winter of 1868–69 (Nichols, 1983:99) also may have been a
right whale.
Some fragmentary, and not always
consistent, data are available on oil
returns and numbers of whales landed.
In 1871, at a time “when San Diego’s
whale hunting industry was most successful,” the combined production by
two companies working at three stations (Santo Tomas and Punta Banda
in Mexico and Ballast Point in San
Diego) amounted to 550 bbl of oil, “a
record” (May, 2001). Yet a newspaper
article in May 1873 reported that those
same two companies working at the
same three stations landed 24 whales
producing 980 bbl of oil, described
as “a very light catch for these two
companies” (Sayers, 1984:146). It is
difficult to reconcile such conflicting
statements.
As indicated earlier, in some years
the landings attributed to San Diego
shore stations included oil or whales
from outposts in Baja California.
Also, in at least one year (1883–84)
the whales processed at a shore station were actually taken by a whaling
vessel, the Sierra, and towed to shore
(Sayers, 1984:155). Nichols (1983:94)
cites a report that the ship Ocean
of New Haven spent the season of
1860–61 anchored inside San Diego
Bay functioning as a floating land station, with whaleboats going outside
the harbor to catch whales and then
towing the whale carcasses to the ship
for processing. According to Starbuck
(1878:566–567) the Ocean sailed in
August 1858 and sent home 64 bbl of
sperm oil, 1,103 bbl of whale oil, and
1,652 lb of baleen before being sold in
1850
1860
1870
1880
1890
1900
Year
Figure 4.—Whales landed at San Diego, California, shore stations, showing values
reported as whales (c) or barrels of oil (b), and for years without data, linearly interpolated values (t) pegged to the means of data points before and after the gaps. Vertical bars denote one standard error of estimation above and below each year’s data
value or interpolated value (see text for details).
San Francisco for merchant service.
The 500 bbl of whale oil obtained from
12 whales (presumably gray whales) in
San Diego in April–May 1860 (Nichols,
1983:106) apparently was not included
in Starbuck’s table of returns.
The estimated landings of gray and
humpback whales, combined, total 453
whales (SE = 28) over the 29 years that
the stations in San Diego are known to
have operated (Fig. 4). Most were gray
whales (431, SE = 29), with only 23
humpbacks (SE = 12).
Los Angeles, Calif.
Shore whaling in and near Los Angeles harbor began in 1860–61 and continued sporadically until the mid 1880’s,
using two different sites (Deadman’s
Island in San Pedro Bay, and Portuguese
Bend) (Sayers, 1984:142–144; Bertão,
2006:151–157). All evidence indicates
that the catch consisted mostly of gray
whales (a right whale was taken in
March 1861; Sayers, 1984:142). The estimated landings of gray and humpback
whales, combined, total 398 whales (SE
= 20) over the 26 years that the stations
are known to have operated (Fig. 5).
Most were gray whales (378, SE = 21),
with only 20 humpbacks (SE = 10).
Goleta (Santa Barbara), Calif.
At least three different companies
operated a small shore station at Goleta
between 1867–1880 but information
on catches is extremely sparse (Sayers,
1984:141–142). Up to 450 bbl of oil
was obtained in one winter season
(Nichols, 1983:150). Apparently, nearly
all of the whales taken at this site were
gray whales. As recounted by Bertão
(2006:189) regarding one of the companies: “The company hunted gray whales
from December to April. The station’s
location prevented a hunt for humpback
whales, which kept outside the Channel
Islands.” No direct estimates of landings
were possible for this station.
Point Conception–Cojo Viejo, Calif.
This site was used for shore whaling
initially for about 7 years, from 1879–80
to 1885–86. Both gray and humpback
whales may have been taken regularly,
but with a strong preponderance of gray
whales according to the limited data
available. A right whale was taken in
7
20
c
m
t t t t t
t t t t t
t cc
cc
c
10
Numbers of Whales
30
Los Angeles
t t
c
t t
t t
0
c
1850
1860
1870
1880
1890
1900
Year
Figure 5.—Whales landed at Los Angeles, California, shore stations, showing values
reported as whales (c), and for years without data, interpolations—either the mean
of the adjacent data points (m) or, for multiyear gaps, linearly decreasing values
pegged to the means of data points (t) before and after the gaps. Vertical bars denote
one standard error of estimation above and below each year’s data value or interpolated value (see text for details).
1884–85 (Townsend, 1886). Relatively
good catch data are available. In the
one season with detailed information
(1879–80), 4 humpbacks were taken in
October, followed by 5 grays in December, 10 grays in January, and 1 gray in
February for a total of 16 grays (Jordan,
1887a). The humpbacks produced 148
bbl of oil, and the total for the station
between April 1879 and February 1880
was 544 bbl, implying that the grays
accounted for 396 bbl and thus about
25 bbl/whale. Townsend’s (1886) reported totals for other years were 25
grays in 1883–84, 18 in 1884–85 (plus
the right whale), and 11 in 1885–86.
Although whaling at Point Conception
apparently was suspended between
1885–86 and 1892, some kind of operation existed in at least November 1892
when a large whale was taken (Bertão,
2006:196–197). The estimated landings
of gray and humpback whales, combined, total 132 whales (SE = 8) over
the 14 years that the station is known to
have operated (Fig. 6). Most were gray
whales (126, SE = 7) and only a few
were humpbacks (7, SE = 3).
South–Central
30
Point Conception
20
c
t
t
15
c
c
c
10
Numbers of Whales
25
c
5
c
c
0
a
1850
1860
1870
1880
1890
1900
Year
Figure 6.—Whales landed at the Point Conception shore station, showing values
reported (c) or assumed (a) as whales, and for years without data, linearly interpolated values (t) pegged to the means of data points before and after the gap. Vertical
bars denote one standard error of estimation above and below each year’s data value
or interpolated value (see text for details).
8
San Luis Obispo (Port Harford), Calif.
This station operated, apparently
without interruption, from 1868–69
(possibly as early as 1867; Bertão,
2006:171) to 1887 (Nichols, 1983;
Sayers, 1984). Both gray and humpback
whales were taken although most of the
catch consisted of the former, especially
after the mid 1870’s when summer
whaling was abandoned (Bertão, 2006,
p. 172). The reported total catch for
three seasons was 9 in 1878–79, 11 in
1879–80, and 4 (all grays) in 1880–81
(Jordan, 1887a:60; Nichols, 1983:148).
Catches were modest in the final
years—6 grays in 1883–84, 4 grays in
1884–85, 3 grays in 1885–86, and 5
(species unspecified) in 1886–87 (Nichols, 1983:149). The estimated landings
of gray and humpback whales, combined, total 96 whales (SE = 12) over
the 20 years that the station is known
to have operated (Fig. 7). However,
according to Bertão (2006:173), 30
or more whales were taken in a single
Marine Fisheries Review
72(1)
14
12
10
8
c
t
6
t
t
t
t
c
t
c
c
t
4
Numbers of Whales
c
t
t
c
c
2
t
c
t
0
a
1850
1860
1870
1880
1890
1900
Year
Figure 7.—Whales landed at the San Luis Obispo, California, shore station, showing values reported (c) or assumed (a) as whales, and for years without data, linearly
interpolated values (t) pegged to the means of data points before and after the gaps.
Vertical bars denote one standard error of estimation above and below each year’s
data value or interpolated value (see text for details).
25
c
San Simeon
c
c
c
20
c
c
c
15
c
c
c
c
c
c
c
c
mm
c
mm
10
Numbers of Whales
m c
c
c
c
cc
m
c
5
San Simeon, Calif.
The operation at San Simeon is
unique among the many whaling enterprises along the California coast in that
it lasted without interruption for 27 years
(1865–92) and records of the number of
whales taken are almost complete, with
only a few years missing in the 1880’s
(Nichols, 1983; Sayers, 1984:140, 154).
Except for three right whales taken in
1884–85, the entire catch consisted of
gray and humpback whales, and the ratio
appears to have been at least three grays
to one humpback (Nichols, 1983:136
reported that the station “depended
almost entirely upon gray whales”).
The total reported catch for 23 of the 27
years was 350 whales (not counting the
3 right whales; Nichols, 1983:135–141;
Sayers, 1984:154).
In 1888 (actually 1888–89), 14
whales were taken (at least 7 of them
between 1 January and 9 March and
therefore were almost certainly gray
whales; Nichols, 1983:137). Most of
the catch at San Simeon consisted of
gray whales migrating southward from
December to February according to
Townsend (1886), who further noted
that the (smaller) catch during the
northward migration (the “up season”)
was skewed towards males since mothers with young calves migrated farther
from shore and thus were less readily
available. At least during the late 1860’s
and 1870’s, some of the men and boats
associated with the San Simeon station
were based at Piedras Blancas Point
(Bertão, 2006:169–170).
The estimated landings of gray and
humpback whales, combined, total 441
whales (SE = 8) over the 30 years that
the station is known to have operated
(Fig. 8). Most were gray whales (428,
SE = 14) and only a few were humpbacks (13, SE = 12). Although a small
whaling operation existed at San Simeon
from around 1894 to 1914, when the
San Luis Obispo
c
0
year at this site, apparently during the
1860’s and early 1870’s. If this report
is accurate, our estimate is probably
negatively biased. In any event, most
of the whales taken at this station were
gray whales (92, SE = 12) and only a
few were humpbacks (3, SE = 3).
1850
1860
1870
1880
1890
1900
Year
Figure 8.—Whales landed at the San Simeon, California, shore station, showing
values reported as whales (c), and for years without data, interpolated values from
the mean of adjacent data points (m). Vertical bars denote one standard error of
estimation above and below each year’s data value or interpolated value (see text
for details).
last whale was taken there using 19th
century open-boat methods (Bertão,
2006:169), we have not included that
period in our estimate.
9
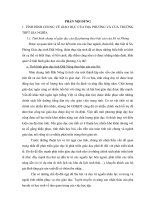
Lithograph of a whaling station at Carmel Bay drawn by Charles M. Scammon (Scammon, 1874: plate XXVII).
North–Central
Monterey Bay Area, Calif.
We describe the operations at several
sites under this heading, including Point
Sur, Carmel (Point Lobos), Monterey,
and Santa Cruz (Soquel Point, Point Año
Nuevo, and Davenport Landing).
Point Sur The operation here, some
30 km south of Monterey, lasted for
only two seasons and may have been, in
effect, an outpost of the Carmel operation (below). The total reported catch
consisted of 1 gray whale and 1 blue
whale in 1877–78; 3 grays, 1 humpback, and 1 right in 1878–79 (Nichols,
1983:153; Sayers, 1984:154; Bertão,
2006:104). These reports of landings
appear to be complete.
Carmel This station was established
at Point Lobos in 1862 and operated
10
until 1884 (Nichols, 1983:121–122).
Despite such a long (and presumably
continuous) period of operation, however, catch data are very sparse. The catch
in 1879–80, the only year for which
statistics are available, consisted of 3
humpbacks, 3 grays, and 1 fin whale,
together producing a total of 200 bbl of
oil (Nichols, 1983:123). Given the seasonal nature of the whaling—October to
March—it can be inferred that migrating
gray whales were the main targets of the
2–4 whaleboats and 17-man contingent
at Carmel (Scammon, 1874:250; Nichols, 1983:121, 125). No direct estimates
of total landings were possible from the
available data.
Monterey This was the site of
the first commercial shore whaling
operation on the west coast of North
America. The operation was probably
initiated in 1854 and persisted (at least
in relict form) into the early 20th century
(Sayers, 1984:134). Initially the focus
was on humpback whaling rather than
gray whaling although both species
were taken (Bertão, 2006). Watkins
(1925) indicated that the Portuguese
Whaling Company produced about 800
bbl of “humpback oil” annually in three
years, 1856–58, but another (newspaper)
source stated that 24 “whales of all
kinds” were taken by that company in
Monterey Bay between April 1854 and
November 1855 (Nichols, 1983:65). The
specified catch in 1854, from newspaper
sources (Sayers, 1984:153), consisted
of 9 humpbacks, 5 grays, and 4 killer
whales, Orcinus orca. In the late 1850’s,
with the introduction of bombs and
harpoon guns, the emphasis apparently
shifted more toward gray whales (Nich-
Marine Fisheries Review
1Although Cooper (1871) claimed that mainly
gray whales were being taken at Monterey when
he visited there in August–September 1861, and
Henderson (1972:27) judged him to be a reliable
source, we are skeptical, given the season and
the fact that humpback whales were otherwise
known to be the main species hunted there in the
summer months.
72(1)
60
c
c
cc
c
m
40
c
b
cccc
20
Numbers of Whales
80
Monterey
c
m m
b
mmm mmm
c
c
b
c
mmc
c
cc
mmmmmmmmmmmm
aaaa
c
ca
0
ols, 1983:66).1 Newspapers referred
specifically to a gray whale struck but
lost in December 1870 (Bertão, 2006:
22), 1 taken in March 1872 (Bertão,
2006:92–93), and 2 taken in January
1880 (Bertão, 2006:62). There were
years (e.g. 1869) when large shoals
of sardines in Monterey Bay attracted
numerous humpback whales, leading
to exceptionally large catches of them
(Bertão, 2006:78–79). Catches of right
whales were reported in 1856, 1859,
1873, and 1879–80 (Sayers, 1984:153;
Nichols, 1983:75).
In the late 1850’s and early 1860’s at
least three and possibly four different
companies operated out of Monterey,
each with a complement of at least two
whaleboats and 12 crew members (Nichols, 1983:69–70; Sayers, 1984:133). Although whaling in Monterey had become
unprofitable by the late 1880’s and in
fact may have been suspended for at
least a few years (Nichols, 1983:70–71;
Bertão, 2006:84–85), a new company
was established in about 1895, which
lasted for 2–3 years (Nichols, 1983:71).
Another operation (2 boats, 17 Azorean
whalemen) that began in early 1896 and
continued into the spring of 1898 (3
seasons) took “several dozen” whales
per year (Lydon, 2001; also see Berwick,
1900; Bertão, 2006:86–90). Although
most of the catch is said to have consisted of humpbacks, the seasonality
and avowed dependence on the nearshore migration (e.g. Lydon, 2001:26)
implies that grays also figured to some
extent in the catch even in these late
years. The equipment was transferred
to Point Lobos in Carmel in the summer
of 1898, and a joint Azorean–Japanese
operation continued whaling there for
two more seasons—winter 1898–99 and
1899–1900 (Lydon, 2001).
Catch data are fragmentary, with
information only on number of whales
secured for 4 years, only on oil returns
1850
1860
1870
1880
1890
1900
Year
Figure 9.—Whales landed at Monterey, California, shore stations, showing values
reported as whales (c) or barrels of oil (b), and for years without data, interpolated
values from the mean of adjacent data points (m). Vertical bars denote one standard
error of estimation above and below each year’s data value or interpolated value (see
text for details).
for 8 years (not counting 1873 when
175 bbl was obtained, apparently all or
mostly from a large right whale), and on
both whales and oil for 5 years (Nichols,
1983:75; Sayers, 1984:153). The estimated landings of gray and humpback
whales, combined, total 884 whales (SE
= 46) over the 46 years that the stations
in and around Monterey are known to
have operated (Fig. 9). Although slightly
more than half of these were gray whales
(477, SE = 55), substantial numbers of
humpbacks were also taken (407, SE =
53). It is important to note a typographical error in the literature suggesting a
much higher catch in Monterey from
1855 to 1857.2
Santa Cruz There were three known
or likely sites of shore whaling in the
general vicinity of Santa Cruz along
the northwestern portion of Monterey
2 Bancroft (1884-1890, Vol. 7:83, note 7) claimed
that 24,000 bbl of oil was obtained at Monterey
in the three years beginning in 1855. As indicated
by Henderson (1972:211, note 376, citing Starks,
1922:18), this is “patently a misprint and inflation of the correct amount of twenty-four hundred barrels.”
Bay—Soquel Point, Año Nuevo Point,
and Davenport Landing. Fishermen in
the area killed a right whale in November 1860, and between then and 1873 at
least four whale carcasses were salvaged
at sea and taken to shore for processing
(Bertão, 2006:180). A whaling operation started at Soquel Point in October
1865 and was abandoned in March 1866
(Bertão, 2006:182–183). The same company then tried setting up an operation
on Año Nuevo Point, probably later in
the 1860’s (Bertão, 2006:184). Finally,
a station was established at Davenport
Landing that continued to operate, but
only in desultory fashion, into the mid
1870’s (Bertão, 2006:185–186). No
direct estimates of the total landings
at these sites near Santa Cruz were
possible.
It is relevant to note that a modern
shore station operated at Moss Landing, approximately halfway between
Monterey and Santa Cruz, for 5 years
(1919–1922, 1924) (Clapham et al.,
1997). Although whaling was attempted
year-round, most catches were between
April and November and consisted
11
almost entirely (94%) of humpbacks.
Only 6 gray whales (all but 1 in January), 1 right whale (April), 2 blue
whales (July), and 38 fin whales (most
in summer months) were taken.
San Francisco Bay Area, Calif.
We have combined the operations at
Pigeon Point and Half Moon Bay under
this heading. Because the information
available was very limited, no direct
estimates of total landings at these stations were possible.
Pigeon Point A station was established here, north of Santa Cruz, in 1862,
and it operated intermittently for more
than 30 years (Nichols, 1983:126–128;
Bertão, 2006:138–146). Whaling apparently ceased for several years beginning
in 1879 but then resumed and continued
until 1895. There is little information on
the size or composition of catches although both humpbacks and gray whales
were taken. Oil production amounted
to 1,000 bbl in 1877–78 and 561 in
1878–79 (Sayers, 1984:153).
Some time prior to 1872, a visitor to
the station reported that 12 humpbacks
and no grays had been taken that season
until the time of his visit, and that the
previous year only 2 humpbacks had
been taken and “the rest” had been
grays (Nichols 1983:128). Curiously,
Jordan (1887a) claimed that 12 “sulphurbottoms” (blue whales) were taken
at Pigeon Point in the late 1870’s. This
would have made it an exceptional site
since there is no suggestion of more than
an occasional blue whale being taken at
any other California shore station during
the 19th century. As noted by Nichols
(1983:129), the fact that Jordan mentions the sulphurbottoms as passing the
point headed north in April and south
in the autumn suggests that he confused
them with gray whales.
Half Moon Bay Whaling operations
here, about 35 km south of San Francisco, began in 1860 or 1861 and continued at least intermittently until 1882
(Nichols, 1983:117; Sayers, 1984:131;
Bertão, 2006:147–149). There is little
information on catches or scale of effort
(e.g. number of boats, crew members).
The author of a book on place names of
San Mateo county placed the site of the
12
Table 2.— Estimated numbers of gray and humpback whales landed (Whales) at seven stations between 1854 and
1899, with standard error (SE (W)), showing the total number of seasons of whaling (Years), the average number of
whales per season for each station (WPY), standard errors (SE (WPY)).
Baja
Years
Whales
SE(W)
WPY
SE (WPY)
26
247.5
21.23
9.5
0.82
Los Angeles
Monterey
26
398
19.61
15.3
0.75
46
884.1
45.85
19.2
1
Pt. Conception
shore station at Whaleman’s Harbor just
outside the northern end of Half Moon
Bay and quoted the 1862 Coast Pilot
as indicating that about 1,000 bbl of
“humpback oil” had been secured at this
station in autumn 1861 (Brown, 1975;
cited in Bertão, 2006:138).
North
North Coast Counties, Calif.
Shore whaling was prosecuted from
three or four sites in northern California—Bolinas Bay, Humboldt Bay, Trinidad Bay, and Crescent City—but very
little information is available on any of
them. No direct estimates of total landings at these stations were possible.
Bolinas Bay This site, just northwest of San Francisco, may have hosted
a whaling operation that consisted of
a fleet of small vessels taking whales,
flensing the blubber alongside, and
delivering it to shore cookers every few
days (Nichols, 1983:110–111; Sayers,
1984:131). This station is thought to
have been active in 1857, although
Bertão (2006:120–122) was skeptical
that it ever got beyond planning stages.
In any event, he believed that its principal intended targets were sperm whales
rather than gray or humpback whales.
Humboldt Bay A steam tug whaled
in Humboldt Bay in 1855, and the
whales, apparently all or mostly humpbacks, were towed to Humboldt Point
for processing (Sayers, 1984:131;
Bertão, 2006:110–113).
Trinidad Bay A summer humpback
whaling operation existed here in 1861.
This may have represented relocation by
the company that had whaled at Crescent
City several years earlier (Bertão, 2006;
see the following paragraph).
Crescent City This fourth site
was some 30 km south of the Oregon
border (Nichols, 1983:85–86; Sayers,
14
132.5
8.38
9.5
0.6
San Diego
29
453.3
27.56
15.6
0.95
San Luis Obispo
20
94.5
11.76
4.7
0.59
San Simeon
30
441.1
8.4
14.7
0.28
1984:127, 131; Bertão, 2006:113–119).
Two stations were active there in the
mid 1850’s (1854–57 at least). Judging
by the few newspaper and other reports
referring to whaling in this area, it was
primarily a summer activity (May–September) and therefore likely took more
humpbacks than gray whales.
Again, it is relevant to note that a
modern shore station operated at Trinidad in 1920 and 1922–1926 (Clapham et
al., 1997). The whaling season generally
began in April and ended in November, with most catches made during
May–September. Catch composition
was similar to that at Moss Landing
(see above)—84% humpbacks, 12% fin
whales, and only 1 blue whale and 1 gray
whale (no right whales reported). The
lone gray whale was a male taken in July
while feeding “almost on the rocks” near
Crescent City along with four other gray
whales (Howell and Huey, 1930).
Projected Landings by Station
We were able to estimate numbers of
whales landed for seven shore stations.
Some of the substantial uncertainty
surrounding the estimates for those
stations has been addressed by interpolation. Addressing the even greater
uncertainty surrounding the landings
from the remaining stations, however,
is more difficult. One approach is to
make projections on the assumption that
those stations had productivity levels
similar to the levels of the seven with
direct estimates, ranging from 4.7 to
19.2 gray and humpback whales, combined, per year (Table 2). Assuming the
landings for the other stations were in
this range, projected landings for them
would be the number of years operating
multiplied by the average of estimated
annual landings for the seven relatively
well-reported stations, 12.6 (SE = 2.2).
The uncertainty of such projections is
Marine Fisheries Review
Table 3.— Estimated and projected gray and humpback whale landings at California shore stations from 1854 to 1899. Shown are numbers of station-years where estimates
of landings were possible (Est. Years), estimated gray whales (Est GW) and humpback whales (Est HB) with their standard errors (Est GW SE, Est HB SE), numbers of stationyears where landings were projected (Proj Years), and numbers of estimated and projected gray and humpback whales (GW, HB) and their standard errors (GW SE, HB SE).
Year
Est. Years
Est GW
Est GW SE
Est HB
Est HB SE
Proj. Years
GW
1854
1855
1856
1857
1858
1859
1860
1861
1862
1863
1864
1865
1866
1867
1868
1869
1870
1871
1872
1873
1874
1875
1876
1877
1878
1879
1880
1881
1882
1883
1884
1885
1886
1887
1888
1889
1890
1891
1892
1893
1894
1895
1896
1897
1898
1899
1
1
1
1
2
2
4
4
4
4
5
5
5
5
6
6
6
6
6
6
6
6
6
6
6
7
7
7
7
7
7
7
5
4
2
2
2
2
3
2
1
1
1
1
1
1
13
13
13
13
44
40
79
57
77
80
92
82
84
84
88
79
89
87
85
76
68
56
43
52
45
73
59
66
67
70
73
59
22
23
18
20
13
13
12
12
6
6
6
6
6
2
1.3
1.3
1.3
1.3
2.6
2.8
9.8
6.6
11.4
12.4
17.3
11.9
12.6
12.1
8.3
8.5
7.7
7.4
7.4
5.7
7.0
6.0
6.0
6.0
7.0
7.1
7.0
11.3
11.3
5.4
4.2
1.3
0.5
6.2
6.2
4.8
4.7
4.7
4.7
4.9
4.7
4.7
4.7
4.7
4.7
0.2
11
11
10
10
22
24
24
23
25
31
23
12
15
13
15
18
9
9
9
6
8
7
7
6
5
9
6
8
8
8
9
9
3
6
5
5
5
5
5
5
5
5
5
5
5
2
1.3
1.3
1.3
1.3
2.6
2.8
3.0
2.7
3.1
3.8
10.5
1.9
3.9
2.4
3.9
3.2
4.3
4.3
4.3
1.6
4.1
4.0
4.0
1.1
1.0
1.6
1.3
4.1
4.2
1.6
1.6
1.3
0.5
3.9
3.9
3.9
3.9
3.9
3.9
3.9
3.9
3.9
3.9
3.9
3.9
0.2
1
2
2
3
3
3
3
6
5
5
5
5
5
6
6
6
6
6
6
6
6
6
6
7
7
7
6
5
5
4
4
2
2
2
2
2
1
1
1
1
1
1
0
0
0
0
13
13
20
26
58
54
93
84
105
107
120
109
111
123
128
119
128
127
125
115
108
95
83
99
92
119
98
94
95
91
94
66
28
30
25
27
20
20
19
19
13
13
6
6
6
2
estimated from the variance of a uniform
distribution of half width estimated by
Equation 1. The estimated range of that
uniform distribution from Equation 1 is
slightly wider than the range of whales
per year, 4.2 to 21.1 whales per year,
and the standard error of a uniform
distribution of that width is 4.9 whales
per year.
Total Landings
The estimated and projected total
landings were combined, by region, then
prorated to species using the ratios in
Table 1, and then summed across regions
(Table 3). The temporal distributions of
the annual estimated and projected gray
and humpback landings were similar
72(1)
(Fig. 10 and Fig. 11), although the total
from 1854–99 for gray whales (3,150,
SE = 112) was nearly double that for
humpback whales (1,637, SE = 62).
Discussion and Conclusions
Oil Marketing and Yield
Most of the oil secured by the shore
stations was shipped to San Francisco,
although some also was used locally
for lighthouses and lamps (May, 2001;
Fox, 2001). In the early years of shore
whaling, when there was a premium
for machine lubricant and lighting fuel,
humpback oil commanded a higher
price than gray whale oil, whereas in
later years, when the use of whale oil
GW SE
1.3
1.3
5.0
9.8
10.1
10.1
13.8
20.6
22.6
23.1
26.1
22.9
23.2
22.9
21.2
21.3
21.0
20.9
20.9
20.3
20.7
20.4
20.4
25.1
25.4
25.4
20.7
22.5
22.5
15.6
15.2
5.1
4.9
7.9
7.9
6.8
6.8
6.8
6.8
6.9
6.8
6.8
4.7
4.7
4.7
0.2
HB
HB SE
23
36
29
34
46
48
48
71
60
67
59
48
50
49
51
55
45
45
45
42
44
44
43
48
47
51
42
43
44
38
39
27
22
24
24
24
11
11
11
11
11
11
5
5
5
2
5.0
9.8
5.5
6.8
7.2
7.3
7.3
13.7
10.9
11.1
14.8
10.6
11.1
10.7
11.1
10.9
11.3
11.3
11.3
10.6
11.2
11.2
11.2
12.6
12.6
12.6
10.5
11.2
11.2
8.6
8.6
5.6
5.4
6.7
6.7
6.7
4.5
4.5
4.5
4.5
4.5
4.5
3.9
3.9
3.9
0.2
shifted to rope making and leather
working, the lighter oil obtained from
gray whales sold more readily in local
markets (Bertão, 2006:51).
According to Fox (2001), the range
of yields reported for gray whales at
California shore stations was 25–45
bbl (1 barrel = 31.5 U.S. gal or 26.28
Imp gal). Sayers (1984:123), citing
Scammon (1874), gave the range in
yield for gray whales as 25–35 bbl,
with “exceptional animals” giving 60
bbl or more. Data from shore stations
and the Ocean (anchored in San Diego
Bay) in 1860 indicate that 1,150 bbl
of oil was obtained from 32 whales
(Nichols, 1983:105–106), most or all
of which probably were gray whales,
13
for an average yield of 36 bbl. A large
humpback whale in the North Pacific
would yield about 40 bbl (Scammon,
1874). Although humpbacks, like gray
whales, could produce as much as 60
or even 70 bbl, the average yield was
probably not greatly different between
the two species (Mitchell and Reeves,
1983).
In our study, the meager shore-station data on yield were not sufficiently
detailed to allow us to distinguish gray
Figure 10.—Estimated and projected number of gray whales landed at California
shore stations from 1854 to 1899, with vertical bars indicating plus and minus one
standard error.
Figure 11.—Estimated and projected number of humpback whales landed at California shore stations from 1854 to 1899, with vertical bars indicating plus and minus
one standard error.
14
whales from humpbacks. We had sufficient data (minimum of 5 observations) for only three sites to calculate
meaningful averages of bbl/whale: Baja
California, 31.86 (SE = 3.06, n = 5), San
Diego, 37.88 (SE = 5.53, n = 10), and
Monterey, 36.39, SE = 5.01, n = 11).
These combined data, together with five
more observations spread across various
other sites, gave an average of 38.01 (SE
= 2.67, n = 31).
Both Scammon (1874:250–251,
but see below; also see Henderson,
1972:138) and Henderson (1984:180)
used 35 bbl/whale to convert oil quantities to estimates of gray whales landed
in both shore- and ship-based whaling.
For his part, Scammon (1874:250–251)
concluded that the aggregate quantity
of oil produced by “the several shore
parties, since their first establishment,”
was “not less than 95,600 barrels.” He
guessed that 75,600 bbl came from gray
whales and 20,000 from humpback
whales, fin whales, and blue whales.
Without stating his method, Scammon converted these numbers to “not
less than 2,160 California Grays, and
eight hundred Humpbacks and other
whalebone whales.” This equates to 35
bbl/whale for grays and 25 bbl/whale
for the other species. It is possible that
35 bbl/whale is too high for humpbacks;
indeed, several studies of humpback
whaling (mainly on humpback calving/breeding grounds) produced average
yields of about 25 bbl/whale (Mitchell
and Reeves, 1983; Best, 1987; Reeves
and Smith, 2002).
Given the artisanal character of the
various shore whaling operations, their
efficiency in making oil from killed
whales was highly variable. Sayers
(1984) pointed out (following both
Scammon (1874) and Rice and Wolman
(1971)) that gray whales taken during
the “going down” season (December–
February) were “fat, well nourished, and
rendered a fine quality of oil,” whereas
those taken during the “going up” season
(February–April) could have lost up to
a third of their body mass while fasting and, in the case of adult females,
nursing their calves. Jordan (1887a:60)
stated that a southbound whale could be
expected to yield 35 bbl, a northbound
Marine Fisheries Review
Lithograph of a whaleboat with Greener’s gun mounted, drawn by Charles M. Scammon (Scammon, 1874:249).
whale 25 bbl. He also claimed that
during the southbound migration “the
larger cows come nearest to shore and
first” while on the northbound migration “the cows and calves are farthest
out, the bulls and dry cows near shore.”
The yields of humpbacks undoubtedly
varied seasonally as well although the
seasonal signal is perhaps less clear for
them, at least off California, than it is
for gray whales.
In addition to the variability from
seasonal changes in body condition, the
towing distance and circumstances could
affect processing efficiency. For example, “Sharks, which like to gorge themselves on the whale’s carcass, were one
of the shore whaler’s main concerns . . .”
(Bertão, 2006:48). Also, whales that
72(1)
sank and were only processed after
several days on the bottom could be
“in such a state of advanced decay that
the oil was not worth much” (Bertão,
2006:49). All of the factors that reduced
processing efficiency would have reduced the oil returns, possibly leading
to underestimation of the numbers of
whales landed.
Finally, in a study of shore whaling in
New York (on Long Island), Reeves and
Mitchell (1986:208) concluded that there
had been a tendency for newspapers and
other sources “to report the yields of
unusually large whales more regularly
than those of small or medium-sized
whales.” Also, they found that “in many
instances the yield reported is only the
whalers’ optimistic estimate, made prior
to trying out.” This is consistent with
the observation by Henderson (1972:
139) that the oil amounts estimated by
ship-based whalers and reported from
the whaling grounds in Baja California
often turned out to be higher than the
amounts reported upon their arrival at
home port. One or both of these factors likely influenced at least some of
the data on California shore whaling,
with the net effect of an upward bias
in estimates of average yield and thus
a negative bias in the derived estimates
of whales landed.
Hunting Loss
Hunting loss was a significant feature
of California shore whaling. At least
four factors would have contributed to
15
the variability in loss rates at the different shore stations and at different times
in their histories of operation: heaviness
of the sea, storminess of the weather,
depth of the water, and experience of
the crews (Bertão, 2006:50). Sinking
was a “major problem” for the shore
whalers and they “developed special
procedures to cope” with it (Bertão,
2006:48). Sinking was exacerbated
by the widespread use of explosive
projectiles even though some of the
weapons (e.g. Greener’s harpoon gun
and Pierce’s harpoon-bomb-lance gun)
were supposed to make the whale “fast”
to the boat after being struck (Nichols,
1983:9–16; Bockstoce, 1986:73). Other
bomb-lances, in contrast, were used
simply to make a quick kill and did not
involve tethering the quarry.
At least three different types of explosive weapons were used at the San
Simeon land station in 1880—Englishmade swivel guns, Greener’s exploding-head harpoon guns, and Norwegianmade bomb guns—with varying levels
of success (Nichols, 1983:139). A right
whale attacked off San Simeon in April
1880 was struck with 25 bomb-lances
plus harpoons, but it was still not secured (Nichols, 1983:141). In the late
1850’s the whalers in San Diego using
Greener gun/bomb-lance techniques
reportedly landed only 5 of 12 (presumably gray) whales killed (Nichols,
1983:105; Sayers, 1984:144), which implies a loss rate factor (multiplier applied
to secured catch) of 2.4. The implements
used there were “of marginal quality”
and “two thirds of the whales wounded
were lost due to the harpoon’s failure to
explode” (Nichols, 1983:109, citing the
diary of a judge who visited the station
at Ballard Point in 1860).
At Monterey in the early 1850’s, the
bomb-lances available “were defective and proved useless” and therefore
only hand harpoons and lances were
used (Sayers, 1984:132). Nonetheless,
6 whales killed at Monterey between
April and September 1854 were lost
(the secured catch over that period
consisted of 9 humpbacks, 5 grays, and
4 killers) (Nichols, 1983:72). The next
year, 18 whales were secured and 6
were killed but lost (5 humpbacks and
16
1 gray) (Sayers, 1984:153). The Greener
harpoon gun did not come into regular
use at Monterey until 1865 (Bertão,
2006:76).
In San Diego in the 1860’s, it was
claimed that 2 out of 3 whales struck
with bomb-lances were lost due to the
failure of the bombs to explode (Hayes,
1929). At Pigeon Point in one season,
apparently 1869, 10 of the 22 whales
killed were lost (Bertão, 2006:49); those
secured were all humpbacks but it is
uncertain whether any (or even all) of
those that were lost were grays (Nichols,
1983:128). In any event, according to
Starks (1922:10), the loss rate that year
at Pigeon Point was “much greater . . .
than usual.” This latter comment reinforces our concern that the anecdotal
information on loss rates should not
be assumed to be representative of the
fishery overall or even of particular stations or time periods.
Two factors would have mitigated
hunting loss. First, at Point Conception
(Cojo Viejo), for example, all but one of
16 gray whales secured in the 1879–80
seasons bore wounds attributed to previous strikes by bomb-lances (Jordan,
1887a). This demonstrates that struck
whales did not necessarily die, even
when struck by these potentially lethal
weapons. Therefore, struck-but-lost
whales were not certain to die of their
wounds. Second, eventual salvage of
whales that were killed but lost may
have been the norm at some stations. For
example, in Monterey in 1900, it was
generally expected that sunken whales
would float to the surface on the third
day after being killed, and then be towed
ashore for processing (Berwick, 1900).
Another factor can be viewed as
a “hidden” addition to hunting loss.
Scammon (1874:251) included in his
calculation of shore-based gray whale
catches not only an allowance for struckbut-lost whales, but also “one eighth
[of the killed number, including both
secured and struck-but-lost] for unborn
young.” This presumably would apply
mainly to hunts during the southbound
migration when many cows were carrying near-term fetuses. However, calves
several months old and accompanying
their mothers on the northbound migra-
tion also would have been vulnerable,
if orphaned, because of their continued
social if not also physiological dependence on their mothers.
Our conclusion from examining all
available data is that no more reliable
quantitative calculation of hunting loss
is possible beyond that based on the
informed opinion of Scammon (1874)
and Henderson (1984) that one whale
was killed and lost for every five processed. Therefore, we propose that landings should be multiplied by a loss rate
factor of 1.2 to estimate total removals,
but emphasize that that procedure is
probably negatively biased because it
fails to account for fetal mortality and at
least some orphaning of calves leading
to their death.
Landings of Gray Whales
and Humpback Whales
Our estimates of landings of gray
and humpback whales are highest in the
1860’s and 1870’s and decline abruptly
beginning in the 1880’s, with a less
rapid but continuing decline to the end
of the century (Fig. 12). The cause of
the decline is not certain although it has
generally been assumed that, at least in
the case of gray whales, it was related
to the cumulatively depleting effect of
removals by the shore fishery in California and the ship-based fishery in the gray
whale breeding lagoons of Baja California. Scammon (1874:251), for example,
concluded, “This peculiar branch of
whaling [California shore whaling] is
rapidly dying out, owing to the scarcity
of the animals which now visit the coast;
and even these have become exceedingly
difficult to approach.”
It is also possible that economic or
other factors played a role in the decline
in catches, as suggested by Davis et al.
(1997) for other species in a more general analysis of 19th century whaling.
The price of whale oil spiked in the mid
1860’s and then began a fairly steady but
slow decline before leveling off in the
mid 1880’s at values very close to what
had prevailed in the early 1850’s at the
start of the California shore fishery (Fig.
12). There is no clear signal, however,
in the trend in oil prices that would help
explain the declines in gray and hump-
Marine Fisheries Review
72(1)
n
back catches from the 1880’s to the end
of the century.
Our estimates of landings of gray
whales and humpback whales, both by
species and combined, can be compared
to previous estimates for the entire
period (1854–1899) and for the earlier
period of 1854 –1874, and in one case
by year. The earliest estimates were by
Scammon (1874:250–251; see above),
who estimated landings of 2,160 gray
whales and 800 humpback (and other
baleen) whales from 1854 to 1874 (see
Grant, 1969:XXIX). For that same early
period, our estimates were somewhat
lower for gray whales (1,889) and higher
for humpback whales (996).
The latter is not directly comparable
to Scammon’s estimate as we tried to
exclude the other species that were
taken occasionally (blue, fin, and right
whales) whereas he lumped them with
humpbacks. For gray and humpback
whales combined, Scammon’s and our
estimated totals differ by only 2.5%, a
remarkable and probably coincidental
similarity given that the two approaches
were independent and used mostly different information. It should be noted
that Scammon (1874:251) considered
his estimates to be negatively biased to a
considerable extent, whereas Henderson
is said to have thought they were “a little
high” (personal commun. to Nichols,
1983:46).
Considering the entire period, our
estimate of total landings of 4,787
gray whales and humpback whales,
combined, can be compared directly
to the estimate by Nichols (1983). His
estimation methods were not explained
in detail, but his “best estimate” was
“based on probable unrecorded captures
according to recorded station success
and number of years of operation for
which no records are available” (p. 40;
his Table 2, p. 39–40, and his Table 3, p.
42–43). Starting from reported landings
totaling “at least” 1,308 whales of all
species, combined [our total from Nichols (1983) was 1,281], he estimated total
landings as 3,637 whales, substantially
lower than our total of 4,787 gray and
humpback whales, combined. Considering only the earlier period (1854–1874),
however, the estimate of landings by
Figure 12.— Gray (solid circles) and humpback (triangles) whales landed by California shore stations from 1854 to 1899, with the price of whale oil (open circles;
data from Davis et al., 1997).
Nichols was more similar to ours (2,550
vs. 2,885 whales, respectively), and as
he indicated (p. 45), “a bit lower” than
the 2,960 of Scammon (1874).
At about the same time as Nichols
(1983) was completing his study, additional work was reported by Henderson
(1984) and Sayers (1984). Henderson
(1972:163) had judged Scammon’s estimate of the gray whale catch by shore
whalers to be “essentially correct,” and
in his 1984 book chapter, which has generally been regarded as a comprehensive
reconstruction of the catch history of
the eastern Pacific gray whale population, he used Scammon’s value of 2,160
for the shore whaling component from
1854–1874. Similarly, Sayers (1984)
presented a summary of landings (her
Appendix, p. 153–156, which we used,
along with Nichols (1983), as a key data
source) but, unlike Nichols, Sayers made
no attempt to estimate total landings
through interpolation.
It is interesting to note that although
the book chapter by Sayers (1984) was
in the same volume as Henderson’s 1984
chapter (and was cross-referenced in it),
Sayers’s compilation seems not to have
been used in Henderson’s catch estimation (his Table 1, p. 169). Moreover,
Henderson did not cite Nichols (1983)
as a source even though Nichols’s work
(completed in January 1983) had been
carried out under Henderson’s supervision in the Geography Department, California State University at Northridge.
The relationships among these sources
remain obscure, and thus we were not
able to reconcile differences or pursue
further comparisons of them.
Our estimates can also be compared
on a year-by-year basis to Reilly (1981),
who provided annual estimates of the
numbers of gray whales killed (that is,
landed plus an adjustment for animals
struck but lost). He based his estimates
on the kill estimates in Henderson
(1972) for three time periods, allocating
them to years within those periods based
on Henderson’s notes. Reilly assumed,
for example, that 200 whales were killed
annually from 1859 to 1867 (his Table
44). His study was completed before
those of Nichols (1983) and Sayers
(1984), when there was very little published documentation available on gray
whale catches between 1874 and 1912.
For those years, he therefore had to rely
on the scattered literature available at the
time to make admittedly crude estimates
(his Table 45).
17
In addition to the uncertainty reflected in the standard errors of our total
estimated landings of gray and humpback whales (CV = 3.5% and 3.8%,
respectively), several large sources of
uncertainty probably exist but remain
unmeasured. Our estimation procedures
do not take into account the uncertainty
of whether the reports of landings, when
and where available, are themselves
complete. There are suggestions in the
literature (see above) that for some stations at some times, landings records
are incomplete.
Although the incompleteness of the
available data for many years for the
seven best-reported stations has been
addressed in the interpolation model,
that model itself assumes temporal
continuity in the activities and landings at these stations. The projection
model for other stations assumes
consistency within the geographic
regions, in terms of both the scale of
effort and production and the species
composition of catches. It further
assumes that the lack of reports for
a given station is not related to that
station’s scale of whaling operations.
Finally, the estimates of the proportions of gray and humpback whales in
Estimated Gray Whales Landed
We derived estimates of landings
from Reilly’s estimates of kills of gray
whales for the entire period 1854–1899
by dividing them by his assumed loss
rate factor (1.2). These estimated landings totaled 2,831, only roughly 10%
lower than our total of 3,150 gray whales
landed. Although the totals are similar,
this may be largely coincidental as
Reilly’s temporal distribution of landings was very different from ours, with
substantially higher levels in the earlier
time period and lower levels after 1870
(Fig. 13).
Reilly’s (1981) estimates of removals were designed for use in modeling
the temporal history of the eastern gray
whale population (Reilly, 1981; Cooke,
1986) and have been used in the development of other time series for the same
purpose, mainly within the context of the
Scientific Committee of the International Whaling Commission (Lankester and
Beddington, 1986; Butterworth et al.,
1990, 2002; IWC, 1993). The published
information on those other time series
generally does not distinguish catches
by the shore fishery from those by other
fisheries (e.g. ship-based, aboriginal/
subsistence), so direct comparisons with
our estimates are not possible.
Figure 13.— Gray whales landed at California shore stations between 1854 and
1899 from our analyses (filled circles) and Reilly’s (1981) analysis (open circles),
showing a marked difference in temporal pattern.
18
the catches are founded on grossly incomplete reporting, and there is reason
to suspect that the reports themselves
were biased by local interest in recording mainly the larger, more valuable
whales taken.
Our effort to address and quantify
the many uncertainties that apply to the
catch data for 19th century California
and Baja California shore whaling
has been only partially successful.
The estimation methods, especially
the projected catches for poorly documented stations, in the present paper
may be near the limits of plausibility, considering the meager records
of shore whaling operations. Further
progress in reducing and measuring
uncertainty will depend on work by
local historians. The material reviewed
here should provide guidance on geographic sites, time periods, and topics
that deserve particular attention. In
some instances, it would be useful
to have more information simply to
confirm that active whaling was or
was not taking place in certain years.
In other instances, more needs to be
known about the species hunted. In this
regard, consideration should be given
to the use of bone material that may be
available for excavation and salvage
at whale processing localities. Such
material might be useful not only as a
way of identifying species composition
of catches, but also for assessing the
relative age structure of catches.
In spite of their limitations, we consider our estimates and projections of
gray whale landings by 19th century
California and Baja California shore
whaling to be more reliable than previous estimates. Our estimates are based
on all presently available station-by-station data, and we have used well-defined
methods that allow the inclusion of estimates of uncertainty. Previous estimates
of landings are generally less directly
and clearly derived from reported landings, and none include estimates of uncertainty. Further, explicit information
has not been provided on how various
types of bias were treated in previous
estimations.
Thus, the estimates of gray whale
landings in the present paper (appro-
Marine Fisheries Review
priately adjusted to account for hunting
loss) offer an alternative to Reilly’s
and other previous catch series (see
earlier) for use in population modeling.
Further modeling of the eastern North
Pacific gray whale population, and
initial modeling of the eastern North Pacific humpback whale population, must
await reconstruction or re-evaluation
of catches by ship-based whalers. In a
study parallel to the present one, we are
pursuing this for gray whales (Reeves et
al., 2010). To our knowledge, no similar
work has begun on humpback whales.
Acknowledgments
This study was funded by the Lenfest
Oceans Program of the Pew Charitable
Trust through Stanford University. We
thank Steve Palumbi for his pivotal role
in securing the grant. We also thank
Willis Hobart and Jacki Strader for
helping us illustrate the article.
Literature Cited
Alter, S. E., E. Rynes, and S. R. Palumbi. 2007.
The once and future gray whales: DNA evidence for historic population size and ecosystem impacts. Proc. Natl. Acad. Sci. USA
104(38):15,162–15,167.
Bancroft, H. H. 1884–1890. History of California. The History Co., San Francisco, 7 vols.
[Not seen; cited from Henderson, 1974]
Benši´c, M., and K. Sabo. 2007. Estimating the
width of a uniform distribution when data are
measured with additive normal errors with
known variance. Comput. Stat. Data Anal.
51:4,731–4,741.
Bertão, D. E. 2006. The Portuguese shore whalers of California 1854–1904. Portuguese Heritage Publ. Calif., San Jose, 306 p.
Berwick, E. 1900. Offshore whaling in the bay of
Monterey. Cosmopolitan 29(6):631–637.
Best, P. B. 1987. Estimates of the landed catch
of right (and other whalebone) whales in the
American fishery, 1805–1909. Fish. Bull.
85:403–418.
Bockstoce, J. R. 1986. Whales, ice, and men:
The history of whaling in the Western Arctic.
Univ. Wash. Press, Seattle, 400 p.
Brown, A. K. 1975. Place names of San Mateo
County. San Mateo Co. Hist. Assoc., San
Mateo, CA. [Not seen; cited from Bertão, 2006]
Butterworth, D., J. Korrûbel, and A. Punt. 1990.
What is needed to make a simple densitydependent response population model consistent with data for eastern North Pacific
gray whales? Pap. SC/A90/G10 presented to
the Scientific Committee of the International
Whaling Commission, Special Meeting on
Gray Whales, April 1990. Avail.: IWC Secretariat, Camb., U.K.
Butterworth, D. S., J. L. Korrûbel, and A. E.
Punt. 2002. What is needed to make a simple
density-dependent response population model
consistent with data for eastern North Pacific
72(1)
gray whales? J. Cetacean Res. Manage. 4:63–
76.
Calambokidis, J., E. A. Falcone, T. J. Quinn, A.
M. Burdin, P. J. Clapham, J. K. B. Ford, C.
M. Gabriele, R. LeDuc, D. Mattila, L. RojasBracho, J. M. Straley, B. L. Taylor, J. UrbánR., D. Weller, B. H. Witteveen, M. Yamaguchi,
A. Bendlin, D. Camacho, K. Flynn, A. Havron,
J. Huggins, and N. Maloney. 2008. SPLASH:
Structure of Populations, Levels of Abundance and Status of Humpback Whales in the
North Pacific. Rep. to U.S. Dep. Commer.,
Seattle, Wash. 57 p. Avail: .
Clapham, P. J., S. Leatherwood, I. Szczepaniak, and R. L. Brownell, Jr. 1997. Catches
of humpback and other whales from shore
stations at Moss Landing and Trinidad,
California, 1919–1926. Mar. Mamm. Sci.
13(3):368–394.
Collins, J. W. 1892. Report on the fisheries of the
Pacific coast of the United States in 1888. In
Report of the Commissioner, U.S. Commission of Fish and Fisheries, U.S. Government
Printing Office, Wash., D.C. [also publ. as
Miscellaneous Documents of the House of
Representatives for the First Session of the
Fifty-first Congress 1889–90 Part XVI.]
Cooke, J. G. 1986. On the net recruitment rate
of gray whales with reference to inter-specific comparisons. Rep. Int. Whal. Comm.
36:363–366.
Cooper, J. G. 1871. Monterey in the dry seasons.
Am. Nat. 4(12):756–758.
Davis, L. E., R. E. Gallman, and K. Gleiter. 1997.
In pursuit of leviathan: Technology, institutions, productivity, and profits in American
whaling, 1816–1906. Univ. Chicago Press,
Chicago.
Fox, G. 2001. Nineteenth-century whaling on
California shores. Mains’l Haul 37(1):12–19.
Grant, C. 1969. Charles Melville Scammon: sea
captain–naturalist. In A facsimile edition of the
marine mammals of the north-western coast of
North America and the American whale-fishery by Charles M. Scammon, p. XI–XXXVI.
Manessier Publ. Co., Riverside, Calif.
Hayes, B. 1929. Pioneer notes from the diaries
of Judge Benjamin Hayes, 1849–1875. Marjorie T. Wolcott (Editor). M. T. Walcott, Los
Angeles, Calif. [Not seen; cited from Nichols,
1983]
Henderson, D. A. 1972. Men & whales in Scammon’s Lagoon. Dawson’s Book Shop, Los
Angeles, Calif., 313 p.
________ . 1975. Whalers on the coasts of Baja
California: opening the peninsula to the outside world. Geosci. Man 12:49–56.
________ . 1984. Nineteenth century gray whaling: grounds, catches and kills, practices and
depletion of the whale population. In M. L.
Jones, S. L. Swartz, and S. Leatherwood (Editors), The gray whale Eschrichtius robustus,
p. 159–86. Acad. Press, San Diego, Calif.
Howell, A. B., and L. M. Huey. 1930. Food of the
gray and other whales. J. Mammal. 11:321–
322.
Huelsbeck, D. R. 1988. Whaling in the precontact economy of the central northwest coast.
Arct. Anthropol. 25(5):1–15.
IWC. 1993. Report of the special meeting of the
Scientific Committee on the assessment of
gray whales. Rep. Int. Whal. Comm. 43:241–
259.
Jordan, D. S. 1887a. Coast of California. In G.
B. Goode (Editor), The fisheries and fishery
industries of the United States, p. 52–61. Sect.
V, Vol. II, Pt. 15, U.S. Comm. Fish Fish., Gov.
Print. Off., Wash., D.C.
________ . 1887b. The fisheries of the Pacific
coast. In G. B. Goode (Editor), The fisheries
and fishery industries of the United States, p.
589–623. Sect. II, Vol. II, Pt. 16, U.S. Comm.
Fish Fish., Gov. Print. Off., Wash., D.C.
Lankester, K., and J. R. Beddington. 1986. An
age structured population model applied to
the gray whale (Eschrichtius robustus). Rep.
Int. Whal. Comm. 36:353–358.
Lydon, S. 2001. Japanese whaling at Point Lobos,
California. Mains’l Haul 37(1):20–29.
May, R. V. 2001. The history and archaeology
of the Ballast Point whaling station. Mains’l
Haul 37(1):4–11.
Mitchell, E., and R. R. Reeves. 1983. Catch history, abundance, and present status of northwest Atlantic humpback whales. Rep. Int.
Whal. Comm. (Spec. Iss. 5):153–212.
Nichols, T. L. 1983. California shore whaling
1854 to 1900. Master’s thesis in Geography,
Calif. State Univ. Northridge, 211 p.
Reeves, R. R., and E. Mitchell. 1986. The Long
Island, New York, right whale fishery: 1650–
1924. Reports of the International Whaling
Commission, Special Issue 10:201–220.
________ and T. D. Smith. 2002. Historical
catches of humpback whales in the North
Atlantic Ocean: An overview of sources. J.
Cetacean Res. Manage. 4:219–34.
________ and ________ . 2006. A taxonomy
of world whaling: Operations and eras. In J.
A. Estes, D. P. DeMaster, D. F. Doak, T. M.
Williams, and R. L. Brownell, Jr. (Editors),
Whales, whaling, and ocean ecosystems, p.
82–101. Univ. Calif. Press, Berkeley.
________ , ________ , Judith N. Lund, Susan
A. Lebo, and Elizabeth A. Josephson. 2010.
Nineteenth-century ship-based catches of gray
whales, Eschrichtius robustus, in the eastern
North Pacific. Mar. Fish. Rev. 72(1):26–65.
Reilly, S. B. 1981. Population assessment and
population dynamics of the California gray
whale (Eschrichtius robustus). Ph.D. dissert.,
Univ. Wash., Seattle, 265 p.
Rice, D. W. 1978. The humpback whale in the
North Pacific: Distribution, exploitation, and
numbers. In K. S. Norris and R. R. Reeves (Editors), Report on a workshop on problems related
to humpback whales (Megaptera novaeangliae) in Hawaii, p. 29–44. U.S. Dep. Commer.,
Natl. Tech. Info. Serv. PB-280 794, 90 p.
________ and A. A. Wolman. 1971. Life history
and ecology of the gray whale (Eschrichtius
robustus). Am. Soc. Mammal., Spec. Publ. 3,
Lawrence, Kansas, 142 p.
Saratoga. 1856–60. Logbook of the ship Saratoga of New Bedford, Frederick Slocum,
Master. 23 April 1857–12 December 1858
(partial or incomplete voyage). Kendall Collect., New Bedford Whal. Mus., New Bedford, Mass., Log # KWM 180.
Sayers, H. 1984. Shore whaling for gray whales
along the coast of the Californias. In M. L.
Jones, S. L. Swartz, and S. Leatherwood (Editors), The gray whale Eschrichtius robustus,
p. 121–57. Acad. Press, San Diego, Calif.
Scammon, C. M. 1874. The marine mammals
of the north-western coast of North America,
described and illustrated with an account of
the American whale-fishery. John H. Carmany
and Co., N.Y., 319 p.
Scheffer, V. B., and J. W. Slipp. 1948. The whales
and dolphins of Washington State with a key
19
to the cetaceans of the west coast of North
America. Am. Midl. Nat. 39:257–337.
Seber, G. A. F. 1973. The estimation of animal
abundance and related parameters. Griffin,
Lond., 506 p.
Starbuck, A. 1878. History of the American
whale fishery from its earliest inception to
the year 1876. In Rep. U.S. Fish Comm., vol.
IV, 1875–1876, App. A, p. 1–779. Gov. Print.
Off., Wash.
Starks, E. C. 1922. A history of California shore
whaling. Calif. Fish Game Comm., Sacramento, Fish Bull. 6, 38 p.
Townsend, C. H. 1886. Present condition of the
California gray whale fishery. Fish. Bull.
6:346–350.
________ . 1935. The distribution of certain
whales as shown by logbook records of American whaleships. Zoologica 19:1–50.
Wade, P. R. 2002. A Bayesian stock assessment
of the eastern Pacific gray whale using abundance and harvest data from 1967–1996. J.
Cetacean Res. Manage. 4:85–98.
Watkins, R. C. 1925. History of Monterey and Santa
Cruz Counties, California. S. J. Clarke Publ.,
Chicago. [Not seen; cited from Sayers, 1984]
Webb, R. L. 2001. Industrial shore whaling on
the west coast 1905–1912. Mains’l Haul
37(1):30–47.
Appendix
Year, region (see text), station, source(s) of information, number of whales landed (all species, L) according to source (N, S, or O), barrels (Bbls) of oil reported, gray whales
(GW), right whales (RW), and humpback whales (HB) landed, number of boats active at the station that year, number of crew members employed at the station that year, and
comments.
Coded fields:
Sources: S= Sayers (1984), N = Nichols (1983), B = Bertão (2006), O = another source.
Year
Region
Station
Source(s)
1854
1855
1856
1857
1858
North
North
North
North
North
Crescent City
Crescent City
Crescent City
Crescent City
Crescent City
S
S, N
S, N
S, N
N
1859
1860
1861
1862
1863
1864
1865
1866
1867
1868
North
North
North
North
North
North
North
North
North
North
Crescent City
Crescent City
Crescent City
Crescent City
Crescent City
Crescent City
Crescent City
Crescent City
Crescent City
Crescent City
N
N
N
N
N
N
N
N
N
N
1869
1870
1871
1872
1873
1874
1875
1876
1877
1878
1879
1880
1881
1882
1883
1884
1885
1886
1887
1888
1889
1855
1861
1861
North
North
North
North
North
North
North
North
North
North
North
North
North
North
North
North
North
North
North
North
North
North
North
North C.
Crescent City
Crescent City
Crescent City
Crescent City
Crescent City
Crescent City
Crescent City
Crescent City
Crescent City
Crescent City
Crescent City
Crescent City
Crescent City
Crescent City
Crescent City
Crescent City
Crescent City
Crescent City
Crescent City
Crescent City
Crescent City
Humboldt Bay
Trinidad
Half Moon
N
N
N
N
N
N
N
N
N
N
N
N
N
N
N
N
N
N
N
N
N
S
B
S, N
1862
1863
1864
1865
1866
1867
1868
North C.
North C.
North C.
North C.
North C.
North C.
North C.
Half Moon
Half Moon
Half Moon
Half Moon
Half Moon
Half Moon
Half Moon
S, N
S, N
S, N
S, N
S, N
S, N
S, N
LN
LS
1
3
3
LO
Bbls
GW
RW
HB
Boats
1
2
Men
Comments
Harpooned and lost’; 1 company; mainly humps
Probably humps; 2 companies
Nichols (1983) gave no basis for assuming activity here
1858–1889; only in his table, without explanation
Steam tug, mostly humps
Humpbacking
Active 1861–78; 1,000 bbl HB oil produced autumn 1861
(Bertao, 2006:138)
continued
20
Marine Fisheries Review
Appendix (continued)
Year
Region
Station
Source(s)
1869
1870
1871
1872
1873
1874
1875
1876
1877
1878
1879
1880
1881
1882
1857
1862
1863
1864
1865
1866
1867
1868
1869
1870
1871
1872
North C.
North C.
North C.
North C.
North C.
North C.
North C.
North C.
North C.
North C.
North C.
North C.
North C.
North C.
North C.
North C.
North C.
North C.
North C.
North C.
North C.
North C.
North C.
North C.
North C.
North C.
Half Moon
Half Moon
Half Moon
Half Moon
Half Moon
Half Moon
Half Moon
Half Moon
Half Moon
Half Moon
Half Moon
Half Moon
Half Moon
Half Moon
Bolinas Bay
Pigeon Point
Pigeon Point
Pigeon Point
Pigeon Point
Pigeon Point
Pigeon Point
Pigeon Point
Pigeon Point
Pigeon Point
Pigeon Point
Pigeon Point
S, N
S, N
S, N, B
S, N
S, N
S, N
S, N
S, N
S, N
S, N
S, N
S, N, B
B
B
S, N, B
S, N
S, N
S, N
S, N
S, N
S, N
S, N
S, N
S, N
S, N
S, N
1873
1874
1875
1876
1877
1878
1879
1880
1881
1882
1883
1884
1885
North C.
North C.
North C.
North C.
North C.
North C.
North C.
North C.
North C.
North C.
North C.
North C.
North C.
Pigeon Point
Pigeon Point
Pigeon Point
Pigeon Point
Pigeon Point
Pigeon Point
Pigeon Point
Pigeon Point
Pigeon Point
Pigeon Point
Pigeon Point
Pigeon Point
Pigeon Point
S, N
S, N
S, N
S, N
S, N
S, N
S, N
S, N
S, N
S, N
S, N
S, N
S, N
1886
1887
1888
1889
1890
1891
1892
1893
1894
1895
1856
1857
1858
1859
1860
1861
1862
1863
1864
1865
1866
1867
1868
1869
North C.
North C.
North C.
North C.
North C.
North C.
North C.
North C.
North C.
North C.
North C.
North C.
North C.
North C.
North C.
North C.
North C.
North C.
North C.
North C.
North C.
North C.
North C.
North C.
Pigeon Point
Pigeon Point
Pigeon Point
Pigeon Point
Pigeon Point
Pigeon Point
Pigeon Point
Pigeon Point
Pigeon Point
Pigeon Point
Santa Cruz
Santa Cruz
Santa Cruz
Santa Cruz
Santa Cruz
Santa Cruz
Santa Cruz
Santa Cruz
Santa Cruz
Santa Cruz
Santa Cruz
Santa Cruz
Santa Cruz
Santa Cruz
S, N
S, N
S, N
S, N
S, N
S, N
S, N
S, N
S, N
S, N
S, N
S, N
S, N
S, N
S, N
S, N
S, N
S, N
S, N
S, N
S, N
S, N
S, N
S, N
LN
LS
LO
Bbls
GW
RW
HB
Boats
Men
Comments
1 fin whale
See Scammon (1874)
Species and time period unclear; several boats this year
Both grays and humps
Intermittent operations; years uncertain
In one previous season, 12 humps (no grays) taken until
time of a visit; yr before only 2 humps, ‘the rest’ grays
29
16
1,000
564
1
Reportedly active 1858-1884 (Nichols, 1983:42–43)
continued
72(1)
21
Appendix (continued)
Year
Region
Station
Source(s)
LN
LS
1870
1871
1872
1873
1874
1875
1876
1877
1878
1879
1880
1881
1882
1883
1884
1854
North C.
North C.
North C.
North C.
North C.
North C.
North C.
North C.
North C.
North C.
North C.
North C.
North C.
North C.
North C.
North C.
Santa Cruz
Santa Cruz
Santa Cruz
Santa Cruz
Santa Cruz
Santa Cruz
Santa Cruz
Santa Cruz
Santa Cruz
Santa Cruz
Santa Cruz
Santa Cruz
Santa Cruz
Santa Cruz
Santa Cruz
Monterey
S, N
N
N
N
N
N
N
N
N
N
N
N
N
N
N
S, N
24
18
1855
1856
1857
1858
North C.
North C.
North C.
North C.
Monterey
Monterey
Monterey
Monterey
S, N
S, N
S, N
S, N
23
23
23
46
24
1859
1860
1861
1862
North C.
North C.
North C.
North C.
Monterey
Monterey
Monterey
Monterey
S, N
S, N
S, N
S, N
51
46
46
49
1863
1864
1865
North C.
North C.
North C.
Monterey
Monterey
Monterey
S, N
S, N
S, N
49
1866
1867
1868
1869
1870
1871
1872
1873
1874
1875
1876
1877
North C.
North C.
North C.
North C.
North C.
North C.
North C.
North C.
North C.
North C.
North C.
North C.
Monterey
Monterey
Monterey
Monterey
Monterey
Monterey
Monterey
Monterey
Monterey
Monterey
Monterey
Monterey
S, N
S, N
S, N
S, N
S, N
S, N
S, N
S, N
S, N
S, N
S, N
S, N
1878
1879
1880
1881
1882
1883
1884
1885
1886
1887
1888
1889
1890
1891
1892
1893
1894
1895
1896
1897
North C.
North C.
North C.
North C.
North C.
North C.
North C.
North C.
North C.
North C.
North C.
North C.
North C.
North C.
North C.
North C.
North C.
North C.
North C.
North C.
Monterey
Monterey
Monterey
Monterey
Monterey
Monterey
Monterey
Monterey
Monterey
Monterey
Monterey
Monterey
Monterey
Monterey
Monterey
Monterey
Monterey
Monterey
Monterey
Monterey
S, N
S, N
S, N
S, N
S, N
S, N
S, N
S, N
S, N
S, N
S, N
S, N
S, N
S, N
S, N
S, N
S, N
S, N
S, N
S, N
22
LO
Bbls
GW
RW
4
300
800
800
800
23
Boats
Men
Comments
9
2
12
Apr 54–Nov 55: 24 whales; 6 more (5 hump, 1 gray)
killed but lost (Sayers, 1984)
17
1
1,800
1,600
1,600
3,400
64
HB
1
6
8
36
48
8
8
8
8
48
48
48
48
1,930
20
679
800
52
1,260
HB oil; Sayers (1984) says 509bbl
HB oil; Sayers (1984) says 1,016 bbl
HB oil; Sayers (1984) says 1,500 bbl; 2 companies; from
1858 ‘focus’ changed from humps to grays (Nichols,
1983:66)
600 bbl gray oil; third company active
1,200–2,000 bbl
3,400 is from 2 companies; Sayers (1984) says 2,500
bbl, mostly HB
One company stopped this yr or next
Oil and bone worth $31,000
Oil from 2 Monterey stations (now consolidated) and 1
Carmel
Declining; oil from Monterey and Carmel combined
Oil from Monterey and Carmel combined
1
175
1
Also 1 500 lb bone
23
4
8
6
9
7
5
14
15
6
8
14
500
3
7
1
1
1
6
3
23
3
3
23
23
Nichols (1983): 4 year; Sayers (1984) 8 season; the
company also had ‘four guns of each kind’
3 gray + 1 hump = 185 bbl
4 fin whales
11
12
5
11
17
17 in 2 yr
bleak for getting grays
12
2
2
new company; several dozen whales, mainly humps
new company; several dozen whales, mainly humps
several dozen whales, mainly humps
continued
Marine Fisheries Review
Appendix (continued)
Year
Region
Station
Source(s)
1898
1899
1861
1862
1863
1864
1865
1866
1867
1868
1869
1870
1871
1872
1873
1874
1875
1876
1877
1878
1879
1880
1881
1882
1883
1884
1877
1878
1879
1864
1865
1866
1867
1868
1869
1870
1871
1872
1873
1874
1875
1876
1877
1878
1879
1880
North C.
North C.
North C.
North C.
North C.
North C.
North C.
North C.
North C.
North C.
North C.
North C.
North C.
North C.
North C.
North C.
North C.
North C.
North C.
North C.
North C.
North C.
North C.
North C.
North C.
North C.
North C.
North C.
North C.
South C.
South C.
South C.
South C.
South C.
South C.
South C.
South C.
South C.
South C.
South C.
South C.
South C.
South C.
South C.
South C.
South C.
Monterey
Monterey
Carmel
Carmel
Carmel
Carmel
Carmel
Carmel
Carmel
Carmel
Carmel
Carmel
Carmel
Carmel
Carmel
Carmel
Carmel
Carmel
Carmel
Carmel
Carmel
Carmel
Carmel
Carmel
Carmel
Carmel
Point Sur
Point Sur
Point Sur
San Simeon
San Simeon
San Simeon
San Simeon
San Simeon
San Simeon
San Simeon
San Simeon
San Simeon
San Simeon
San Simeon
San Simeon
San Simeon
San Simeon
San Simeon
San Simeon
San Simeon
S, N
S, N
S, N
S, N
S, N
S, N
S, N
S, N
S, N
S, N
S, N
S, N
S, N
S, N
S, N
S, N
S, N
S, N
S, N
S, N
S, N
S, N
S, N
S, N
S, N
S, N
S, N
S, N
S, N
N
S, N
S, N
S, N
S, N
S, N
S, N
S, N
S, N
S, N
S, N
S, N
S, N
S, N
S, N
S, N
S, N
1881
1882
1883
1884
1885
1886
1887
1888
1889
1890
1891
1892
1893
1868
South C.
South C.
South C.
South C.
South C.
South C.
South C.
South C.
South C.
South C.
South C.
South C.
South C.
South C.
San Simeon
San Simeon
San Simeon
San Simeon
San Simeon
San Simeon
San Simeon
San Simeon
San Simeon
San Simeon
San Simeon
San Simeon
San Simeon
San Luis Obispo
S, N
S, N
S, N
S, N
S, N
S, N
S, N
S, N
S, N
S, N
S, N
S, N
S
S, N
1869
1870
South C.
South C.
San Luis Obispo
San Luis Obispo
S, N
S, N
LN
LS
LO
Bbls
GW
RW
HB
Boats
4
Men
16
Comments
shifted to Carmel
possibly 2 different companies active
17
4
3
2
7
7
200
3
0
3
17
2
1
3
3
2
5
25
23
24
25
20
23
22
21
22
16
12
7
13
3
14
13
25
23
24
25
20
23
22
21
22
16
12
7
13
3
14
13
5
15
16
7
11
15
14
14
7
7
5
5
7
7
5
1
3
1
1
15
10 to 20 men, approx at 15
5
500
450
12
1
4
13 taken by 21 Feb; total 17 through Apr (Nichols,
1983:141)
3
9
21
3
21
7
Up to 30 whales in single yr (Bertao, 2006:173) in late
60’s/early 70’s
continued
72(1)
23