Analysis of pure lead and lead alloys for the automotive leadacid battery industry by inductively coupled argon plasma emission spectroscopy
Bạn đang xem bản rút gọn của tài liệu. Xem và tải ngay bản đầy đủ của tài liệu tại đây (1 MB, 10 trang )
1. J. P. Matousek, B. J. Orr, and M. Selby, Appl. Spectrosc. 38, 231
(1984).
2. J. P. Nogier, Communication SITEF, Toulouse (1987).
3. T. Fuyuki, K. Ohtoshi, T. Saito, and H. Matsunami, Proc. 8th
Intern. Symp. Plasma Chem., Tokyo, 1,519 (1987).
4. L. G. Piper and W. T. Rawlins, J. Phys. Chem. 90, 320 (1986).
5. D. A. Parkes, L. F. Keyser, and F. Kaufman, Astrophys. J. 149,
217 (1967).
6. R. Avni and J. D. Winefordner, Spectrochim. Acta 30B, 281 (1975).
7. S. R. Goode, N. P. Buddin, B. Chambers, K. W. Baughman, and
J. P. Deavor, Spectrochim. Acta 40B, 317 (1985).
8. P. S. Moussounda, P. Ranson, and J. M. Mermet, Spectrochim.
Acta 40B, 641 (1985).
9. K. Tanabe, H. Haraguchi, and K. Fuwa, Spectrochim. Acta 38B,
49 (1983).
10. K. Fallgatter, V. Svoboda, and J. D. Winefordner, Appl. Spectrosc.
25, 347 (1971).
11. J. Hubert, M. Moisan, and A. Ricard, Spectrochim. Acta 33B, 1
(1979).
12. A. Lifshitz, G. B. Skinner, and D. R. Wood, J. Chem. Phys. 70,
5607 (1979).
13. A. Bouvier, S. Abed, B. Charlet, and A. Bouvier, J. Phys. Coll., C7.,
40, 197 (1979).
14. J. M. Workman, P. G. Brown, D. C. Miller, C. J. Seliskar, and J.
A. Caruso, Appl. Spectrosc. 40, 857 (1986).
15. M. H. Abdallah and J. M. Mermet, Spectrochim. Acta 37B, 391
(1982).
16. J. M. Workman, P. A. Fleitz, H. B. Fannin, J. A. Caruso, and C.
J. Seliskar, Appl. Spectrosc. 42, 96 (1988).
17. C. Dupret, B. Vidal, and P. Goudmand, Rev. Phys. Appl. 5, 337
(1970).
18. J. Terrien, N.P.L. Symposium No. 11, Interferometry 435, Teddington (1959).
19. G. H. Dieke and H. M. Crosswhite, J. Quant. Spectrosc. Radiat.
Transfer 2, 97 (1962).
20. S. De Jaegere, M. Willems, and C. Vinckier, J. Phys. Chem. 86,
3569 (1982).
21. M. Capitelli and E. Molinari, Topics in Current Chemistry 90, 59
(1980).
22. A. T. Zander and G. M. Hieftje, Appl. Spectrosc. 35, 357 (1981).
23. F. Etile, Th~se, Universit~ Pierre et Marie Curie, Paris (1979).
24. T. Carrington and H. P. Broida, J. Molec. Spectrosc. 2, 273 (1958).
25. D. E. Rapakoulias and D. E. Gerassimou, Proc. 8th Intern. Symp.
Plasma Chem., Tokyo, 3, 1967 (1987).
26. A. M. Diamy, N. GonzalezFlesca, and J. C. Legrand, Spectrochim.
Acta 41B, 317 (1986).
Analysis of Pure Lead and Lead Alloys for the
Automotive Lead/Acid Battery Industry by
Inductively Coupled Argon Plasma Emission Spectroscopy
T. J. SCHMITT,* J. P. WALTERS, and D. A.
WYNNt
Johnson Controls, Inc., Corporate Applied Research Center, 5757 N. Green Bay Avenue, Milwaukee, Wisconsin 53209 (T.J.S.,
D.A.W.); and Department of Chemistry, St. Olaf College, Northfield, Minnesota 55057 (J.P.W.)
Pure lead and lead alloy dissolution procedures suitable for elemental
determinations by inductively coupled argon spectroscopy are described.
The group of lead types investigated consisted of pure lead, Pb-Sb alloys,
Pb-Ca-AI alloys, and Pb-Ca-Sn-AI alloys. Major alloy concentrations
range up to 10% Sb, 2% Sn, 0.2% Ca, and 0.1% AI. Trace impurities
from 0.5 to 10 ppm are determined in pure lead and in several lead alloys.
Major and trace element determinations are routinely performed simultaneously with the use of five to seven matrix-matched standards for
each alloy type. Accuracy and precision data for certified and internal
reference materials are reported. Chemical, spectral, and metallurgical
interferences are also discussed.
Index Headings: Lead; Pure lead; Lead alloys; Dissolution procedures;
Inductively coupled argon plasma; ICP.
INTRODUCTION
T h e purpose of this work is to d e m o n s t r a t e t h a t inductively coupled argon plasma emission spectroscopy
(ICP) is a very precise and accurate tool for the analysis
of pure lead and lead alloys. Inductively coupled argon
plasma emission spectroscopy is an ideal instrumental
m e t h o d of analysis for lead as a result of the argon plasma
stability, the absence of major spectral interferences for
Received 11 November 1988.
* Present address: Compunetics Inc., 2000 Eldo Road, Monroeville, PA
15146.
t Author to whom correspondence should be sent.
Volume 43, Number 4, 1989
the lead alloys analyzed, and simultaneous multielement
analysis capability. Major alloy elements and trace impurities in lead can be routinely d e t e r m i n e d without any
special instrument, standard, or sample preparation considerations. T h e lead types of interest in this work are
pure lead, calcium-aluminum alloys, calcium-tin-alum i n u m alloys, and a n t i m o n y alloys. T o t a l weight percent
of lead in these alloys never drops below ninety in routine
analyses.
T h e accurate analysis of pure lead and lead alloys is
very i m p o r t a n t in the lead/acid b a t t e r y industry. Trace
impurities as well as major alloy c o m p o n e n t s affect the
overall performance of the b a t t e r y system. Several elem e n t s (such as Te, As, and Se) at trace levels ( < 2 ppm)
c a u s e severe g a s s i n g p r o b l e m s w h e n b a t t e r i e s are
charged. 1,2 Gassing is the generation of hydrogen and
oxygen from the electrochemical dissociation of water.
T h e presence of a gassing element is t h o u g h t to lower
the hydrogen overcharge potential by several mechanisms. 1 Excessive gassing depletes the electrolyte, shortens b a t t e r y life, and causes battery case bulging. Major
alloy concentrations are i m p o r t a n t for proper b a t t e r y
grid strength, corrosion resistance, and proper b a t t e r y
grid manufacturing. B a t t e r y grids provide the mechanical s u p p o r t and electrical current p a t h in b o t h the negative and positive plates of the battery. All of these factors affect b a t t e r y life and performance.
0003-7028/89/4304-068752.00/0
© 1989 Society for Applied Spectroscopy
APPLIED SPECTROSCOPY
887
TABLE 1. Description of ICP instrument.
Jobin Yvon 1.0-m PaschenRunge JY-48P vacuum
with 39 channels. Thermoregulation of polychromator. Modifiedso that analyte emission can be
blocked from the 182.037nm and 220.353-nmexit
slits.
Entrance is 0.020 mm and is
Slits
computer controlledfor
background correction.Exits are 0.039 and 0.050 ram.
Holographic, 2550 groves/
Grating
mm.
Dispersion
First order, 0.39 nm/mm.
Spectral range
160-416 nm.
Optical path
Extension tube purged with
argon.
2. Mini-monochro- Instruments SA, Model H-20.
mator
3. Monochromator Hilger-Engis, Model 1000.
Plasma Therm, Model 2500,
Source
Generator
27.12 MHz. Auto impedance matching network
with remote control.
Quartz, 135 mm.
Torch
MAK-10 cross-flow."PerisalSample
Nebulizer
tic pump used (0.8 mL/
transport
min).
MAK-20, glass expansion
Spray chamber
chamber with baffle."
Digital Equipment Corp.
Computer
Processor
PDP 11/03.
system
Disk drives
Two 8-in. RX02 drives.
Printer
LA 120 Decwriter.
"Sherritt Gorden Mines Limited, Fort Saskatchewan, Alberta Canada
T8L 2P2.
Spectrometers 1. Polychromator
Arc emision spectroscopy,3,4,5 f a m e atomic absorption, 4,~,6x-ray fluorescence,7 and wet chemical methods, 4,5
have been the methods of analysis used for trace and
alloy element determinations in the battery industry. All
of these methods are useful but have certain undesirable
features. Flame atomic absorption and wet chemical
methods are very time-consuming when multielement
analysis is needed. X-ray fluorescence is useful for multielement analysis of major alloy elements but does not
have the required detection limits for trace analysis. Arc
emission is used extensively in the industry because of
the speed of analysis, solid sampling, minor and major
element determinations, and minimal sample preparation. However, arc emission does have inherent problems
in the analysis of lead. First, only the surface of the lead
sample is analyzed. This will yield an accurate analysis
only if the sample is homogeneous. Second, the lead is
soft, and incorrect polishing of lead disks can cause erroneous results due to smearing of the sample surface.
Third, the limits of quantitation (LOQ) for some elements (such as Sb, Co, and Ni) in pure lead and lead
alloys are not low enough for all applications. Fourth,
the lead standards which would be needed for arc emission techniques would be very difficult to prepare for the
large number of elements routinely determined by ICP.
Solid calibration standards for arc emission analysis are
not certified and are usually made by the user. Solution
688
Volume 43, Number 4, 1989
TABLE II. Routine operating conditions.
Frequency
RF power
Reflected power
Argon outer flow
Argon intermediate flow
Argon carrier flow
Observation height
Sample pump rate
Integration time:
Off peak
On peak
Cleaning time
Number of integrations
(MHz)
(kW)
(W)
(L/min)
(L/min)
(L/rain)
(mm)
(mL/min)
27.12
1.0
<3
17.0
0.4
0.76
10
0.8
(s)
(s)
(s)
10
10
30
3
calibration standards for ICP analysis can be traced to
certified reference materials and can be compared to
certified reference materials on a routine basis.
Inductively coupled argon plasma emission spectroscopy is the instrumental method of analysis for pure
leads and lead alloys in this laboratory. The ICP instrument provides the required detection limits, the required
LOQ, increased accuracy and precision, simultaneous
major and trace element determinations, and the use of
aqueous standards. Proper lead sample treatment will
yield an accurate ICP analysis of the lead sample while
minimizing homogeneity problems. Sample preparation
does require additional time but is justified by the gain
in accuracy, precision, and lower LOQ.
Lead sample preparation techniques and instrument
modifications are discussed in this work. Problems associated with a stray light interference and element segregation in lead alloys will be described. The results of
an interlaboratory sample exchange will also be discussed.
EXPERIMENTAL
A p p a r a t u s . The ICP instrumentation used for the analysis of pure lead and lead alloys is described in Table I.
Under normal operating conditions the mini-monochromator is set at 766.490 nm for K, and the Hilger-Engis
monochromator is set for 588.995 nm for Na. The HilgerEngis monochromator is also used for element wavelengths which are not available on the polychromator.
Off-peak background correction is not available with the
two monochromators.
The normal operating conditions for the analysis of
pure lead and lead alloys are listed in Table II. Limits
of detection (LOD) obtained under these conditions for
standard calibration solutions are reported in Table III.
Experimental and literature LODs 8,9,1° that were determined in water are included in Table III for comparison.
To convert the LOD (ng/L) in the lead solution to ppm
in lead, multiply the LOD in the 2 % lead solution by
0.050. Similarly the LOD in the 12% lead solution is
multiplied by 0.00888 to obtain ppm in lead.
R e a g e n t s . House-distilled water was purified to 18 M~
by a Milli-Q water purification system (Millipore Corp.,
Bedford, MA). All further references to water imply the
use of 18 M~2 water. Reagent-grade nitric acid, d-tartaric
acid (crystal), and glacial acetic acid were used for sample
preparation ("Baker Analyzed, ''® J. T. Baker Chemical
Co., Phillipsburg, NJ). The nitric acid was further pur-
T A B L E III.
ICP wavelengths and limits of detection (LOD) in liquid
matrices.
Water
C h a n - Elenel m e n t
1
2
3
4
6
7
8
9
10
11
13
14
15
16
17
20
21
22
23
24
25
26
27
28
30
31
33
35
36
38
40
41
"See Ref.
~)See Ref.
• External
d See Ref.
P
S
Sn
T1
Se
Mo
Pt
Sb
W
Te
Cd
Co
Ni
Ba
Fe
Mn
Cr
Mg
Bi
A1
V
Ca
Cu
Ag
Ti
Zr
As
Zn
Sr
K¢
Be
Na c
Wave length
(nm)
178.290
182.037
189.980
190.864
196.026
202.030
203.646
206.833
207.911
214.281
226.502
228.616
232.003
233.527
238.204
257.610
267.716
279.553
306.772
309.278
310.230
315.887
324.754
328.068
334.941
343.823
189.042
202.548
407.771
766.490
313.042
588.995
Lit.
Exp.
(ng/mL) a (ng/mL)
2%
Lead
12 %
Lead
(ng/mL)
(ng/mL)
65
46
23
49
36
7
47
38
30
72
2
6
17
5
4
0.5
4
0.5
84
30
20
18
6
6
1
7
65
4
0.3
76
0.2
32
430
93
110
920
119
34
200
66
40
87
4
8
30
4
6
2
5
0.9
130
27
8
11
8
13
3
13
150
10
0.5
140
0.2
130
30 b
17
27
50
5.3
37
21
20
27
2.3
4.7
10
2.7
3.1
0.93
4.7
0.1
50
15
4.3
15
3.6
4.7
2.5
4.7
91
2.7
0.28
60 d
0.18
19
1430
980
350
4110
690
230
2060
120
46
100
4
7
26
5
5
10
2
0.5
155
47
18
8
13
18
5
23
284
73
0.7
81
0.4
120
8.
9.
monochromator.
10.
ified by distillation before use. Reagent-grade hydrogen
peroxide (30%, EM Science, Cherry Hill, NJ) and Puratronic ® lead (II) nitrate (99.999%, Johnson Matthey,
Royston, England) were used for sample and calibration
standard preparation.
Dissolution Preliminaries. Lead dissolution and dilution of sample solutions were performed in an acid fume
hood. Dissolutions were done on Lindberg hot plates
(Model 53202, Watertown, WI). The surface temperature
of the hot plate was measured with a surface thermometer (PTC ® Model 314F, Pacific Transducer Corp., Los
Angeles, CA). All reported temperatures were the measured surface temperature of the hot plate during dissolution. The hot plates were always preheated to the
desired temperature before use.
Glassware was soaked in 10 % (v/v) hydrochloric acid,
followed by 10 % (v/v) nitric acid, and finally rinsed with
water before use. All sample solutions were brought to
volume with water in class-A volumetric glassware. Samples during dissolution were covered with watch glasses.
Separate 150-mL beakers (Pyrex ®, Corning, NY) and
volumetric glassware were set aside for each alloy type
to minimize potential cross contamination.
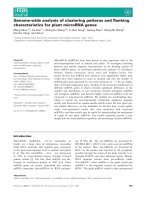
All samples were cast three-inch-diameter disks, one
half inch thick. The disks of lead alloys and pure lead
FIG. 1. D i a g r a m of a cast lead disk with 3 saw cuts m a d e in t h e disk.
Saw chips are collected a n d m i x e d to obtain a representative s a m p l i n g
of t h e lead disk.
used in this study were sampled by using a hard steel
saw (nickel chrome alloy steel, Model D-23, Disston,
Danville, VA). A separate saw for each alloy type was
used. No measurable contamination has been seen from
this saw type. At least three radial saw cuts towards the
center of the sample were made, and the saw chips were
collected to obtain a representative sample for analysis.
Sawing chips were collected and mixed, and the appropriate amount was weighed for dissolution. A diagram
of a cast disk with three saw cuts is shown in Fig 1. Pig
lead ears and other cast lead shapes (such as chill-cast
lead) were sampled in a similar fashion. A detailed description of the sawing procedure and a discussion of the
importance of obtaining a representative sample of lead
alloys are given in the section of this article that describes
sample segregation.
Pure Lead and CA Alloy Dissolution. Pure lead and
lead-calcium-aluminum (CA) alloys were dissolved by
using 30 mL of (1:4) nitric acid to treat 6.000 + 0.005 g
of saw chips. The sample was heated at 130-140°C until
dissolved (1-2 h) with frequent swirling. Then water was
added to the hot sample solution to obtain an approximate volume of 40 mL. The solution was mixed well to
prevent precipitation of lead nitrate. The sample solution was cooled and diluted to 50 mL with water. The
resulting solutions showed no visible precipitation for
four or more days after dissolution.
The nitric acid concentration in the pure lead and CA
alloy dissolution procedure is extremely important. Nebulization problems occur when the nitric acid concentration used for dissolution is greater than 4 molar. Lead
nitrate will precipitate in the spray chamber and inside
the ICP torch when the nitric acid concentration equals
or exceeds this concentration. Lowering the amount of
nitric acid used or evaporation to almost dryness are
alternative methods to eliminate the problems caused by
excess nitric acid. But both alternative methods have
undesirable effects. The dissolution time will increase if
the nitric acid concentration is too low. Evaporation of
the sample to almost dryness to remove excess nitric acid
causes precipitation of lead nitrate in minutes to hours
in the sample solution, and the sample preparation time
APPLIED SPECTROSCOPY
689
TABLE IV. ICP recovery data for a 25-ppm (3.0 mg/L in a 12% Pb
solution) addition of each element.
Channel
3
7
9
10
11
13
14
15
16
17
20
21
22
23
24
25
26
27
28
30
31
33
35
36
38
41
Element
Sn
Mo
Sb
W
Te
Cd
Co
Ni
Ba
Fe
Mn
Cr
Mg
Bi
Al
V
Ca
Cu
Ag
Ti
Zr
As
Zn
Sr
K
Na
Result"
(ppm)
25
25
22
25
24
26
25
24
24
25
24
23
25
28
28
24
25
24
26
25
27
26
24
24
25
25
RSD
( %)
13
4.2
8.4
2.7
14
3.0
3.2
3.9
3.2
4.3
7.6
3.6
8.3
6.9
6.2
5.3
3.2
5.1
5.1
3.1
8.3
7.3
3.5
3.1
7.2
16
Recovery
( %)
100
100
88
100
96
104
100
96
96
100
96
92
100
112
112
96
100
96
104
100
108
104
96
96
100
100
TABLE V. Long- and short-term precision for WRM.
Short (same day)a
ISample
WRM-A
(SB alloy)
WRM-B
(SB alloy)
WRM-C
(CA alloy)
Element
Ag
As
Bi
Cu
S
Sb
Sn
Ag
As
Bi
Cu
S
Sb
Sn
Ag
A1
Ca
Mg
Average
( % )a
0.0020
0.130
0.0075
0.0656
0.0059
1.90
0.0812
0.0016
0.0541
0.0089
0.0350
0.0048
2.81
0.822
0.0003
0.0136
0.1120
0.0002
RSD RSD°
(%)
(%)
2.0
0.4
1.0
1.7
2.7
0.4
3.5
3.0
6.8
2.2
3.2
1.6
2.8
1.0
3.1
3.3
6.5
2.2
4.5
0.7
2.2
1.2
1.3
0.4
3.9
0.7
6.8
0.6
2.6
1.5
0.7
0.3
0.5
0.9
2.3
1.3
Long (6 months)b
Average
(%)
0.0024
0.143
0.0081
0.0674
0.0055
1.95
0.0868
0.0018
0.0585
0.0092
0.0351
0.0045
2.78
0.804
0.0003
0.0136
0.1120
0.0002
RSD
(%)
6.6
3.7
12
3.2
16
2.4
2.5
7.1
3.8
12
4.2
28
2.2
2.2
18
1.5
1.7
18
aAverage of 3 analyses (only measurable results listed).
~'Average of 45 analyses, 6/87-12/87 (W8117--18 analyses).
cInstrumental precision of one analysis (three 10-s integrations).
dDivide % results listed by 0.005 for SB alloys and by 0.000833 for
the CA alloy to obtain mg/L in solution.
aAverage of 20 analyses (3 months).
is increased. Precipitation of lead nitrate in the sample
solution is undesirable because trace impurities could
coprecipitate. T h e procedure described for dissolution
of pure leads and CA alloys works satisfactorily.
Recovery results for t w e n t y different dissolutions in
the pure lead matrix are reported in Table IV. One spikes
6 g of pure lead metal with 25 p p m (3 m g / L in solution)
of each element. This sample is then treated as an unknown, with the use of the normal dissolution and I C P
procedures for pure lead. T h e concentration of 25 p p m
was a typical concentration for most impurities when
present. T h e low recovery for Sb m a y be due to the
instability of the Sb spiking solution when treated with
the pure lead dissolution procedure. Some of the higher
recoveries (i.e., Bi and A1) m a y be due to trace impurities
of these elements in the pure lead sample which was
spiked. T h e recoveries are acceptable, and the majority
of the recoveries were 100 _+ 4%.
CSA Alloy Dissolution. Lead-calcium-tin-aluminum
(CSA) alloys were dissolved by using 50 m L of a nitric
acid/tartaric acid mixture (75 g tartaric acid and 50 m L
of nitric acid diluted to 1 L) to t r e a t 2.000 _ 0.005 g of
saw chips. T h e sample was heated at 220-240°C until
dissolved (2-3 h). It was necessary to add additional
nitric acid/tartaric acid mixture during the course of the
dissolution procedure to maintain the solution volume
at a b o u t 40 mL, to p r e v e n t tin oxide precipitation. Once
dissolved, water was a d d e d to the hot sample solution
to obtain an approximate volume of 60 mL, with thorough mixing to p r e v e n t precipitation of lead nitrate. T h e
sample solution subsequently was cooled and diluted to
100 m L with water.
This dissolution procedure was used to prevent form a t i o n and precipitation of tin oxide from the high concentration of tin present in the CSA alloys analyzed (up
690
Volume 43, Number 4, 1989
to 2 %). Tartaric acid prevents the insoluble Sn oxides
from forming. T h e CSA dissolution time has a strong
d e p e n d e n c e on the particle size of the sample. Dissolution time for saw chips was a b o u t 2 h, and cut pieces (up
to 1~ in. in length) took up to 3 h.
SB A l l o y D i s s o l u t i o n . L e a d a n t i m o n y (SB) alloys were
dissolved by first adding 30 m L of water to 2.000 +_ 0.005
g of saw chips. T h r e e m L of glacial acetic acid and then
15 m L of 30% h y d r o g e n peroxide were a d d e d and mixed.
T h e reaction was allowed to proceed until gas evolution
ceased (usually 15 min). T h e n 20 m L of a solution containing 250 g tartaric acid diluted to 1 L with water was
added, and the sample solution was mixed well. T h e n 5
m L of nitric acid was added, and the solution was mixed
again. T h e solution was then heated at 220-240°C until
all solids were dissolved (15-30 min). Dissolution time
was increased when Sb and Sn concentrations were high.
For example, an SB alloy t h a t contained 7% Sb or 0.8%
Sn would take a b o u t 30 min for complete dissolution.
A n t i m o n y concentrations greater t h a n 7 % in the SB alloys require a longer dissolution time, b u t these highconcentration SB alloys will be dissolved by the SB alloy
dissolution procedure. It is r e c o m m e n d e d t h a t sample
weights be reduced for these alloys to avoid lead nitrate
precipitation problems caused by dissolution times longer t h a n 30 minutes.
T h e sample solutions were immediately removed from
the hot plate when all solids were dissolved, then 5 m L
of nitric acid was a d d e d to the hot sample solution,
b r o u g h t to a volume of 85 m L with water, and mixed.
This step was i m p o r t a n t in preventing lead nitrate precipitation. T h e sample solution was cooled and diluted
to 100 m L with water. T h e reader is advised to use ext r e m e caution when mixing these solutions in the volumetric glassware. Pressure builds up because of the excess h y d r o g e n peroxide present. Solutions were mixed
T A B L E VI. Comparison of ICP and flame atomic absorption results
for the SB alloy W R M - D (%).
Element
Sb
As
Sn
Cu
Bi
ICP
Standard
average deviation
n
6.00
0.158
0.219
0.0100
0.0234
11
11
11
11
3
0.08
0.006
0.004
0.0003
0.0002
n
Difference
(%)
30
30
40
18
3
2.0
1.3
0.5
3.0
6.0
AA a S t a n d a r d
average deviation
5.88
0.16
0.22
0.097
0.022
0.13
0.01
0.02
0.0005
0.001
the use of the same reagents and acids used in sample
dissolution. The appropriate amount of high-purity
lead(II) nitrate was added to the calibration standard
solutions in order to matrix match the samples. Aliquots
of multielement (Inorganic Ventures, Inc., Brick, NJ),
10,000 mg/L single analyte, and 1000 mg/L single analyte
standard stock solutions were used to prepare 5-7 calibration standard solutions for ICP analysis of the lead
sample solutions.
Major alloy elements contained in the standard stock
solutions were compared to appropriate National Bureau
of Standards (NBS) standard reference materials (SRM)
(Gaithersburg, MD). The SRMs were 10,000 mg/L stock
solutions of each analyte. A sulfur containing SRM was
not available at the time, and the standard stock solution
was compared to 1000 mg/L standard stock solutions
from other suppliers.
Reference Materials. To date, certified reference materials appropriate to the analysis of the currently manufactured battery alloy are unavailable. Working reference materials (WRM) are internal lead lots which have
been designated as a reference material and are repeatedly analyzed in our laboratory. Working reference materials are prepared with each sample batch and are analyzed as samples on the ICP instrument. A W R M is
designated for each type of lead alloy. The WRMs provide an additional check for the accuracy of the prepared
calibration standard solutions and correct ICP operation.
It is understood that this is only true if the WRMs do
not change with time and that the WRMs are homogeneous. Precision data for some WRMs are provided later
in this article.
° L e a d s a m p l e s prepared by a HBF4/HNO3/tartaric acid dissolution
procedure.
gently 2-3 times and the built-up pressure was released
before the mixing was continued.
The proposed dissolution mechanism occurring in SB
alloy treatment involved two parallel reactions. The 30 %
hydrogen peroxide converted elemental lead to lead(II)
oxide. The lead(II) oxide was then dissolved by the glacial acetic acid. Black elemental Sb was suspended in
solution. Tartaric acid was added, and a white complex
with lead formed. Nitric acid was then added to dissolve
the tartaric acid lead complex and the elemental Sb. The
tartaric acid and the 30 % hydrogen peroxide prevented
insoluble Sn and Sb oxides from forming.
The SB alloy dissolution procedure will not completely
dissolve SB alloys with Sn concentrations greater than
200 mg/L in solution. A tin oxide precipitate, as confirmed by x-ray fluorescence, begins to form during dissolution, yielding a hazy solution caused by the fine suspension of the tin oxide. Sample weight can be reduced
in order to maintain Sn concentrations in the final solution at less than 200 mg/L, to produce a clear solution.
The final lead concentration can be matched to the standards by adding the required amount of lead(II) nitrate
at the end of the dissolution procedure. It has been observed that the fine tin oxide suspension does not affect
the analysis of the National Bureau of Standards Standard Reference Material 53e (0.5 g sample weight used).
The composition of this SB alloy was about 10 % Sb and
6% Sn. Solutions containing the tin oxide suspension
must be mixed well before ICP analysis.
Calibration Standards. All standard stock solutions
were acidic aqueous solutions, and the calibration standard solutions were matrix matched to the sample with
R E S U L T S AND D I S C U S S I O N
Reference Materials. Reference materials are a key to
providing analytical continuity for any analysis. Results
of a reference material analysis yield a historical record
of instrument performance, calibration standard stability and consistency, operator differences, and sample dissolution problems. It is always a difficult process to determine the exact cause of erroneous results, and the
analysis of an appropriate reference material will help
simplify the problem-solving process. Working reference
materials are used for this purpose in our laboratory.
TABLE VII. ICP results for two SB alloy reference materials (%).
N B S S R M 53e"
,Alpha m e t a l s BM-1 (lot A) b
Element ¢
Certified
ICP
SD
Certified
ICP
SD
Sb
Sn
As
Cu
Bi
Ni
Fe
S
Cd
Mn
Ag
10.26
5.84
0.057
0.054
0.052
0.003
<0.001
10.21
5.86
0.0504
0.0484
0.0485
0.0028
<0.0006
0.0041
0.0037
0.0028
0.0230
0.08
0.09
0.0021
0.0009
0.0030
0.0002
13.96
0.97
0.94
14.81
1.04
1.06
< 0.004
< 0.01
<0.002
<0.0006
<0.001
<0.0004
<0.0001
<0.002
0.14
0.04
0.03
0.0005
0.0002
0.0003
0.0009
" T h e s a m p l e size was 0.5 g because of Sn a n d Sb concentrations. L e a d nitrate was a d d e d to t h e s a m p l e s after dissolution to m a t r i x - m a t c h
calibration s t a n d a r d s .
h T h e s a m p l e size was 1.0 g because of Sb concentration. L e a d n i t r a t e was also added.
" T h e e l e m e n t s S, Cd, M n , a n d Ag are included for i n f o r m a t i o n only.
APPLIED SPECTROSCOPY
691
J
TABLE VIII. Results for newly released NBS SRM (%).a
NBS C2416
EleJCI
NBS
ment
average
SD
certified
E.U.b
A1
< 0.0015
( < 0.0001)o
Sb
0.787
0.034
0.79
0.01
As
0.0568 0.0024
0.056
0.001
Bi
0.108
0.009
0.10
0.01
Cd
<0.0002
(0.0002)
Ca
<0.0010
(<0.001)
Co
<0.0005
(<0.0002)
Cu
0.0652 " 0.0015
0.065
0.002
Fe
<0.0003
(<0.0005)
Mn
<0.00005
(<0.0005)
Ni
<0.0010
(<0.0005)
Se
<0.0010
Ag
0.0043 0.0002
0.0044 0.0002
S
0.0010 0.0004
0.0015 0.0005
Te
<0.0025
(<0.0005)
Sn
0.0971 0.0046
0.09
0.01
Zn
<0.0005
(<0.0005)
a Certified in March 1988.
~'E.U.: estimated uncertainty.
° Uncertified information given by NBS in parentheses.
JCI
average
< 0.0002
0.0091
0.0125
0.0096
<0.00005
<0.0002
<0.00005
0.0107
<0.0001
<0.00005
<0.0001
<0.0005
0.0101
<0.0020
0.0004
0.0053
<0.0005
NBS C2417
NBS
SD
certified
( < 0.0001)
0.0002
0.010
0.0003
0.011
0.0011
0.010
(<0.0002)
(<0.001)
(<0.0002)
0.0005
0.010
(<0.0003)
(<0.0003)
(<0.0005)
0.0010
0.010
(<0.0005)
0.0001 (<0.0005)
0.0014 (<0.010)
(<0.0005)
Hence, appropriate working reference materials are analyzed with each batch and for each alloy type. These
results along with sample analysis results are kept in
c o m p u t e r storage for on-line searching, sample tracking,
generation of formal reports, statistical analysis, and future use.
Short- and long-term averages of three W R M s are reported in Table V. Working reference materials W R M - A
and W R M - B are SB alloys. W R M - C is a CA alloy. Average results have changed very little over the six-month
period. T h e r e is a noticeable decrease in precision for all
elements, which can be a t t r i b u t e d to the variables of
i n s t r u m e n t performance, s t a n d a r d stability, operator differences, and dissolution problems, and to the possibility
of slight W R M heterogeneity. I n s t r u m e n t a l precision is
included for comparison.
Sulfur averages and precision are poor because of the
inability to obtain dissolution reagents totally sulfur free
for ICP analysis. T h e r e is approximately 1 mg/L sulfur
in the sample solution due to the reagents used. Useful
analytical d a t a can be obtained by careful preparation
of the samples and calibration standard solutions by using the same reagents. Sulfur in the two SB alloy W R M s
has been compared to results for a colorimetric m e t h o d
(H2S generation method). T h e r e is agreement within the
standard deviation of the two methods. Sulfur also seems
to be a difficult element to d e t e r m i n e in the lead matrix,
as described in the section of this article t h a t discusses
quality assurance.
Table VI shows a comparison of flame atomic absorption (AA) and ICP data for an SB alloy which is used as
a W R M for 6 % SB alloys. T h e r e is good agreement between results, even though different instrumental and
dissolution procedures were used. Also, the AA d a t a were
collected in 1974, while the ICP d a t a were collected on
the same lot in 1987. This information indicates t h a t this
lot of SB alloy was fairly homogeneous and t h a t the two
dissolution procedures yielded a complete dissolution of
this alloy.
Tables VII and VIII contain results for four NBS SRMs
692
Volume 43, Number 4, 1989
E.U.
0.001
0.001
0.001
0.001
0.001
NBS C2418
NBS
SD
certified
E.U.
(<0.0001)
(<0.0001)
(<0.0001)
(<0.0005)
0.00001
0.0003 0.0001
(<0.0005)
(<0.0005)
(<0.0001)
(<0.0005)
(<0.0005)
( < 0.0005)
JCI
average
< 0.0002
<0.0008
<0.0010
<0.0010
0.00032
<0.0002
<0.00005
<0.0001
<0.0001
<0.00005
<0.0001
<0.0005
0.00071 0.00005 0.0007
<0.0020
(<0.0005)
<0.0003
<0.0010
(<0.0005)
(<0.0005)
<0.0005
0.0001
and one reference material from Alpha Metals. All samples in Table VII and N B S S R M C2416 in T a b l e VIII
were p r e p a r e d according to the SB alloy dissolution procedure. T h e weights of samples in T a b l e VII were reduced because of the high Sn and Sb concentrations.
Reference materials C2417 and C2418 were p r e p a r e d by
the pure lead dissolution procedure. All materials were
t r e a t e d as routine unknown samples in preparation and
in the ICP analysis.
T h e r e is good agreement between the certified values
and the experimental ICP results. All ICP results (except
As in C2417) are within the estimated error which was
supplied by the NBS. T h e As value is just above the high
end of the estimated error supplied by the NBS. An
investigation of the high As result in N B S C2417 has not
been done. It should be n o t e d t h a t the S R M C2416 does
not have a suitable alloy composition for use as a reference material for routine SB alloy b a t t e r y lead analysis.
E l e m e n t S e g r e g a t i o n . E l e m e n t segregation can be a
major problem in the analysis of pure lead and lead alloys. Segregation in the samples taken from the molten
lead is caused by the slow cooling of lead in the mold.
Some elements form oxides or sulfides, or stay in the
elemental form during solidification of the lead. T h e s e
compounds and elements precipitate out of solution and
rise to the top of the mold because these precipitated
compounds have a lower density t h a n lead. T h e precipitated components will not have a chance to segregate
when the lead sample is properly cooled and will be uniformly frozen in position.
Major problems arise in the analysis of lead samples
when ICP instrumental results are compared to arc emission results on segregated samples. Table IX shows a
comparison of ICP and arc emission results obtained on
a segregated sample. T h e routine ICP results are obtained by the s t a n d a r d sawing procedure described below, which represents the average cross-section composition of the cast disk. T h e b o t t o m ICP results are
obtained by sawing across the entire b o t t o m surface of
the disk to a d e p t h of a b o u t 1/~Gof an inch. T h i s is the
TABLE IX.
Segregation" of a CA alloy sample disk (%).
Element
ARC
emission
results
ICP
routine b
ICP bottom
ICP center
ICP top
Ca
A1
Sb
Cu
Bi
Ag
Te
0.104
0.0225
0.0002
0.0004
----
0.111
0.0376
0.0001
0.0012
0.0090
0.0019
0.0013
0.101
0.0275
<0.0001
0.0010
0.0098
0.0020
<0.0003
0.102
0.0284
<0.0001
0.0010
0.0099
0.0019
<0.0003
0.138
0.0582
0.0001
0.0017
0.0101
0.0020
0.0027
Te
\
" Ca, A1, Cu, and Te are segregated in this CA alloy disk.
b Cross-cut of bottom, center, and top layers.
surface that faces the bottom of the disk mold and is the
machined surface routinely used for arc emission analysis. The assumption being made by arc emission users
is that this surface cools the quickest and should be
representative of the sample taken. Practical experience
does not support this assumption when severe segregation has occurred. The center ICP results are obtained
by sawing parallel to the two 3-in.-diameter surfaces towards the center of the disk. The top ICP results are
obtained by sawing across the entire top surface of the
disk to a depth of about ~6 of an inch. The top surface
is at the top of the disk mold and is exposed to air during
cooling. Sampling the disk as described above is a simple
procedure and serves the purpose for identifying segregation problems.
Segregation problems can be minimized through the
sampling and sawing procedure described below. A 3-in.diameter cast disk approximately 1/2 in. thick is made by
sampling a molten pot of lead. The sampling ladle must
be hot, and the mold must be at room temperature or
cooler. 11This procedure allows fast cooling of lead, which
will minimize segregation. Even if segregation does occur,
it will occur symmetrically around the center of the lead
disk. Hence, one can obtain a representative sample by
sawing radially through the sample disk.
It can be seen in Table IX that the arc emission results
and the bottom ICP results are within reasonable agreement. The A1 result by ICP is still a little high, but this
may be an artifact of the deeper sampling of the disk
\
Pb
Cd
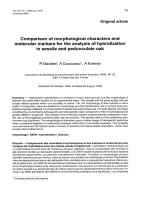
FIG. 3. Top view of the shutter system with the shutter closed which
is keeping the Pb emission at 220.353 n m from passing through the
exit slit.
surface. Arc emission techniques analyze < 1 mm depth
of the lead sample surface, depending on the metal hardness. Aluminum and calcium in the middle and top layers
show severe segregation in this lead disk. When the arc
emission results and ICP results are in such disagreement, as indicated by the normal ICP results, the cause
is usually a segregation problem. Other elements that
show segregation in this sample are Te and Cu. Similarly,
trace elements such as Sb, Ni and Na have been observed
to segregate in other CA alloys. Sulfur and selenium have
been observed to segregate in SB alloys. Element segregation problems have also been observed in CSA alloys
for the same elements that segregate in CA alloys.
Interferences. The wavelengths used for ICP analysis
of pure lead and lead alloys were chosen to minimize
spectral interferences in the lead matrix and to provide
the lowest possible detection limits. Platinum (203.646
nm) does have spectral interferences from Sb (203.662
and 203.639 nm), 12 Fe (203.643 nm), 12 and Pb (about
:_"-L--:.::_-::
JOHNSON CONTROLS FOCAL CURVE
CVerfical Scale X2 Horiz. - I0 crn Ticks)
I000 mm Radius
2 5 5 0 Grooves/ram
35 o Incidence
Ar
v
TI
~ . , P~ s
~ ' ~
~eo~A-~'~~
~~"
Sb,,,,
Cd.Pb.
Te ,,,
~' "~%%-\
~:o~B~
SHUTTER CLOSED
I]
1
[
::!
i"
~!
H
t
FIG. 2. Side view of the digital linear actuator in the polychromator
of the ICP instrument. T h e open and closed shutter positions are
illustrated.
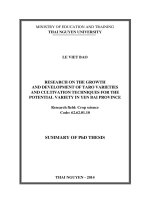
FIG. 4. Diagram of the Johnson Controls, Inc. focal eurve for the
polychromator installed in the I n s t r u m e n t s SA JY48P ICP.
APPLIED
SPECTROSCOPY
693
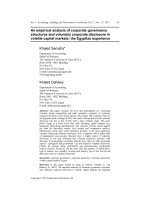
ELEMENT=
TE
WAVELENGTH=
I CLOSED-BLANK
2 OPEN ~BLANK
3 CLOSED"STANDARD
2142.81
!
6640,
ELEMENT= CO
12 CLOSED-BLANK
OPEfl -BLANK
WAVELENGTH= 2265.02
3 CLOSED-STANDARD
-
23200.
-
I
[
6240*
-
21200,
-
19200,
-
I
!
5840,
i
5440,
3
17200,
15200.
l
P
[
-
I
-
N
4640.
I
i
/\
-
i
5040.
I
I
I
I
-
-
II
-
13200.
2
s
!
4240,
-
2
!
i
I
3840.
T
-
[
y
12
-
//
r
3040.
2/2
-
!
2--2
/3-- 1
9200.
i
r
3440.
11200,
3
I
"~2
%3
~2--2
3~3
3/
2640.
+ ....
30
3~i,~
! ....
! ....
20
! ....
2
/
2~2
~ , i__ i__ i__ i _ i - - i - - i_.~ 3/___i__ i xu3-- 3
!1---!
I0
....
! ....
0
! ....
! ....
-I0
! ....
!-~-1!-1~3
-20
3200.
-30
1 ....
! ....
30
! ....
20
! .....
! ....
IO
RELATIVE DIAL POSITION
Background spectra for 12% lead with the (1) shutter closed
and (2) shutter open; and (3) spectrum for 2.4 m g / L tellurium with the
shutter closed. The stray light effect is eliminated with the shutter
closed.
FIG. 5.
203.646 nm; the exact wavelength has not been determined). There are other slight spectral interferences in
the literature which have no effect on pure lead and the
alloy analyses discussed in this work. This is because the
elements that cause spectral interferences are not generally present at concentrations that would cause a significantly enhanced signal. All of these potential interfering elements are monitored, and corrections could be
made. There was one direct spectral overlap interference
for antimony at 206.833 nm--that is significant enough
to be mentioned--for which no literature reference was
found. A 24 mg/L tungsten solution yields a false concentration of 4 mg/L antimony at 206.833 nm. This interference has not been a problem, because tungsten has
not been observed in the leads analyzed.
Stray light from the intense Pb emission at 220.353
nm was identified in the secondary optics of the polychromator. A previously described 13 shutter system was
installed to eliminate the stray light effect. The shutter
system blocks the path of the Pb emission at 220.353 nm
and prevents all light at this wavelength from passing
through the exit slit in the polychromator. A channel at
220.353 nm had been installed in the polychromator initially for low-level Pb determinations in other matrixes.
The stray light effect was unforeseen at the time the ICP
instrument was manufactured.
Blocking of the lead emission at 220.353 is accom-
694
\2
5200.
t
/ 3 ~ 3
/ \
7200.
I
2~2/
/
2\2.2
'
Volume 43, Number 4, 1989
! ---~-
1 ....
0
! ---
1 ! - 1--
I-~---~.
-I0
I--I
! -1--
-20
!
-30
RELATIVE DIAL POSITION
Background spectra for 12% lead with the (1) shutter closed
and (2) shutter open; and (3) spectrum for 0.3 m g / L cadmium with the
shutter closed. The stray light effect is eliminated with the shutter
closed.
Fro. 6.
TABLE X. Effect of stray light from Pb (220.353 nm) on the background signal from a 4% lead solution ~ and a 12% lead solution with
the shutter open.
Distance
Wavelength from Pb
Channel Element
(nm)
slit (nm)
1
2
3
4
5
6
7
8
9
10
11
12
13
14
15
16
17
20
21
P
S
Sn
T1
As
Se
Mo
Pt
Sb
W
Te
Pb
Cd
Co
Ni
Ba
Fe
Mn
Cr
178.290
182.037
189.980
190.864
193.696
196.026
202.030
203.646
206.833
207.911
214.281
220.353
226.502
228.616
232.003
233.527
238.204
257.610
267.716
42.1
38.3
30.4
29.5
26.7
24.3
18.3
16.7
13.5
12.4
6.1
0
6.1
8.3
11.7
13.2
17.9
37.3
47.4
4% P b
12% P b
Increased
signal (%)
Increased
signal (%)
15
10, 6 b
50
13
19
17
74, 31 b
175, 120 b
47
38
See Ref. 13.
b Slotted sleeves placed on photomultiplier tubes.
c Spectral interference from Pb.
7.3 b
10 b
40
c
15
10
100 b
350 b
32
15
7.5
T A B L E XI. Change in limits of detection (LOD) in 12% Pb for straylight-affected channels.
Channel
Element
Wavelength
(nm)
Shutter
open
(ng/mL)
5
6
7
8
9
10
11
12
13
14
15
16
As
Se
Mo
Pt"
Sb
W
Te
Pb
Cd
Co
Ni
Ba
193.696
196.026
202.030
203.646
206.833
207.911
214.281
220.353
226.502
228.616
232.003
233.527
4200
2000
450
1600
480
280
230
-20
8
31
9
"Spectral
Shutter
closed
(ng/mL)
Improvement
factor
3100
690
230
2100
120
46
100
-4
7
26
5
1.4
2.9
2.0
-4.0
6.1
2.3
-5.0
1.1
1.2
1.8
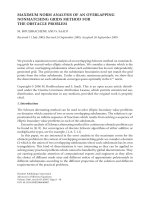
interference from Pb.
plished by a digital linear actuator which has been installed in the polychromator of the ICP instrument. Figure 2 shows a side view of the system when the lead
emission is allowed to pass and when the emission is
blocked out. When the shutter is open, as illustrated by
Fig. 2, the lead emission at 220.353 nm is allowed through
the exit slit; and when the shutter is closed, the lead
emission at this wavelength is blocked out (not allowed
through the exit slit). The top view of the shutter system
is shown in Fig. 3. A diagram of the entire polychromator
arrangement is shown in Fig. 4.
Figures 5 and 6 demonstrate the stray light problem,
caused by a 12 % lead solution, as seen by the two neighboring channels, which are Te 214.281 nm and Cd 226.502
nm. The Pb stray light interference is eliminated when
the intense lead emission is not allowed to pass through
the polychromator exit slit set at 220.353 nm. Wavelengths from 193.696 nm (As) to 238.204 nm (Fe) have
stray light spectral interferences similar to those shown
T A B L E XII.
Element
Sb
Sn
Cu
As
Bi
Ag
S
Element
Sb
Sn
Cu
As
Bi
Ag
S
in Figs. 1 and 2. It is interesting that there is very little
change in the off-peak background when the lead emission is blocked out. Only Te and Cd have a significant
increase in off-peak background. The off-peak background emission for the open and closed positions of a
12% lead solution for the other elements is the same.
Notice that the stray light peaks have a broader base
than the analyte emission peaks. This result is probably
due to the scatter pattern of the Pb emission inside the
polychromator. The bandpass at half-height for the scattered background peak is about one and a half times that
of the analyte Te peak. The bandpass at half-height for
the Cd analyte and that for background peak are about
the same. Analyte emission is passed through the exit
slit, so that the peak shape is regulated by the exit slit
width and height, but the stray light can broaden as it
is scattered in the secondary optics.
The effect of stray light on other surrounding channels
is shown in Table X. A comparison is shown for the 4 %
Pb solution between the shutter system and the use of
slotted sleeves on the photomultiplier tubes. 13The stray
light effect is reduced, but not eliminated. Data for the
12 % Pb solution were collected with the slotted sleeves
still in place. There is a slight increase in the Pt channel
background peak (about 2%), but the Pb spectral interference at this wavelength makes it difficult to determine the presence of a stray light effect. Table XI lists
the detection limits in 12% lead with the shutter open
and closed. All limits of detection show improvement
with the shutter closed. Again, the Pt channel is affected
by a major interference from lead.
Quality Assurance. This laboratory is constantly testing reference materials and evaluating the testing procedures used for lead analyses to obtain the most accurate results possible. Another useful evaluation tool is a
sample exchange program with other similar laboratories. Table XII contains the results collected from 12
Results for W R M - B as reported by different laboratories (%).
J o h n s o n Controls a
2.77
0.799
0.0350
0.0578
0.0091
0.0018
0.0046
___ 0.07 I C P c
_+ 0.021 ICP
_+ 0.0016 I C P
_+ 0.0030 I C P
+ 0.0012 ICP
___ 0.0001 I C P
_ 0.0011 I C P
G r a n d average
2.81
0.80
0.037
0.055
0.0097
0.0016
0.0051
_+ 0.10 All
_ 0.02 All
_+ 0.003 All
_+ 0.005 All
_+ 0.0008 All
+ 0.0003 All
+ 0.0016 All
J C I 1983 b
2.82 ICP
0.786 I C P
0.0330 ICP
0.0517 I C P
--0.0055 ICP
Lab #2
Lab #3
Lab #4
Lab #5
Lab #6
2.88 A R C d
0.85 A R C
0.039 A R C
0.06 A R C
0.0105 A R C
0.0017 A R C
0.0041 A R C
2.71 I C P
0.82 ICP
0.035 ICP
0.056 I C P
0.010 I C P
0.0012 I C P
0.0040 I C P
2.69 A R C
0.78 A R C
0.033 A R C
0.054 A R C
0.010 A R C
0.0011 A R C
0.0036 A R C
2.92 A R C
0.81 A R C
0.035 A R C
0.052 A R C
0.009 A R C
0.0018 A R C
0.0049 A R C
2.73 W e t °
0.81 A R C
0.041 A R C
0.058 A R C
0.0107 A R C
0.0021 A R C
0.0069 Col t
Lab #7
Lab #8
Lab #9
Lab #10
L a b #11
Lab #12
3.00 A R C
0.78 A R C
0.037 A R C
0.055 A R C
0.0087 A R C
0.0016 A R C
0.0052 A R C
2.75 A R C
0.80 A R C
0.033 A R C
0.05 A R C
0.011 A R C
0.0015 A R C
0.0043 Col
2.78 W e t
0.78 W e t
0.035 AA*
0.06 A R C
0.010 A R C
0.0012 A R C
0.0056 Col
2.80 A R C
0.77 A R C
0.038 A R C
0.05 A R C
0.0090 A R C
0.0020 A R C
0.0053 A R C
2.84 A R C
h
0.0586 A R C
0.0623 A R C
0.0092 A R C
0.0011 A R C
0.0093 A R C
2.96 A R C
0.81 A R C
0.043 A R C
0.045 A R C
0.0089 A R C
0.0015 A R C
0.0034 A R C
Average a n d SD of 80 analyses (7/87-2/88).
h J o h n s o n Controls results as of 8/1/83. T h e s e results are excluded from t h e g r a n d average.
o ICP: inductively coupled argon plasma.
d ARC: ac s p a r k a n d dc arc emission.
e Wet: titration, gravimetric.
Col: colorimetric.
AA: atomic absorption.
h Calibration s t a n d a r d n o t available.
APPLIED SPECTROSCOPY
695
i n d e p e n d e n t laboratories which routinely analyze lead.
T h i s s t u d y was done to assess the sources of variability
in the analysis of SB alloys.
A single well-characterized a n t i m o n y alloy was subm i t t e d to all laboratories to minimize a n y variability in
results due to a heterogeneous sample. S a m p l e s were
m a d e f r o m an SB alloy working reference m a t e r i a l which
was identified as W R M - B . T h i s m a t e r i a l has been used
in this l a b o r a t o r y since 1982, and results f r o m 1983 are
included in T a b l e X I I for comparison. Results for
W R M - B for the last 6 m o n t h s were averaged to obtain
results r e p r e s e n t a t i v e of c u r r e n t l a b o r a t o r y operations.
S o m e of the inconstancy in results is evident f r o m the
s t a n d a r d deviation seen within our r e p e a t e d l a b o r a t o r y
results. T h e worst case is for the sulfur value. A large
variation in sulfur results b e t w e e n laboratories is evident
a n d was a n t i c i p a t e d because of the large s t a n d a r d deviation observed for our l a b o r a t o r y sulfur results. Sulfur
segregation in SB alloys a n d m e t h o d of analysis precision
contribute to the poor precision seen for sulfur. T h e grand
average a n d s t a n d a r d deviation of all l a b o r a t o r y results
are also listed in T a b l e X I I . T h e s t a n d a r d deviation of
all results is consistent with and slightly higher t h a n the
s t a n d a r d deviation of our l a b o r a t o r y results. T h i s additional i n f o r m a t i o n helps confirm t h a t I C P is an accurate m e t h o d for lead analyses.
A n o t h e r notable difference in results is seen for antimony. T h e a n t i m o n y result for this l a b o r a t o r y seems to
be accurate on the basis of the fact t h a t 6 different laboratories a n d 3 different analytical m e t h o d s gave results
within the s t a n d a r d deviation of the result o b t a i n e d b y
this laboratory. T h e key factor to this s t a t e m e n t is t h a t
the s a m e results were o b t a i n e d b y 3 i n d e p e n d e n t analytical methods. F u t u r e studies of this kind are being
p l a n n e d a n d will involve sending other working reference
m a t e r i a l s to the a p p r o p r i a t e laboratories.
CONCLUSIONS
T h r e e different dissolution procedures for lead and
lead alloys followed by I C P i n s t r u m e n t a l analysis are
696
Volume 43, Number 4, 1989
now routinely e m p l o y e d in this laboratory. T h e s t r a y
light effect in the described I C P i n s t r u m e n t has b e e n
corrected, a n d this allows lower detection limits for 10
e l e m e n t s in a 12% lead matrix. T h e I C P m e t h o d s have
been shown to be very precise a n d accurate in the analysis
of p u r e lead a n d the lead alloys described in this work.
E r r o n e o u s results which are caused b y segregation in lead
have been m i n i m i z e d in I C P analysis b y using the described s a m p l i n g m e t h o d s . T h e results of an inter-labo r a t o r y p r o g r a m have b e e n reported, which confirm the
accuracy a n d precision of the I C P m e t h o d .
1. J. R. Pierson, C. E. Weinlein, and C. E. Wright, in Power Sources
5, D. H. Collins, Ed. (Academic Press, London, 1975), p. 97.
2. B. K. Mahato and W. H. Tiedemann, J. Electrochem. Soc. 130,
2139 (1983).
3. D. J. Knauer and J. A. Norris, in Methods for Analytical Atomic
Spectroscopy, R. A. Storer, Ed. (ASTM, Philadelphia, 1987), 8th
ed., p. 715.
4. European Lead Development Committee--Analytical Subcommittee, Survey of Methods of Analysis for Lead Alloys (Lead Development Association, London, Great Britain, 1978).
5. European Lead Development Committee--Analytical Subcommittee, Survey of Methods of Analysis for Lead and Lead Alloys
(Lead Development Association, London, Great Britain, 1971).
6. D. Mongan, American Chemical Society Great Lakes Regional
Meeting, Purdue University (1974), Paper No. 14.
7. C. L. Fillmore, A. C. Eckert, Jr., and J. V. Seholle, Appl. Speetrosc.
23, 502 (1969).
8. P. W. J. M. Boumans, Line Coincidence Tables for Inductively
Coupled Plasma Atomic Emission Spectroscopy (Pergamon Press,
New York, 1980), Vols. 1 and 2, p. 1.
9. M. L. Parsons, A. Forster, and D. Anderson, An Atlas of Spectral
Interferences in ICP Spectroscopy (Plenum Press, New York, 1980),
p. 10.
10. R. K. Winge, V. A. Fassel, V. J. Peterson, and M. A. Floyd, Inductively Coupled Plasma-Atomic Emission Spectroscopy, An Atlas of Spectral Information (Elsevier Science Publishing Company,
New York, 1985), p. 272.
11. T. Torok, J. Mika, and E. Gegus, Emission Spectrochemical Analysis (Crane Russak, New York, 1978), p. 25.
12. A. N. Zaidel, V. K. Prokof'ev, S. M. Raiskii, V. A. Slavnyi, and E.
Ya. Shreider, Tables of Spectral Lines (IFI/Plenum, New York,
1970), p. 347.
13. T. Schmitt and J. P. Walters, 25th Rocky Mountain Conference,
Denver (1983), Paper No. 2.