Decadal change of forest biomass carbon stocks and tree demography in the Delaware River Basin
Bạn đang xem bản rút gọn của tài liệu. Xem và tải ngay bản đầy đủ của tài liệu tại đây (2.52 MB, 10 trang )
Forest Ecology and Management 374 (2016) 1–10
Contents lists available at ScienceDirect
Forest Ecology and Management
journal homepage: www.elsevier.com/locate/foreco
Decadal change of forest biomass carbon stocks and tree demography
in the Delaware River Basin
Bing Xu a,⇑, Yude Pan b, Alain F. Plante a, Arthur Johnson a, Jason Cole c, Richard Birdsey b
a
Department of Earth and Environmental Science, University of Pennsylvania, 40 South 33rd Street, Philadelphia, PA 19104, USA
USDA Forest Service, Northern Research Station, 11 Campus Blvd., Newtown Square, PA 19073, USA
c
USDA Forest Service, Northern Research Station, Syracuse, NY 13210, USA
b
a r t i c l e
i n f o
Article history:
Received 11 January 2016
Received in revised form 18 April 2016
Accepted 20 April 2016
Keywords:
Forest biomass
Carbon stock
Tree demography
Delaware River Basin
a b s t r a c t
Quantifying forest biomass carbon (C) stock change is important for understanding forest dynamics and
their feedbacks with climate change. Forests in the northeastern U.S. have been a net carbon sink in
recent decades, but C accumulation in some northern hardwood forests has been halted due to the impact
of emerging stresses such as invasive pests, land use change and climate change. The Delaware River
Basin (DRB), sited in the southern edge of the northern hardwood forest, features diverse forest types
and land-use histories. In 2001–2003, the DRB Monitoring and Research Initiative established 61 forest
plots in three research sites, using Forest Service inventory protocols and enhanced measurements.
These plots were revisited and re-measured in 2012–2014. By comparing forest biomass C stocks in
the two measurements, our results suggest that the biomass C stock of the DRB forest increased, and
was thus a carbon sink over the past decade. The net biomass C stock change in the Neversink area in
the north of the DRB was 1.94 Mg C haÀ1 yrÀ1, smaller than the biomass C change in the French Creek area
(2.52 Mg C haÀ1 yrÀ1, southern DRB), and Delaware Water Gap Area (2.68 Mg C haÀ1 yrÀ1, central DRB).
An increase of dead biomass C accounted for 20% of the total biomass C change. The change of biomass
C stocks did not correlate with any climatic or topographic factors, but decreased with increasing stand
age, and with tree mortality rate. Mortality rates were highest in the smallest size class. In most of the
major tree species, stem density decreased, but the loss of biomass from mortality was offset by recruitment and growth. The demographic changes differ dramatically among species. The living biomass of
chestnut oak, white oak and black oak decreased because of the large mortality rate, while white pine,
American beech and sweet birch increased in both biomass and stem density. Our results suggest that
forests in the DRB could continue to be a carbon sink in the coming decades, because they are likely at
a middle successional stage. The linkage between demography of individual trees species and biomass
C change underscores the effects of species-specific disturbances such as non-native insects and
pathogens on forest dynamics, and highlights the need for forest managers to anticipate these effects
in their management plans.
Ó 2016 Elsevier B.V. All rights reserved.
1. Introduction
As global forest C stocks have increased consistently in the past
several decades, their potential to sequester additional atmospheric carbon dioxide (CO2) is considered a mitigation strategy
to reduce global warming (Luyssaert et al., 2007; Pan et al.,
2011; Ciais et al., 2013). Quantifying forest biomass C stock change
and identifying the factors causing changes are important to
understand forest dynamics and its feedback with climate change,
and to successfully implement forest carbon management
⇑ Corresponding author.
E-mail address: (B. Xu).
/>0378-1127/Ó 2016 Elsevier B.V. All rights reserved.
strategies (Hyvonen et al., 2007; Bonan, 2008). However large
uncertainty still exists as forest biomass is highly heterogeneous
(both spatially and temporally), and its dynamics are determined
by different factors at different scales (Birdsey et al., 2006; Pan
et al., 2013).
It is widely accepted that seasonal weather and climate regulate
short-term fluctuations of carbon uptake, while disturbance history and management control C stock change on decadal time
scales (Barford et al., 2001; Williams et al., 2012). Climatic, topographic and geologic factors determine forest dynamics across a
broader range of environmental conditions, while stand age and
gap dynamics control biomass accumulation at smaller spatial
scales (Brandeis et al., 2009; Yi et al., 2010). Living tree biomass
2
B. Xu et al. / Forest Ecology and Management 374 (2016) 1–10
is one of the largest and most active C pools in forest ecosystems
(Woodbury et al., 2007), and its dynamics are driven by the balance
among three forest demographic changes: growth, recruitment
and mortality (including harvesting). Each of these demographic
changes can vary with age and species (Vanderwel et al., 2013a;
Rozendaal and Chazdon, 2015). Long-term, periodic biometric
measurements provide a unique opportunity to not only investigate forest biomass C dynamics at the regional scale, but also link
biomass C stock with demographic change (Curtis et al., 2002; Xu
et al., 2014).
Based on inventory data, forests in the northeastern U.S. are an
overall net sink for atmospheric carbon in recent decades (Turner
et al., 1995; Lu et al., 2013). However, C accumulation in some
northern hardwood forests has been halted due to the impact of
emerging stresses such as invasive pests, land use change and climate change (Brooks, 2003; Siccama et al., 2007; Duarte et al.,
2013). Small scale disturbances such as invasive pests, disease
and selective harvesting may affect species differently, and
increase C turnover at regional scales (Makana et al., 2011). The
Delaware River Basin (DRB), situated in the southern edge of the
northern hardwood forest, features diverse forest types and landuse histories. Most of the forests in the DRB are secondary forests
recovering from agricultural land use, with stand ages around 80–
100 years. Succession in the DRB during the recovery process may
affect forest biomass C change (Xu et al., 2012). These forests are
sensitive to the controlling factors defining forest dynamics; thus,
quantifying the biomass C stock in DRB forests acts as the basis for
regional C cycle assessment and is essential for effective forest C
management.
During 2001 to 2003 a set of forested plots were established in
the DRB, and their total biomass C stock (including above- and
belowground biomass, but not including fine roots; see below)
was measured in a multi-agency program known as the Collaborative Environmental Monitoring and Research Initiative (CEMRI).
Here we report the results of re-measuring these plots using the
same measurement protocols in 2012–2013. By comparing forest
biomass C in the two measurements, and carefully documenting
demographic changes, the major goals of this study are: (1) to
quantify biomass C stock change in the DRB forest during the
recent decade, (2) to investigate the controlling factors of forest
biomass C stock change at the regional scale, and (3) to examine
the impact of tree demographic change on biomass C change by
comparing biomass C change in different size groups and tree
species.
2. Methods
2.1. Research area
The Delaware River is one of the major rivers in the midAtlantic region of the United States, draining an area of about
33,000 km2 in Pennsylvania, New Jersey, New York, Delaware,
and Maryland. The Delaware River Basin is characterized by a
humid continental climate, with mean annual temperature of 9–
12 °C and mean annual precipitation of 1143 mm (Kauffman
et al., 2008). The DRB is located in the eco-zone of deciduous forests and is ecologically diverse, comprised of five physiographic
provinces and multiple species assemblages that represent most
of the major eastern U.S. forest types (Murdoch et al., 2008).
Three areas in the DRB were selected as intensive monitoring
and research sites for process-level studies in forested landscapes:
the Neversink River Basin (NS) in the northern, mostly forested
region of the Appalachian Plateau province; the Delaware Water
Gap Area (DEWA) with three small watersheds (Adams Creek,
Dingman’s Falls and Little Bushkill) lying in the central Appala-
chian Plateau Province; and the French Creek Watershed (FC) in
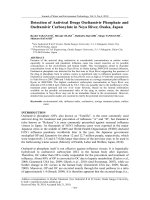
the midbasin Piedmont province (Fig. 1).
During 2001–2003, 68 inventory plots were randomly located
in the three sites. Within each plot, all trees with diameter at
breast height (DBH) greater than 5 inches (12.7 cm) were measured and marked, and the specific locations of the plots were
mapped. In 2012–2013, 61 forested plots of the 68 original plots
were revisited and biomass parameters were re-measured using
the same protocols. Seven plots were not revisited due to accessibility issues such as permission from the landowner. Between the
two measurements some plots had been disturbed by human
activities, such as clear-cut or land use change. Anthropogenic disturbance was recorded in the field and while disturbed plots were
included in the determination of biomass estimates, they were not
included in the demographic analyses. The number of usable plots
for demographic analyses was therefore reduced from the original
68 to 55 plots.
2.2. Field measurements and biomass C calculations
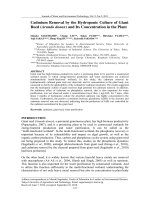
The plot design and sampling method follow the forest inventory protocols in the two measurements, including additional variables that were specified for the intensive study sites (Fig. 2; U.S.
Department of Agriculture, 2014). Each plot has four round subplots, in total covering an area of 672.44 m2. Live and dead trees,
stumps and residue materials were measured in each subplot.
DBH, total and bole height, tree species, and status change (e.g.,
live versus dead) of each tree were recorded. A laser rangefinder
was used to measure the tree and bole heights. Each subplot has
one microplot (area: 13.49 m2) and three transects (length:
7.92 m). Live and dead sapling (1 in. < DBH < 5 in.), seedling
(DBH < 1 in.), shrub and herb coverage were measured in the
microplots. Coarse woody debris and fine woody debris were measured along the transects.
Within each plot, two trees close to the subplots that represent
the dominant species and growing condition of the forest stand
were selected as site trees. The age of the site trees was measured
by counting rings in a tree core. The stand ages of plots were determined as the mean age of the two site trees.
Field measurement data from the original 2001 to 2003 inventory were acquired from a U.S. Forest Service (USFS) database generated by the CEMRI project ( />research/drb/summary.html). Data from the two inventories were
compiled into a single database for biomass C calculations. Cole
et al. (2013) provides a detailed description of the database, which
contains CEMRI project data on tree biomass.
Biomass of live trees, dead trees, saplings, seedlings, shrubs,
coarse woody debris, fine woody debris, and stumps were each calculated and summed for each of the two survey periods. Fine root
biomass was the only biomass pool not estimated in either survey
in this study. As a result, we assumed that fine root biomass did not
change between the two sampling periods. The species-specific
allometric equations from Jenkins et al. (2004) were used to calculate above-ground tree biomass (Suppl. Table 1) as described in
Cole et al. (2013). The proportion of coarse roots biomass to aboveground biomass was estimated based on DBH for each species as
described in Jenkins et al. (2004) and Cole et al. (2013). The total
biomass of each tree was the sum of above-ground biomass and
coarse roots. Dead tree biomass was multiplied by a reduction factor according to their decade classes and species groups (Waddell,
2002) to subtract the biomass loss from decomposition. Biomass of
coarse woody debris and fine woody debris were calculated using
standard equations (Woodall and Williams, 2005). Stump biomass
was calculated as coarse root biomass multiplied by the reduction
factor according to the decade classes. A conversion factor of 0.5
was used to convert biomass to C stock. The biomass C change of
B. Xu et al. / Forest Ecology and Management 374 (2016) 1–10
3
Fig. 1. The hydrological boundary of the Delaware River Basin and the main stream and tributaries of the Delaware River. The three research areas of the current study are
shown in different shading color. The red dots represent the locations of forest biomass plots. (For interpretation of the references to color in this figure legend, the reader is
referred to the web version of this article.)
each component was calculated as the difference of biomass C in
the two measurements divided by the number of years between
the two measurements in each of the plot.
2.3. Data analysis
Mean topographic and climatic factors for each site (Table 1)
were spatially averaged from spatial data layers based on the coordinated of each plots. The elevation data was derived from Global
Land Cover Characterization datasets with a spatial resolution of
1 km ( and temperature and precipitation data were derived from the PRISM Gridded Climate data as
30-year means from 1981 to 2010 with a spatial resolution of
800 m ( Thornton
et al., 2014). Wet deposition data were inorganic nitrogen deposition at a spatial resolution of 1 km and averaged from 1983 to 2007
(Grimm, 2008). Plot-scale climate and N deposition data were the
non-spatially averaged data mentioned above, while the elevation
data were values directly measured in the field. Measured topographic data was found to be essentially the same as database
values.
Biomass C stocks in each component and their changes between
the two measurements were averaged by site and in all plots combined. In addition, all live trees were classified into size classes by
their DBH using 5 cm intervals from 10 to 40 cm (size classes 1–6).
Trees with DHB 40–50 cm were classified as size class 7 and trees
DBH > 50 cm were classified to size class 8. The biomass C stocks of
living tree were summed by each tree size class. Mortality rates
4
B. Xu et al. / Forest Ecology and Management 374 (2016) 1–10
Differences among the three sites in total biomass C and biomass C change were compared using one-way ANOVA. Type II
(major axis) regression analysis was used to test correlations
between biomass C stock changes and biotic (stand age, tree mortality rate, Shannon’s biodiversity index) and abiotic (slope, elevation, temperature, precipitation, and wet nitrogen deposition)
factors in all plots combined to detect regional patterns.
A non-metric multidimensional scaling (NMS) analysis was
conducted using PC-ord (Version 6.08, MjM Software, Gleneden
Beach, Oregon, U.S.A.) on the basis of live tree data to differentiate
the species composition in the three sites. Species that were present in only one plot were removed from the database, after which
one plot in FC had only 4 trees remaining and was thus also
removed from the database. As a result, data for 60 plots and 28
species (Suppl. Table 3) were used in the NMS analysis. NMS ordination was run using k = 3 dimensions, as this led to significantly
lower stress than the two-dimensional model and was not substantially improved by using four dimensions. One-way ANOVA
on plot scores of the first two NMS axes was used to test for differences in species composition among the three sites. Statistically
significant differences between each pair of sites were compared
using the Wilcoxon method.
Fig. 2. Plot design used for forest measurement (Revised from U.S. Department of
Agriculture, Forest Service. (2002)). Trees within each subplot were measured.
Sapling and seedlings were measured in microplots. Coarse and fine woody debris
were measured on transects.
3. Results
3.1. Forest biomass C stock change and its components
(% yrÀ1) of each plot and each size class were calculated by solving
the equation:
ð1 À MÞn ¼ 1 À
N dead
Nliv e1
where M is the mortality rates, Ndead is the number of trees that died
between the two measurements, N liv e1 is the number of live trees in
the first measurement, and n is the number of years between the
two measurements. The mortality rates and proportions of biomass
C from each tree size class in the two measurements were compared to examine the structure change in each site.
Tree species richness (S), Shannon’s diversity index (H), and
evenness (EH) were calculated for each plot using the live tree data
in the second measurement to represent the species diversity at
plot level. Species importance values were determined for each site
and species following Forrester et al., 2003 (Suppl. Table 2):
Importance values ¼ ðrelative live density
þ relative live basal areaÞ Ä 2
The 15 most important species in each site were selected and their
biomass C and density change was examined. Biomass C loss from
mortality was calculated as the biomass C of trees that were live
in the first measurement and died before the second measurement.
Biomass C gain from recruitment was calculated as the biomass of
new ingrowth trees in the second measurement. Biomass C gain
from growth was calculated as the biomass increase for trees living
in both of the two measurements.
In the 61 plots that were revisited in 2012–2013, the mean biomass C stock in the second measurement was 161.2 Mg C haÀ1. The
net biomass C stock change between the two measurements was
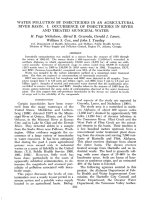
2.01 Mg C haÀ1 yrÀ1. Among the 61 plots, six plots had visible disturbances in the past decade. The biomass C loss in the disturbed
plots was up to 9.72 Mg C haÀ1 yrÀ1 (Fig. 3). In the remaining 55
undisturbed plots, the total biomass C stocks were 146.7 Mg C haÀ1
in FC, 114.7 Mg C haÀ1 in DEWA, and 159.3 Mg C haÀ1 in NS in the
first measurement during 2001–2003 (Table 2). In the second measurement during 2012–2014 of the same 55 undisturbed plots, the
total biomass C stocks were 172.1 Mg C haÀ1 in FC,
142.2 Mg C haÀ1 in DEWA, and 185.1 Mg C haÀ1 in NS. The forests
in the most northern site (NS), with higher elevation, and greater
precipitation and nitrogen deposition, had larger biomass C pool
than the other sites. The net biomass C stock change between the
two measurements was 2.52 Mg C haÀ1 yrÀ1 in FC, 2.68 Mg C haÀ1
yrÀ1 in DEWA, and 1.94 Mg C haÀ1 yrÀ1 in NS. The mean biomass
C stock change in all the undisturbed plots was 2.45 Mg C haÀ1
yrÀ1. The undisturbed forests in the DRB were therefore a net
carbon sink over the recent decade (i.e., the mean of each site
was above the zero line in Fig. 3). The total biomass C change did
not differ among the three sites (p = 0.76).
Among all biomass components, live trees were the largest C
pool and C sink over the past decade (Table 2). On average, live tree
biomass contributed 76.9% of the total biomass C change. Dead biomass was also an important contributor to total biomass C change
(20.1%). Dead trees and CWD were the two largest C pools in dead
biomass. Variation in biomass C change among plots was large,
especially in the dead biomass components (Table 2).
Table 1
Environmental conditions in the three research sites in the Delaware River Basin. All data were extracted from geographic information layers, and mean values for each site are
shown. The elevation data was derived from Global Land Cover Characterization datasets ( Annual temperature and precipitation are 30-year means
from 1981 to 2010 (Thornton et al., 2014). Wet deposition is inorganic nitrogen deposition from 1983 to 2007 (Grimm, 2008).
French Creek (FC)
Delaware Water Gap (DEWA)
Neversink (NS)
Elevation (m)
Mean annual temperature (°C)
Mean annual precipitation (mm)
Wet deposition (kg N haÀ1)
Average stand age
166
360
773
11.16
8.53
5.75
1171
1219
1503
6.55
6.33
6.44
85
107
91
5
B. Xu et al. / Forest Ecology and Management 374 (2016) 1–10
Table 3
Type II (major axis) correlations between biomass C change and environmental
factors. (* represents statistical significance at p < 0.05, and ** represents statistical
significance at p < 0.01).
Fig. 3. Biomass C stock changes in the three research sites and for all plots
combined. Red dots represent the six disturbed plots. Boxes above the zero line
represent increasing biomass C stock. Lines in the boxes show the median and the
25% and 75% quantiles, while bars outside the boxes show the 5% and 95% quantiles.
Outliers are shown as black dots. FC: French Creek, DEWA: Delaware Water Gap,
NS: Neversink. (For interpretation of the references to color in this figure legend, the
reader is referred to the web version of this article.)
Table 2
Total biomass C stocks in the two measurements (unit: Mg C haÀ1) and biomass C
stock change in different components (unit: g C mÀ2 yrÀ1) in each site and in all plots
combined. Standard deviations among plots are given in the parentheses. p values
show the statistical significance of differences among sites in a one-way ANOVA.
(* represents statistical significance at p < 0.05, and ** represents statistical
significance at p < 0.01).
FC
(n = 13)
DEWA
(n = 28)
Total Biomass C (Mg C haÀ1)
2001–2003
146.7 (50) 114.7 (39)
2012–2014
172.1 (56) 142.3 (51)
Biomass C change (g C mÀ2 yrÀ1)
Live tree
216.0 (255) 204.8 (262)
Dead tree
57.3 (104) 20.2 (50)
Sapling
À6.0 (21)
À6.2 (28)
Seedling
1.2 (6)
10.2 (13)
CWD
5.8 (45)
18.0 (63)
FWD
À15.5 (29) 5.5 (29)
Stump
À8.2 (33)
À5.0 (37)
Live biomass 212.1 (262) 210.7 (258)
Dead biomass 40.2 (131) 57.0 (122)
Total
NS
(n = 14)
Total
(n = 55)
p value
159.3 (37)
185.1 (45)
133.6 (45)
160.2 (53)
0.004⁄⁄
0.017⁄
131.1 (117)
À12.8 (113)
18.4 (40)
2.1 (4)
36.0 (37)
1.2 (14)
188.7 (231)
30.8 (106)
0.2 (31)
6.0 (11)
19.7 (54)
À0.5 (27)
À6.0 (36)
195.9 (228)
49.3 (118)
0.56
0.18
0.036⁄
0.010⁄
0.34
0.06
0.80
0.84
0.49
151.2 (108)
42.6 (104)
252.3 (224) 267.7 (247) 193.9 (142)
245.2 (218) 0.76
Variable
Slope
Intercept
R2
p
Slope (degree)
Elevation (m)
Precipitation
Temperature
Total biomass (2001–2003)
Mortality rate
Stand age
Shannon’s diversity index
4.13
À0.18
À6.09
18.48
0.004
À56.52
À2.13
À92.91
216
320
963
92
189
335
454
368
0.010
0.037
0.033
0.030
0.089
0.173
0.054
0.032
0.47
0.16
0.18
0.21
0.25
<0.01⁄⁄
0.09⁄
0.19
(>45 cm DBH) accounted for 37.8% of the total live tree biomass.
Live tree biomass increased between the two measurements in
all size classes, but the change in biomass was greater in large size
classes than in small size classes (Fig. 5a–c). Mortality rates were
also greater in smaller size class (10–20 cm DBH, Fig. 6d) compared
to trees in the middle size class (20–35 cm DBH). High variability
was observed in large size class mortality rates because there were
few large trees (>35 cm DBH, Fig. 5d).
Tree species composition of forests in NS was significantly different from FC and DEWA, but forests in FC and DEWA had more
similar species composition. In results of NMS, all of the NS plots
were in the lower-left quadrant, with only 4 plots from FC and
DEWA (Fig. 6). The NS plots had significantly smaller scores on
both of the axes comparing with FC and DEWA (axis 1: NS vs FC
p < 0.01, NS vs. DEWA p < 0.01, axis 2: NS vs FC p < 0.01, NS vs.
DEWA p < 0.01). However the difference between FC and DEWA
was not significant on both of the axes (axis 1: p = 0.73, axis 2:
p = 0.59). Forests in NS were dominated by maple–beech–birch forest, while in FC and DEWA consisted of tree species typical of a
southern deciduous type of oak-hickory forest. The DEWA site,
located between the other two sites from north to south, was a
transition zone for tree species (Table S1).
Over the past decade, in spite of reduced stem density, the biomass C stock increased in the 15 most important species in the DRB
forest (Fig. 7). Growth of existing trees accounted for most of the
biomass C increase, while recruitment contributed little to total
biomass C change. Conversely, mortality played an important role
in counterbalancing growth and recruitment. Because of the high
mortality rate, the living biomass of chestnut oak, white oak and
black oak declined in FC and DEWA. White pine, red oak and sweet
birch increased in both biomass and stem density in the oakhickory forests in DEWA. In the maple–beech–birch forests in NS,
the stem density of American beech, and biomass C stock of yellow
birch and hemlock increased dramatically.
3.2. Controlling factors in biomass C change
4. Discussion
For all undisturbed plots combined, the change in biomass C
stock between the two measurements was poorly correlated with
climatic and topographic factors, although the three sites have very
different environmental conditions (Table 3, Fig. 4). Stronger correlations were detected between biomass C change and biotic factors
(Table 3, Fig. 4). The change in biomass C decreased significantly
with tree mortality rate between the two measurements
(r = 0.417, p < 0.01). Biomass C change was negatively correlated
with stand age (r = À0.232, p = 0.09). No significant correlation
was detected between biomass C change and tree species diversity.
3.3. Forest demographic changes
Large trees (>35 cm DBH) made greater contributions to the
living biomass, especially in FC where the largest size class
4.1. The large biomass C sink in the DRB forests
The average biomass C stock in the DRB forest was smaller than
previously reported for old growth forests in the region (Gunn
et al., 2014; McGarvey et al., 2015), but comparable with the average biomass C stocks in deciduous forests of the northeast U.S. estimated by forest inventory data (Nunery and Keeton, 2010). The
change of biomass C stocks over the past decade in the DRB forest
was greater than other long-term biomass measurement in northern hardwood forests, such as the Adirondack Mountains (Bedison
et al., 2007) and the Hubbard Brook Valley (van Doorn et al., 2011).
The change in biomass C stock was also greater than the national
average of biomass C stock change during 2000–2007 (Pan et al.,
2011).
6
B. Xu et al. / Forest Ecology and Management 374 (2016) 1–10
Fig. 4. Relationship between biomass C stock change and environmental (a and b) and biotic (c and d) factors among all the undisturbed plots. Plots in the three sites are
shown in different colors and shapes. (For interpretation of the references to color in this figure legend, the reader is referred to the web version of this article.)
Forest biomass C stocks differed significantly among the three
sites (Table 2). Larger potential biomass C stocks in the maple–
beech–birch forest and fewer disturbances at high elevation may
be responsible for the larger biomass C stock in the NS (Turner
et al., 1995). For the two sites dominated by oak-hickory forest
(i.e., FC and DEWA), FC had a larger biomass C stock but smaller
biomass C change, suggesting that the plots in FC were in a later
successional stage compared to the plots in DEWA. The greater
contribution of biomass C from the largest size classes and the high
mortality rate in smaller size classes in the FC (Fig. 5a and d) also
indicated forest maturity. Although the average stand age in FC
was younger than in DEWA (Table 1), possibly because a warmer
climate and greater atmospheric N deposition in FC compared to
DEWA and NS (Table 1) has allowed the forest in FC to accumulate
more biomass C in a shorter period of time, and the growth rate of
biomass C might have started to decline earlier (Odum, 1960;
Anderson-Teixeira et al., 2013). In contrast, biomass C stocks
increased at a greater rate in DEWA because the forests may be
in a relatively earlier successional stage and have greater potential
to sequester more biomass C in the future.
Dead biomass was a substantial C pool in the DRB forests, but its
change was also highly variable. The coefficients of variance ranged
from 214% to 325% in the three sites (Table 2). Changes in dead biomass were negatively correlated with live biomass changes at the
plot level (Suppl. Fig. 1), suggesting that biomass C lost from live
biomass is transferred to, and can be preserved in, dead biomass
for at least a decade. Dead biomass can thus function as a buffering
C pool, reducing the C turnover rate at the ecosystem scale (Woods,
2014). McGarvey et al. (2015) demonstrated that the contribution
of dead biomass to the total biomass C stock is larger in old-growth
forest compared to the surrounding younger forest in the midAtlantic region, which includes the DRB. As a result, we might
expect dead biomass C pools to increase in the future as the DRB
forest ages.
4.2. Environmental versus biotic factors in determining biomass C
change
The observed lack of correlation with climatic and topographic
factors for biomass C change is likely because the plot variation in
forest biomass is much larger than the spatial variation in environmental factors (as illustrated by scattering in a wide range vertically, but clustering in a small range horizontally in
Fig. 4a and b). The environmental factors were not adequate to
explain the variation in biomass C change within each site, while
biological factors such as tree mortality rate and stand age
appeared to be more important in determining variation in biomass C stock changes. Our results suggest that forest biomass C
change at the regional scale was mostly driven by internal
community-level processes such as competition and natural succession, more so than external environmental factors. This is consistent with previous studies that concluded that the direct effect
of climatic variables on long-term forest dynamics may be small
compare to successional processes and disturbances (Kardol
et al., 2010; Nowacki and Abrams, 2015; Zhang et al., 2015).
To explain the lack of correlation between environmental factors and biomass C change, two points need to be mentioned. First,
this result does not mean that forest biomass C is unaffected by cli-
B. Xu et al. / Forest Ecology and Management 374 (2016) 1–10
7
Fig. 5. Live tree biomass C and mortality rates in different tree size classes. Live tree biomass C in the two measurements in (a) French Creek, (b) Delaware Water Gap, and
(c) Neversink. Mortality rates (d) of the three research sites between the two measurements. The three sites are shown in different shades.
Fig. 6. Results from the NMS for live trees in the second measurement (2012–
2014). Points represent individual plots sampled and sites are represented by
different colors. See Suppl. Table 3 for the loading score of species.
mate change in the DRB. Caspersen et al. (2000) previously concluded that forest biomass C change results from a combination
of natural growth and enhancement by climate change, whose
effects cannot be easily separated. Second, environmental factors
may determine demographic change and disturbance regime, and
therefore may have indirect impacts on biomass C change
(Vanderwel et al., 2013b; Baez et al., 2015). However, these effects
are not strong enough to be detected at such small spatial scales
compared to the more dominant influence of plot dynamics. Long
term observations at more sites are needed to address the interactions between factors.
The observed negative correlation between stand age and biomass C change (Fig. 4c) is consistent with the forest succession
model, which predicts a decline in forest growth with increasing
stand age (Williams et al., 2012). Our observed correlation was
not particularly strong because the range of stand ages in our
DRB plots was relatively narrow, and the correlation was mostly
driven by the three plots with the youngest stand ages. The observation that younger forests accumulated more biomass C than
older forest over the past decade still indicated that most of the
forests in the DRB had reached or passed the stage of maximum
growth rate. While still accumulating C and thus acting as a sink,
the rate at which C may be sequestered in the future may decrease
as the age distribution shifts toward older stands in the DRB forest.
Although live biomass C loss from mortality could be preserved
in the ecosystem as dead biomass for several decades, tree mortality rates still had a significant impact on biomass C change
(Fig. 4d). A larger proportion of the spatial variation in biomass C
change can be explained by tree mortality rate, rather than the
average tree growth rate (Table 3), indicating the importance of
tree mortality in determining forest dynamics (Purves et al.,
2008; Xu et al., 2012). It has been reported that tree mortality rates
vary with climate, forest density, species and succession stage
(Bell, 1997; Brown and Schroeder, 1999; Lutz and Halpern, 2006;
Bond-Lamberty et al., 2014).
4.3. Demographic changes in different size classes and species
Large trees played an important role in determining forest biomass C stock in the DRB forest. The largest 10% of trees accounted
for 47% of the live tree biomass in FC, 41% in DEWA and 38% in NS.
8
B. Xu et al. / Forest Ecology and Management 374 (2016) 1–10
Fig. 7. Stem density and biomass C change in the fifteen most important species in the tree sites in the DRB forests: (a) French Creek, (b) Delaware Water Gap, and (c)
Neversink. The lengths of the bars represent the biomass C gain from recruitment and growth and biomass C loss from mortality. Data points on the left side of the zero line
represent decrease in stem density or biomass C stocks, and on the right side of the zero line represent increase in stem density or biomass C stocks. See Suppl. Table 1 for
species Latin names.
Between the two measurements, more biomass C was accumulated
in the larger size classes than smaller size classes (Suppl. Table 4),
which is consistent with other studies (Fedrigo et al., 2014). Biomass C increases in large trees can be attributed to increased number of large trees as a result of shifting forest age structure (as
small trees grow into large ones), and to faster growth rates of
large trees because they have better access to more resources such
as light and water than do small trees (Stephenson et al., 2014).
The fact that large trees in the DRB forests are still growing rapidly
indicated a large potential for biomass C increase in the future. In
this study, most of the trees in the largest size class (50–70 cm
DBH) are comparable to only the middle size class in the oldgrowth forest of the Mid-Atlantic (McGarvey et al., 2015). This
comparison further suggests that the forests in the DRB are likely
in a stage of middle succession, and could continue to be a carbon
sink in the future, although C sequestration rate may decline.
The highest mortality rates were observed in the smallest tree
size class (especially in FC, where the forest biomass largely
consisted of the largest size class, Fig. 5a and d), which can be
explained by severe competition in the understory layer. Once
individual tree height reaches the canopy height, growth is not
limited by light and the mortality rate decreases (Bell, 1997;
Miura et al., 2001). Our observations contrast with the pattern of
mortality rate increasing with stem size as reported in an oldgrowth forest (Runkle, 2013). It is observed that as forests age,
the peak of mortality biomass C loss shifts from young, small trees
to large, dominant trees (Bond-Lamberty et al., 2014; Woods,
2014; Rozendaal and Chazdon, 2015). However, increased mortality rate in large trees was only present in DEWA, which has the largest sample size (number of trees = 953), and not in FC and NS,
which both have a smaller number of trees in the largest size class.
Stem density decreased in most of the major species, probably
due to the self-thinning process caused by resource competition
during forest development (Coomes and Allen, 2007). Although
tree density decreased, live tree biomass C stock in the DRB forest
still increased because the loss of biomass C from mortality was
B. Xu et al. / Forest Ecology and Management 374 (2016) 1–10
offset by recruitment and growth in most of the dominant species.
However, the balance between growth, recruitment and mortality
varies dramatically among species. Our results reflect the importance of species-specific disturbances such as non-native insects
and diseases, which may threaten a single species or genus of trees
(Lovett et al., 2002; Flower et al., 2013). These disturbances are
gradually changing the species composition in the DRB forest and
may have profound impacts on biomass C stock change by altering
the demographic change in different tree species (Hicke et al.,
2012; Fahey et al., 2013).
For example, in the oak-hickory forests in FC and DEWA, oak
species (e.g. chestnut oak and black oak in FC, white oak and chestnut oak in DEWA) are declining in both stem density and biomass C
stock. The possible reasons for oak decline include regional selective harvesting and defoliation induced by gypsy moth outbreaks,
or infestation of sudden oak death (Murdoch et al., 2008).
In the maple–beech–birch forests in NS, the most dominant
species, American beech, was affected by infestations of beech bark
disease (Griffin et al., 2003; Lovett et al., 2013), causing the largest
biomass C loss from mortality (mostly from the largest size class)
and the largest biomass C gain from recruitment among all the species and sites. These results implied that the forests in the NS are in
the aftermath phase of the disease, in which the disease may stimulate regeneration and change the forest structure (Houston, 1994;
Forrester et al., 2003).
4.4. Implications for regional C cycle and forest management
In this study, periodic long-term field measurements of tree and
forest biomass allowed the quantification of total biomass C stock
change and how the demographics of individual tree species contributed to the total biomass change of the forest. Our results
showed that forest biomass in the DRB was a relatively large carbon sink over the past decade compared with other sites in the
Northeast U.S. and the national average. It is likely that the DRB
forest will continue to be a carbon sink in the coming decades,
because the forest is in its middle rather than a late successional
steady state (Odum, 1969). These results can serve as a reference
level according to international standards for evaluating the potential of forest management and forest health protection to increase
biomass C sequestration in the DRB forest in the future (FAO,
2015).
We found that biomass C stock changes were driven by tree
demographic change, which varied with tree size and species. This
highlights the potential importance of species-specific disturbances such as insects and pathogens which have become major
determinants of individual tree species demographic changes,
and how the changing frequency and severity of these disturbances
might impact forest biomass C sequestration. Our results can provide important information for understanding forest recovery processes in major forest types of the northeastern U.S., and for
improving ecological modeling and forest management at the
regional scale. Forest management strategies need to pay close
attention to the species that show declines in density and biomass
over time, or are likely to show such declines in the near future,
especially late successional species susceptible to biotic disturbances, to ensure sustainable forest development and a continuing
biomass carbon sink.
Acknowledgements
This study was supported by United States Forest Service grant
number 14-JV-11242306-083. We thank Lukas Jenkins, Adam
Cesaneka, Jingyu Ji, Vanessa Eni, Ashley Crespo, Alexa Dugan, and
Matthew Patterson for assistance in field sampling. We also
9
acknowledge the private landowners that permitted access to their
properties for field measurement.
Appendix A. Supplementary material
Supplementary data associated with this article can be found, in
the online version, at />045.
References
Anderson-Teixeira, K.J., Miller, A.D., Mohan, J.E., Hudiburg, T.W., Duval, B.D.,
DeLucia, E.H., 2013. Altered dynamics of forest recovery under a changing
climate. Glob. Change Biol. 19, 2001–2021. />gcb.12194.
Baez, S., Malizia, A., Carilla, J., Blundo, C., Aguilar, M., Aguirre, N., et al., 2015. Largescale patterns of turnover and basal area change in Andean forests. PLoS ONE
10. />Barford, C.C., Wofsy, S.C., Goulden, M.L., Munger, J.W., Pyle, E.H., Urbanski, S.P., et al.,
2001. Factors controlling long- and short-term sequestration of atmospheric
CO2 in a mid-latitude forest. Science 294, 1688–1691. />10.1126/science.1062962.
Bedison, J.E., Johnson, A.H., Willig, S.A., Richter, S.L., Moyer, A., 2007. Two decades of
change in vegetation in Adirondack spruce-fir, northern hardwood and pinedominated forests. J. Torrey Bot. Soc. 134, 238–252. />1095-5674(2007)134[238:tdociv]2.0.co;2.
Bell, D.T., 1997. Eighteen years of change in an Illinois streamside deciduous forest.
J. Torrey Bot. Soc. 124, 174–188. />Birdsey, R., Pregitzer, K., Lucier, A., 2006. Forest carbon management in the United
States: 1600–2100. J. Environ. Qual. 35, 1461–1469. />10.2134/jeq2005.0162.
Bonan, G.B., 2008. Forests and climate change: forcings, feedbacks, and the climate
benefits
of
forests.
Science
320,
1444–1449.
/>10.1126/science.1155121.
Bond-Lamberty, B., Rocha, A.V., Calvin, K., Holmes, B., Wang, C.K., Goulden, M.L.,
2014. Disturbance legacies and climate jointly drive tree growth and mortality
in an intensively studied boreal forest. Glob. Change Biol. 20, 216–227. http://
dx.doi.org/10.1111/gcb.12404.
Brandeis, T.J., Helmer, E.H., Marcano-Vega, H., Lugo, A.E., 2009. Climate shapes the
novel plant communities that form after deforestation in Puerto Rico and the US
Virgin Islands. For. Ecol. Manage. 258, 1704–1718. />j.foreco.2009.07.030.
Brooks, R.T., 2003. Abundance, distribution, trends, and ownership patterns of
early-successional forests in the northeastern United States. For. Ecol. Manage.
185, 65–74. />Brown, S.L., Schroeder, P.E., 1999. Spatial patterns of aboveground production and
mortality of woody biomass for eastern US forests. Ecol. Appl. 9, 968–980.
/>Caspersen, J.P., Pacala, S.W., Jenkins, J.C., Hurtt, G.C., Moorcroft, P.R., Birdsey, R.A.,
2000. Contributions of land-use history to carbon accumulation in US forests.
Science 290, 1148–1151. />Ciais, P., Sabine, C., Bala, G., Bopp, L., Brovkin, V., Canadell, J., et al., 2013. Carbon and
Other Biogeochemical Cycles. Cambridge University Press, Cambridge, United
Kingdom and New York, NY, USA.
Cole, J.A., Johnson, K.D., Birdsey, R.A., Pan, Y., Wayson, C.A., McCullough, K., et al.,
2013. Database for landscape-scale carbon monitoring sites. U.S. Department of
Agriculture, Forest Service, Northern Research Station, Newtown square, PA. p.
12 p.
Coomes, D.A., Allen, R.B., 2007. Mortality and tree-size distributions in natural
mixed-age forests. J. Ecol. 95, 27–40. />Curtis, P.S., Hanson, P.J., Bolstad, P., Barford, C., Randolph, J.C., Schmid, H.P., et al.,
2002. Biometric and eddy-covariance based estimates of annual carbon storage
in five eastern North American deciduous forests. Agric. For. Meteorol. 113, 3–
19. />Duarte, N., Pardo, L.H., Robin-Abbott, M.J., 2013. Susceptibility of forests in the
northeastern USA to nitrogen and sulfur deposition: critical load exceedance
and forest health. Water Air Soil Pollut. 224, 21. />s11270-012-1355-6.
Fahey, T.J., Sherman, R.E., Weinstein, D.A., 2013. Demography, biomass and
productivity of a northern hardwood forest on the Allegheny Plateau. J.
Torrey Bot. Soc. 140, 52–64. />Fedrigo, M., Kasel, S., Bennett, L.T., Roxburgh, S.H., Nitschke, C.R., 2014. Carbon
stocks in temperate forests of south-eastern Australia reflect large tree
distribution and edaphic conditions. For. Ecol. Manage. 334, 129–143. http://
dx.doi.org/10.1016/j.foreco.2014.08.025.
Flower, C.E., Knight, K.S., Gonzalez-Meler, M.A., 2013. Impacts of the emerald ash
borer (Agrilus planipennis Fairmaire) induced ash (Fraxinus spp.) mortality on
forest carbon cycling and successional dynamics in the eastern United States.
Biol. Invasions 15, 931–944. />Food and Agriculture Organization, 2015. Technical Considerations for Forest
Reference Emission Level and/or Forest Reference Level Construction for REDD+
10
B. Xu et al. / Forest Ecology and Management 374 (2016) 1–10
Under the UNFCCC. UN-REDD Programme Secretariat, Switzerland. Report
available at: < />Forrester, J.A., McGee, G.G., Mitchell, M.J., 2003. Effects of beech bark disease on
aboveground biomass and species composition in a mature northern hardwood
forest, 1985 to 2000. J. Torrey Bot. Soc. 130, 70–78. />3557531.
Griffin, J.M., Lovett, G.M., Arthur, M.A., Weathers, K.C., 2003. The distribution and
severity of beech bark disease in the Catskill Mountains, NY. Can. J. Forest Res. –
Revue Canadienne De Recherche Forestiere 33, 1754–1760. />10.1139/x03-093.
Grimm, J.W., 2008. Product Description and Rationale for Wet Deposition Estimates
for the Eastern United States In: G. E. Consulting, editor Boalsburg, PA.
Gunn, J.S., Ducey, M.J., Whitman, A.A., 2014. Late-successional and old-growth
forest carbon temporal dynamics in the Northern Forest (Northeastern USA).
For. Ecol. Manage. 312, 40–46.
Hicke, J.A., Allen, C.D., Desai, A.R., Dietze, M.C., Hall, R.J., Hogg, E.H., et al., 2012.
Effects of biotic disturbances on forest carbon cycling in the United States and
Canada. Glob. Change Biol. 18, 7–34. />Houston, D.R., 1994. Major new tree disease epidemics – beech bark disease. Annu.
Rev.
Phytopathol.
32,
75–87.
/>py.32.090194.000451.
Hyvonen, R., Agren, G.I., Linder, S., Persson, T., Cotrufo, M.F., Ekblad, A., et al., 2007.
The likely impact of elevated CO2, nitrogen deposition, increased temperature
and management on carbon sequestration in temperate and boreal forest
ecosystems: a literature review. New Phytol. 173, 463–480. />10.1111/j.1469-8137.2007.01967.x.
Jenkins, J.C., Chojnacky, D.C., Heath, L.S., Birdsey, R.A., 2004. Comprehensive
database of diameter-based biomass regressions for North American tree
species. In: Service, F. (Ed.). USDA Forest Service, Newtown Square PA.
Kardol, P., Todd, D.E., Hanson, P.J., Mulholland, P.J., 2010. Long-term successional
forest dynamics: species and community responses to climatic variability. J.
Veg. Sci. 21, 627–642. />Kauffman, G., Belden, A., Homsey, A., 2008. Technical Summary: State of the
Delaware River Basin Report. Newark, Delaware, p. 189.
Lovett, G.M., Arthur, M.A., Weathers, K.C., Griffin, J.M., Annals, N.Y.A.S., 2013. Effects
of introduced insects and diseases on forest ecosystems in the Catskill
Mountains of New York. Eff. Clim. Change Invasive Species Ecosyst. Integrity
Water Qual. 1298, 66–77. />Lovett, G.M., Christenson, L.M., Groffman, P.M., Jones, C.G., Hart, J.E., Mitchell, M.J.,
2002. Insect defoliation and nitrogen cycling in forests. Bioscience 52, 335–341.
052[0335:idanci]2.0.co;2.
Lu, X.L., Kicklighter, D.W., Melillo, J.M., Yang, P., Rosenzweig, B., Vorosmarty, C.J.,
et al., 2013. A contemporary carbon balance for the northeast region of the
United States. Environ. Sci. Technol. 47, 13230–13238. />10.1021/es403097z.
Lutz, J.A., Halpern, C.B., 2006. Tree mortality during early forest development: a
long-term study of rates, causes, and consequences. Ecol. Monogr. 76, 257–275.
076[0257:tmdefd]2.0.co;2.
Luyssaert, S., Inglima, I., Jung, M., Richardson, A.D., Reichstein, M., Papale, D., et al.,
2007. CO2 balance of boreal, temperate, and tropical forests derived from a
global database. Glob. Change Biol. 13, 2509–2537. />j.1365-2486.2007.01439.x.
Makana, J.R., Ewango, C.N., McMahon, S.M., Thomas, S.C., Hart, T.B., Condit, R., 2011.
Demography and biomass change in monodominant and mixed old-growth
forest of the Congo. J. Trop. Ecol. 27, 447–461. />s0266467411000265.
McGarvey, J.C., Thompson, J.R., Epstein, H.E., Shugart, H.H., 2015. Carbon storage in
old-growth forests of the Mid-Atlantic: toward better understanding the
eastern forest carbon sink. Ecology 96, 311–317. />Miura, M., Manabe, T., Nishimura, N., Yamamoto, S.I., 2001. Forest canopy and
community dynamics in a temperate old-growth evergreen broad-leaved forest,
south-western Japan: a 7-year study of a 4-ha plot. J. Ecol. 89, 841–849. http://
dx.doi.org/10.1046/j.0022-0477.2001.00603.x.
Murdoch, P.S., Jenkins, J.C., Birdsey, R.A., 2008. The Delaware River Basin
Collaborative Environmental Monitoring and Research Initiative: Foundation
Document. Gen. Tech. Rep. NRS-25. Department of Agriculture, Forest Service,
Northern Research Station PA. p. 93.
Nowacki, G.J., Abrams, M.D., 2015. Is climate an important driver of post-European
vegetation change in the Eastern United States? Glob. Change Biol. 21, 314–334.
/>Nunery, J.S., Keeton, W.S., 2010. Forest carbon storage in the northeastern United
States: net effects of harvesting frequency, post-harvest retention, and wood
products. For. Ecol. Manage. 259, 1363–1375. />j.foreco.2009.12.029.
Odum, E.P., 1960. Organic production and turnover in old field succession. Ecology
41, 34–49. />Odum, E.P., 1969. Strategy of ecosystem development. Science 164, 262. http://dx.
doi.org/10.1126/science.164.3877.262.
Pan, Y., Birdsey, R.A., Fang, J., Houghton, R., Kauppi, P.E., Kurz, W.A., et al., 2011. A
large and persistent carbon sink in the world’s forests. Science 333, 988–993.
/>Pan, Y.D., Birdsey, R.A., Phillips, O.L., Jackson, R.B., 2013. The structure, distribution,
and biomass of the world’s forests. Annu. Rev. Ecol. Evol. Syst. 44, 593. http://dx.
doi.org/10.1146/annurev-ecolsys-110512-135914.
Purves, D.W., Lichstein, J.W., Strigul, N., Pacala, S.W., 2008. Predicting and
understanding forest dynamics using a simple tractable model. Proc. Natl.
Acad. Sci. USA 105, 17018–17022. />Rozendaal, D.M.A., Chazdon, R.L., 2015. Demographic drivers of tree biomass change
during secondary succession in northeastern Costa Rica. Ecol. Appl. 25, 506–
516. />Runkle, J.R., 2013. Thirty-two years of change in an old-growth Ohio beech–maple
forest. Ecology 94, 1165–1175.
Siccama, T.G., Fahey, T.J., Johnson, C.E., Sherry, T.W., Denny, E.G., Girdler, E.B., et al.,
2007. Population and biomass dynamics of trees in a northern hardwood forest
at Hubbard Brook. Can. J. Forest Res. – Revue Canadienne De Recherche
Forestiere 37, 737–749. />Stephenson, N.L., Das, A.J., Condit, R., Russo, S.E., Baker, P.J., Beckman, N.G., et al.,
2014. Rate of tree carbon accumulation increases continuously with tree size.
Nature 507, 90. />Thornton, P.E., Thornton, M.M., Mayer, B.W., Wilhelmi, N., Wei, Y., Devarakonda, R.,
et al., 2014. Daymet: daily surface weather data on a 1-km grid for North
America, version 2. In: Center, O.R.N.L.D.A.A. (Ed.). Oak Ridge, Tennessee, USA.
Turner, D.P., Koerper, G.J., Harmon, M.E., Lee, J.J., 1995. A carbon budget for forests of
the conterminous United States. Ecol. Appl. 5, 421–436. />10.2307/1942033.
U.S. Department of Agriculture, F.S. 2014. Forest Inventory and Analysis Natinal
Core Field Guide.
van Doorn, N.S., Battles, J.J., Fahey, T.J., Siccama, T.G., Schwarz, P.A., 2011. Links
between biomass and tree demography in a northern hardwood forest: a
decade of stability and change in Hubbard Brook Valley, New Hampshire. Can. J.
Forest Res. – Revue Canadienne De Recherche Forestiere 41, 1369–1379. http://
dx.doi.org/10.1139/x11-063.
Vanderwel, M.C., Coomes, D.A., Purves, D.W., 2013a. Quantifying variation in forest
disturbance, and its effects on aboveground biomass dynamics, across the
eastern United States. Glob. Change Biol. 19, 1504–1517. />10.1111/gcb.12152.
Vanderwel, M.C., Lyutsarev, V.S., Purves, D.W., 2013b. Climate-related variation in
mortality and recruitment determine regional forest-type distributions. Glob.
Ecol. Biogeogr. 22, 1192–1203. />Waddell, L.K., 2002. Sampling coarse woody debris for multiple attributes in
extensive resource inventories. Ecol. Ind. 1, 139–153.
Williams, C.A., Collatz, G.J., Masek, J., Goward, S.N., 2012. Carbon consequences of
forest disturbance and recovery across the conterminous United States. Global
Biogeochem. Cycles 26. />Woodall, C., Williams, M., 2005. Sampling protocol, estimation, and analysis
procedures for down woody materials indicator of the FIA program. In: F.S.
Department of Agriculture, North Centeral Research Station, (Ed.), Department
of Agriculture, Forest Service, North Centeral Research Station. p. 47.
Woodbury, P.B., Smith, J.E., Heath, L.S., 2007. Carbon sequestration in the US forest
sector from 1990 to 2010. For. Ecol. Manage. 241, 14–27. />10.1016/j.foreco.2006.12.008.
Woods, K.D., 2014. Multi-decade biomass dynamics in an old-growth hemlocknorthern hardwood forest, Michigan. USA. Peerj 2. />peerj.598.
Xu, B., Yang, Y.H., Li, P., Shen, H.H., Fang, J.Y., 2014. Global patterns of ecosystem
carbon flux in forests: a biometric data-based synthesis. Global Biogeochem.
Cycles 28, 962–973. />Xu, C.Y., Turnbull, M.H., Tissue, D.T., Lewis, J.D., Carson, R., Schuster, W.S.F., et al.,
2012. Age-related decline of stand biomass accumulation is primarily due to
mortality and not to reduction in NPP associated with individual tree
physiology, tree growth or stand structure in a Quercus-dominated forest. J.
Ecol. 100, 428–440. />Yi, C.X., Ricciuto, D., Li, R., Wolbeck, J., Xu, X.Y., Nilsson, M., et al., 2010. Climate
control of terrestrial carbon exchange across biomes and continents. Environ.
Res. Lett. 5, 10. />Zhang, J., Huang, S.M., He, F.L., 2015. Half-century evidence from western Canada
shows forest dynamics are primarily driven by competition followed by
climate. Proc. Natl. Acad. Sci. USA 112, 4009–4014. />pnas.1420844112.